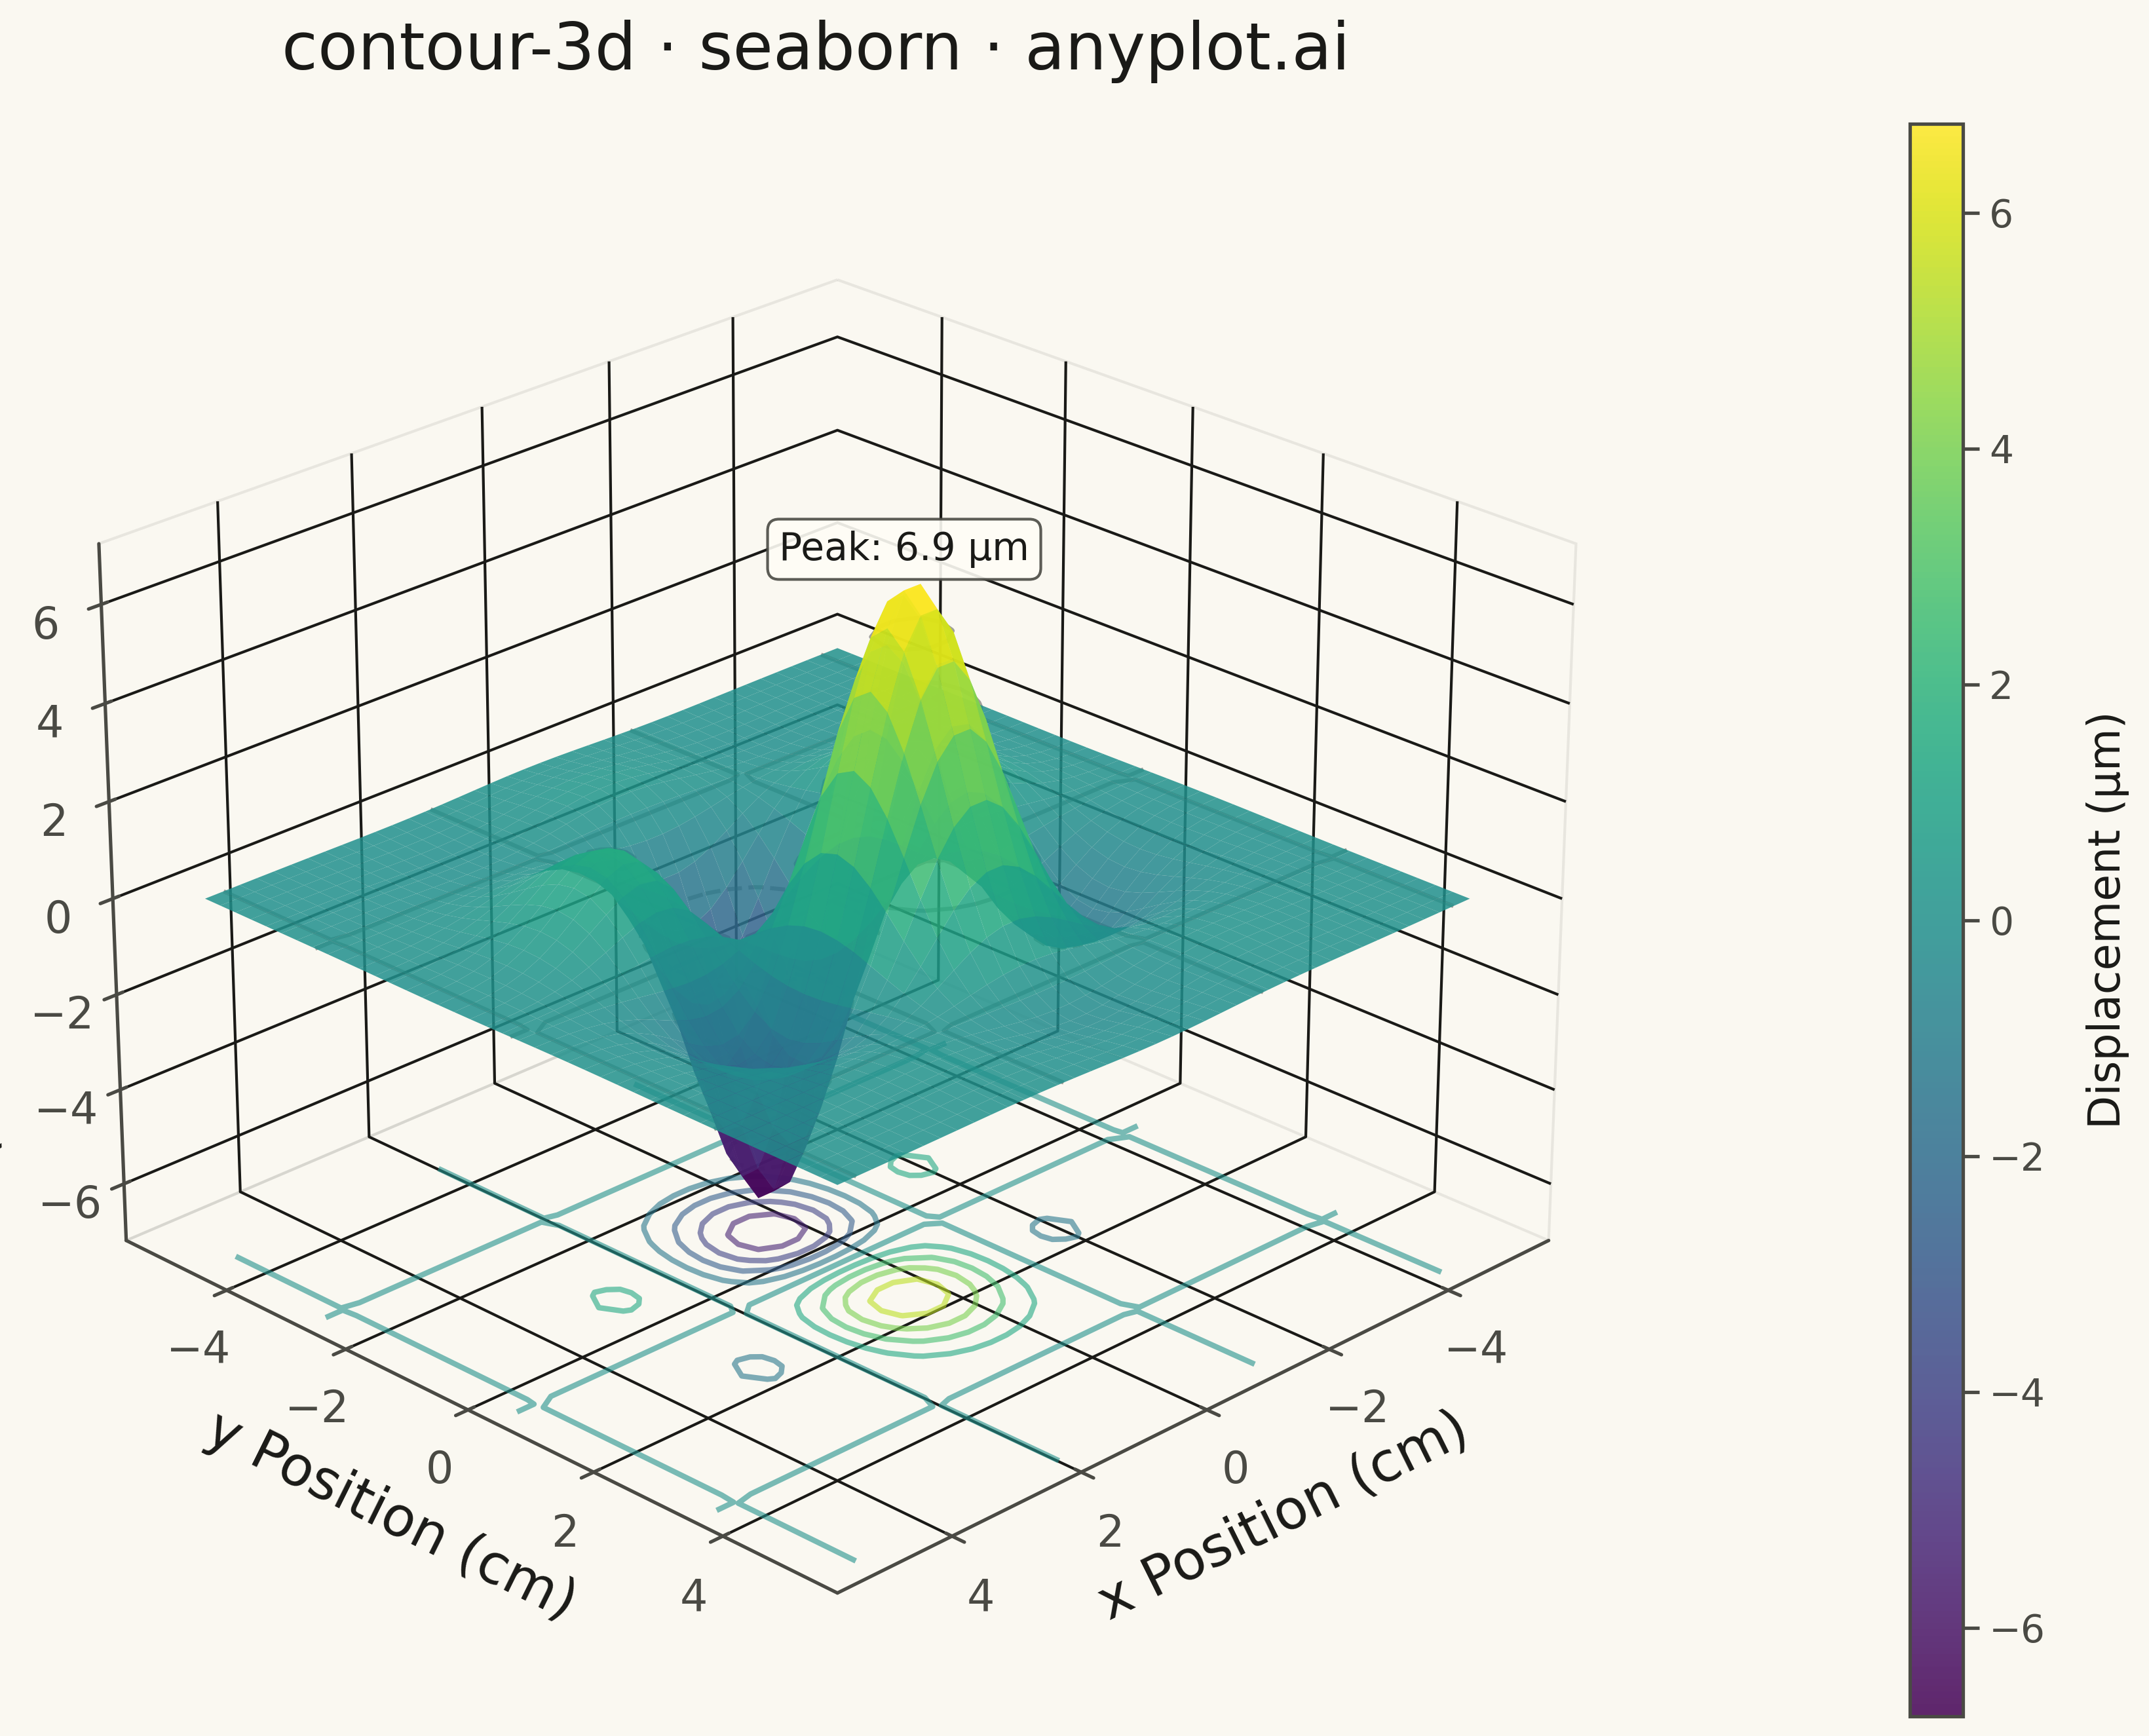
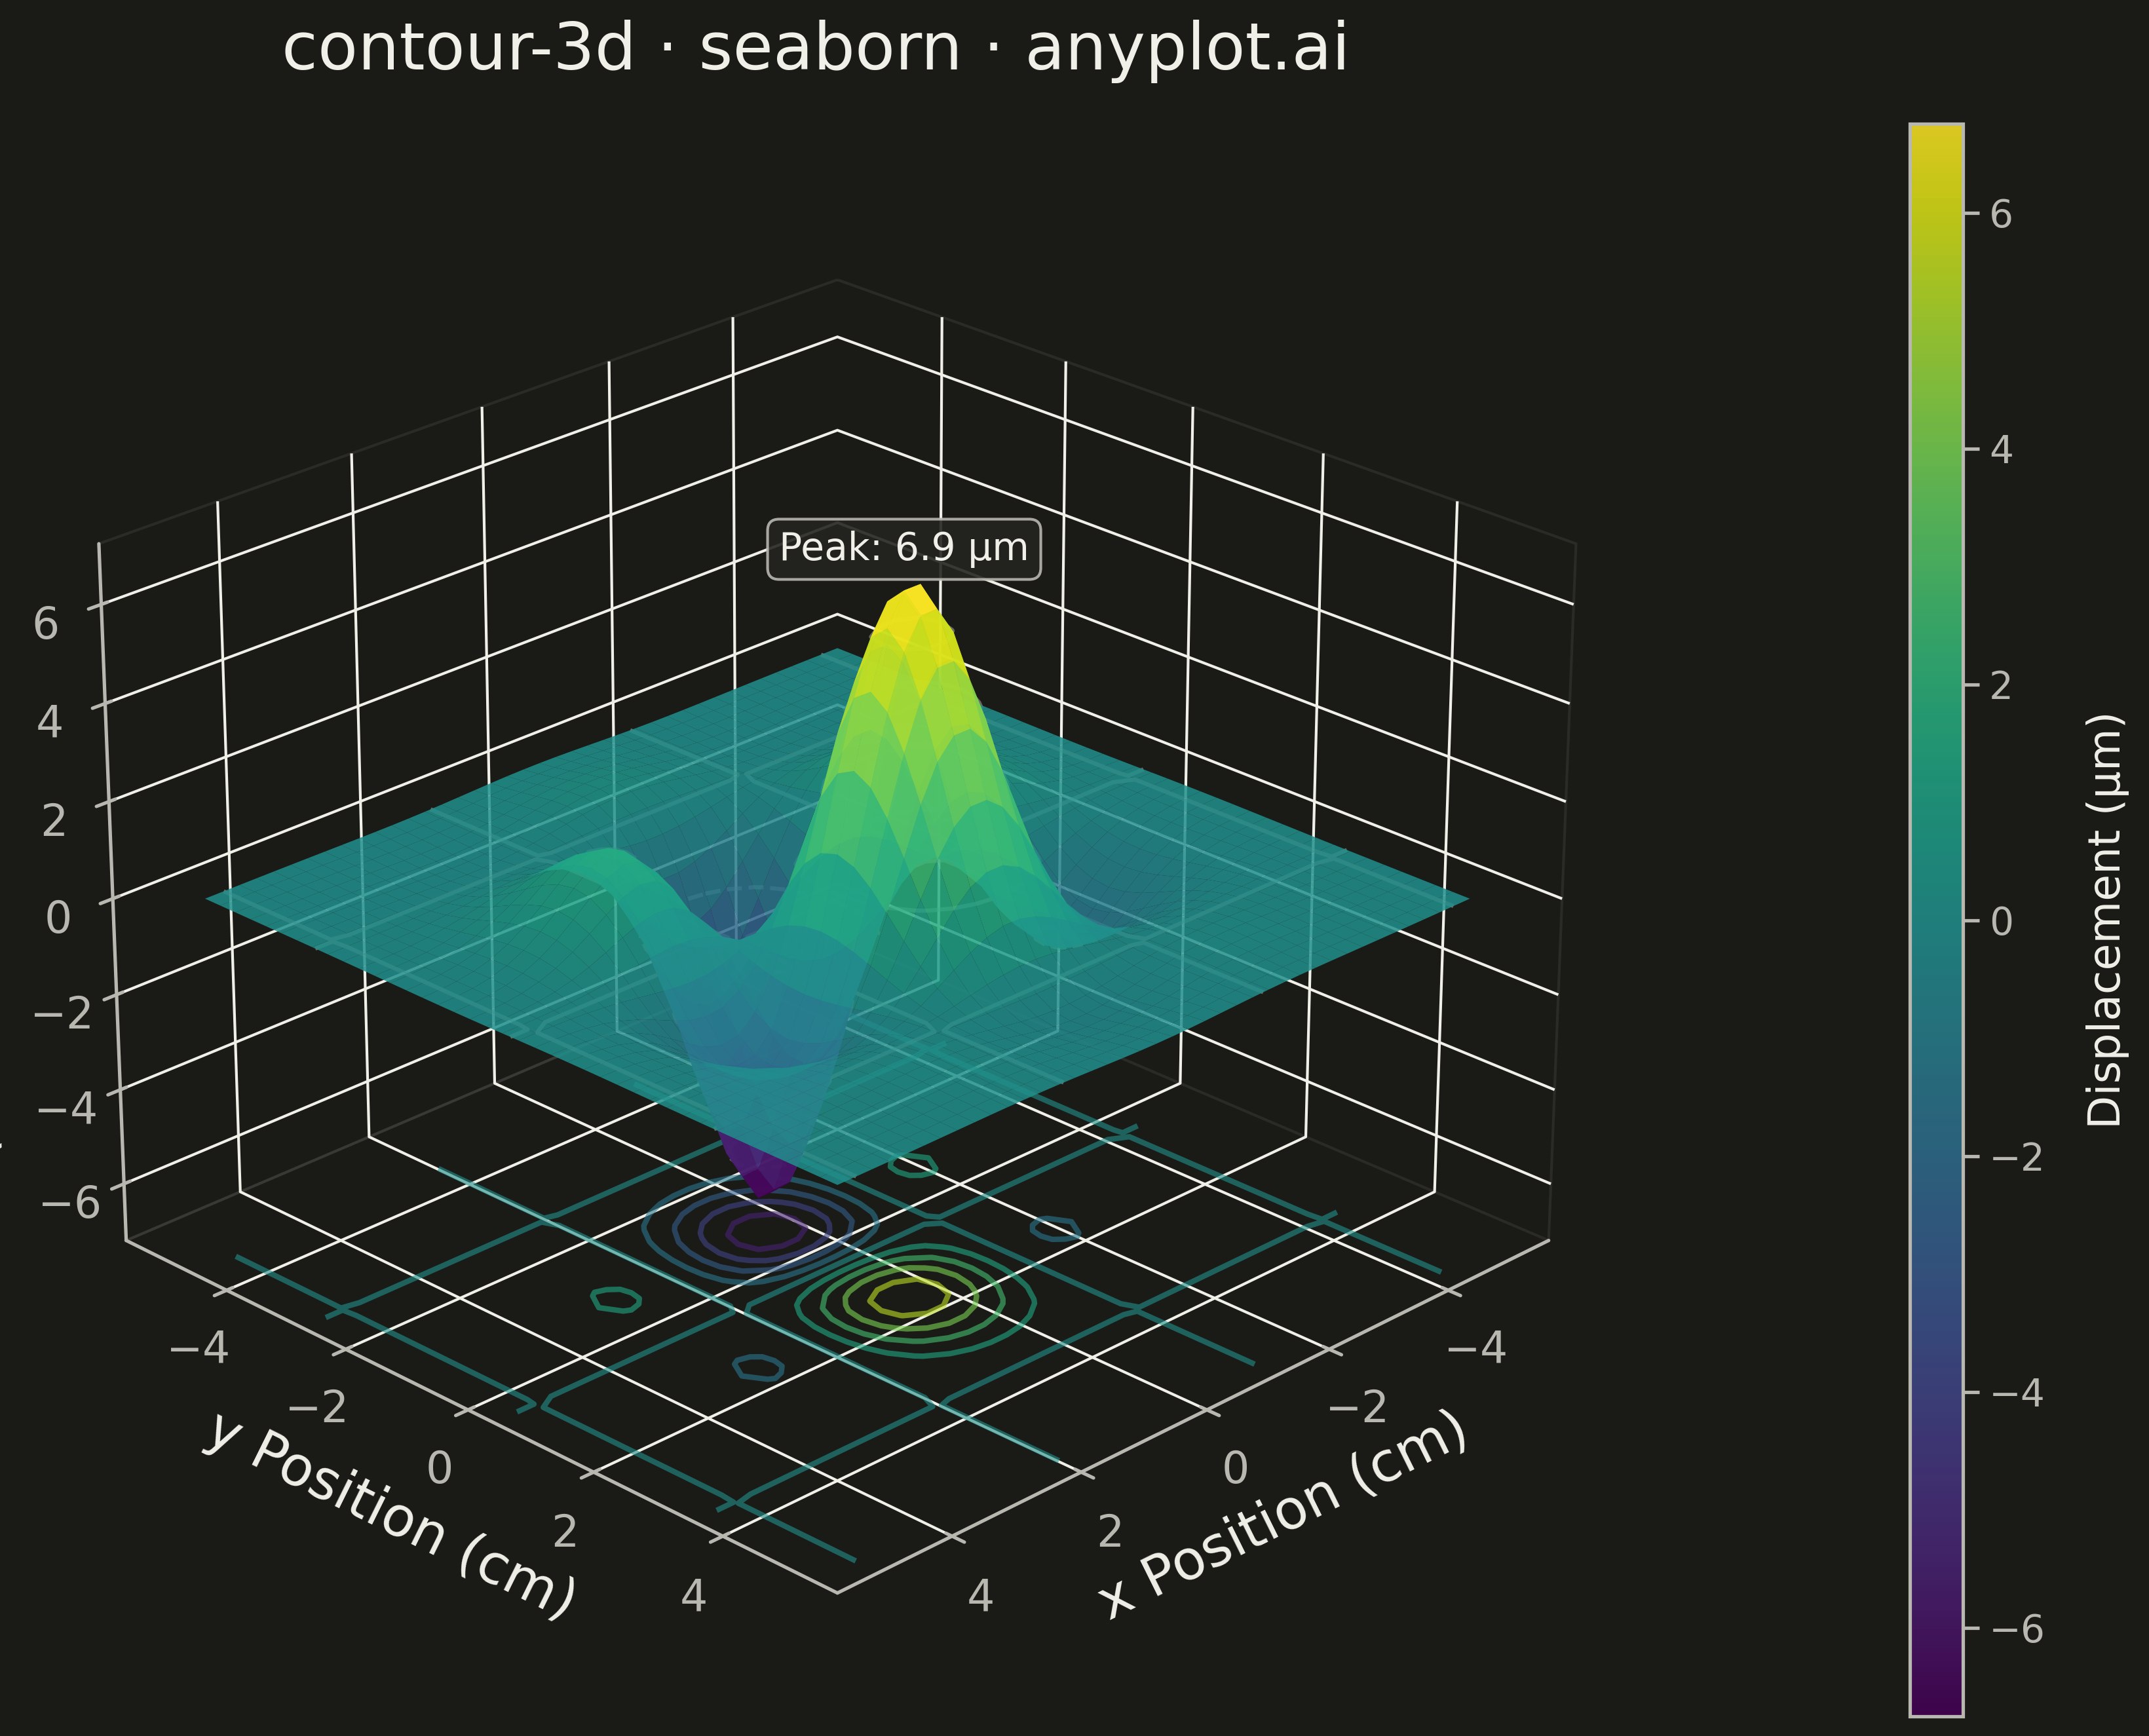
The same plot in 13 other libraries — Python: Altair, Bokeh, lets-plot, Matplotlib, Plotly, Pygal; R: ggplot2; Julia: Makie.jl; JavaScript: Chart.js, D3.js, Apache ECharts, Highcharts, MUI X Charts. Compare all 14 side by side: 3D Contour Plot in Python, R, Julia and JavaScript.
A 3D contour plot displays contour lines or filled contour bands on a three-dimensional surface, showing isolines of a function of two variables in 3D space. Unlike 2D contour plots that flatten the visualization, 3D contour plots preserve the surface geometry while highlighting level curves, making it easier to understand both the overall shape and specific value regions simultaneously. This visualization combines the spatial intuition of 3D surfaces with the precision of contour-based value identification.
""" anyplot.ai
contour-3d: 3D Contour Plot
Library: seaborn 0.13.2 | Python 3.13.15
Quality: 87/100 | Updated: 2026-08-25
"""

import os
import sys


# Remove script directory temporarily — local matplotlib.py would shadow the package
_here = sys.path.pop(0)

import matplotlib.pyplot as plt
import numpy as np
import seaborn as sns
from matplotlib.colors import TwoSlopeNorm, to_rgba


sys.path.insert(0, _here)

THEME = os.getenv("ANYPLOT_THEME", "light")
PAGE_BG = "#FAF8F1" if THEME == "light" else "#1A1A17"
ELEVATED_BG = "#FFFDF6" if THEME == "light" else "#242420"
INK = "#1A1A17" if THEME == "light" else "#F0EFE8"
INK_SOFT = "#4A4A44" if THEME == "light" else "#B8B7B0"

sns.set_theme(
    style="ticks",
    rc={
        "figure.facecolor": PAGE_BG,
        "axes.facecolor": PAGE_BG,
        "axes.edgecolor": INK_SOFT,
        "axes.labelcolor": INK,
        "text.color": INK,
        "xtick.color": INK_SOFT,
        "ytick.color": INK_SOFT,
        "grid.color": INK,
        "grid.alpha": 0.15,
        "legend.facecolor": ELEVATED_BG,
        "legend.edgecolor": INK_SOFT,
    },
)

# Data — vibration displacement on a plate (physical science context)
x = np.linspace(-5, 5, 40)
y = np.linspace(-5, 5, 40)
X, Y = np.meshgrid(x, y)
Z_raw = np.exp(-(X**2 + Y**2) / 5) * np.cos(X) * np.sin(Y)
Z = Z_raw * 10  # scale to micrometers

# Zero displacement (equilibrium) is a meaningful midpoint, so a diverging
# Imprint colormap maps naturally onto "above rest" vs "below rest".
midpoint = PAGE_BG
imprint_div = sns.blend_palette(["#AE3030", midpoint, "#4467A3"], as_cmap=True)
norm = TwoSlopeNorm(vmin=Z.min(), vcenter=0, vmax=Z.max())

# Plot — square canvas suits a cube-shaped 3D box better than 16:9 (avoids
# the dead space a landscape figure leaves beside a centered 3D axes box)
fig = plt.figure(figsize=(6, 6), dpi=400, facecolor=PAGE_BG)
ax = fig.add_subplot(111, projection="3d")
ax.set_facecolor(PAGE_BG)
ax.set_box_aspect((1, 1, 0.8), zoom=1.12)

# 3D surface
surf = ax.plot_surface(
    X, Y, Z, cmap=imprint_div, norm=norm, alpha=0.85, edgecolor="none", linewidth=0, antialiased=True
)

# On-surface contour lines — lifted a hair above the surface (z-fighting
# otherwise hides segments behind surface polygons), bold ink color, fully
# opaque so they read clearly against the semi-transparent diverging fill
contour_lift = (Z.max() - Z.min()) * 0.006
ax.contour(X, Y, Z + contour_lift, levels=12, colors=INK, alpha=1.0, linewidths=2.5)

# Projected contours onto base plane — same colormap/norm as the surface for reference
z_min = Z.min() - 0.8
ax.contour(X, Y, Z, levels=12, zdir="z", offset=z_min, cmap=imprint_div, norm=norm, alpha=0.7, linewidths=1.6)

# Colorbar
cbar = fig.colorbar(surf, ax=ax, pad=0.06, fraction=0.035, aspect=28)
cbar.set_label("Displacement (μm)", fontsize=10, color=INK, labelpad=10)
cbar.ax.tick_params(labelsize=8, colors=INK_SOFT)
cbar.outline.set_edgecolor(INK_SOFT)

# Axis labels with physical units
ax.set_xlabel("x Position (cm)", fontsize=10, color=INK, labelpad=8)
ax.set_ylabel("y Position (cm)", fontsize=10, color=INK, labelpad=8)
ax.set_zlabel("Displacement (μm)", fontsize=10, color=INK, labelpad=8)
fig.suptitle("contour-3d · python · seaborn · anyplot.ai", fontsize=12, fontweight="medium", color=INK, y=0.97)

ax.tick_params(axis="both", labelsize=8, colors=INK_SOFT)
ax.xaxis.label.set_color(INK)
ax.yaxis.label.set_color(INK)
ax.zaxis.label.set_color(INK)
ax.grid(True, alpha=0.15, color=INK_SOFT, linewidth=0.8)

ax.view_init(elev=25, azim=45)

# Panes — edges only, no fill
ax.xaxis.pane.fill = False
ax.yaxis.pane.fill = False
ax.zaxis.pane.fill = False
ax.xaxis.pane.set_edgecolor(INK_SOFT)
ax.yaxis.pane.set_edgecolor(INK_SOFT)
ax.zaxis.pane.set_edgecolor(INK_SOFT)
ax.xaxis.pane.set_alpha(0.1)
ax.yaxis.pane.set_alpha(0.1)
ax.zaxis.pane.set_alpha(0.1)

# mplot3d doesn't fully honor ax.grid(alpha=...) for pane grid lines —
# restyle the internal grid color/linewidth directly so the box reads as
# subtle theme chrome instead of bold high-contrast lines
subtle_grid = to_rgba(INK_SOFT, alpha=0.15)
for pane_axis in (ax.xaxis, ax.yaxis, ax.zaxis):
    pane_axis._axinfo["grid"].update(color=subtle_grid, linewidth=0.5)
    pane_axis.pane.set_linewidth(0.5)

# Peak annotation — identify and label the maximum displacement point
peak_idx = np.unravel_index(np.argmax(Z), Z.shape)
peak_x, peak_y, peak_z = X[peak_idx], Y[peak_idx], Z[peak_idx]
ax.text(
    peak_x,
    peak_y,
    peak_z + 0.6,
    f"Peak: {peak_z:.1f} μm",
    fontsize=8,
    color=INK,
    bbox={"facecolor": ELEVATED_BG, "edgecolor": INK_SOFT, "alpha": 0.9, "boxstyle": "round,pad=0.3"},
    ha="center",
)

fig.subplots_adjust(left=0.06, right=0.90, top=0.90, bottom=0.06)
plt.savefig(f"plot-{THEME}.png", dpi=400, facecolor=PAGE_BG)
Runnable source as JSON, for any HTTP client: https://api.anyplot.ai/specs/contour-3d/seaborn/code. Any spec id and library id listed in llms-full.txt fit the same URL shape; every URL below is complete and callable.
{
  "spec_id": "contour-3d",
  "language": "python",
  "library": "seaborn",
  "page": "https://anyplot.ai/contour-3d/python/seaborn",
  "hub": "https://anyplot.ai/contour-3d",
  "code_json": "https://api.anyplot.ai/specs/contour-3d/seaborn/code",
  "spec_json": "https://api.anyplot.ai/specs/contour-3d",
  "render_light_png": "https://storage.googleapis.com/anyplot-images/plots/contour-3d/python/seaborn/plot-light.png",
  "render_dark_png": "https://storage.googleapis.com/anyplot-images/plots/contour-3d/python/seaborn/plot-dark.png",
  "quality_score": 87.0,
  "license": "MIT",
  "guide": "https://anyplot.ai/llms.txt"
}
Part of 3D Contour Plot on anyplot.ai.