The same plot in 14 other libraries — Python: Altair, Bokeh, lets-plot, Matplotlib, Plotly, plotnine, Pygal, Seaborn; Julia: Makie.jl; JavaScript: Chart.js, D3.js, Apache ECharts, Highcharts, MUI X Charts. Compare all 15 side by side: Crossword Puzzle Grid in Python, R, Julia and JavaScript.
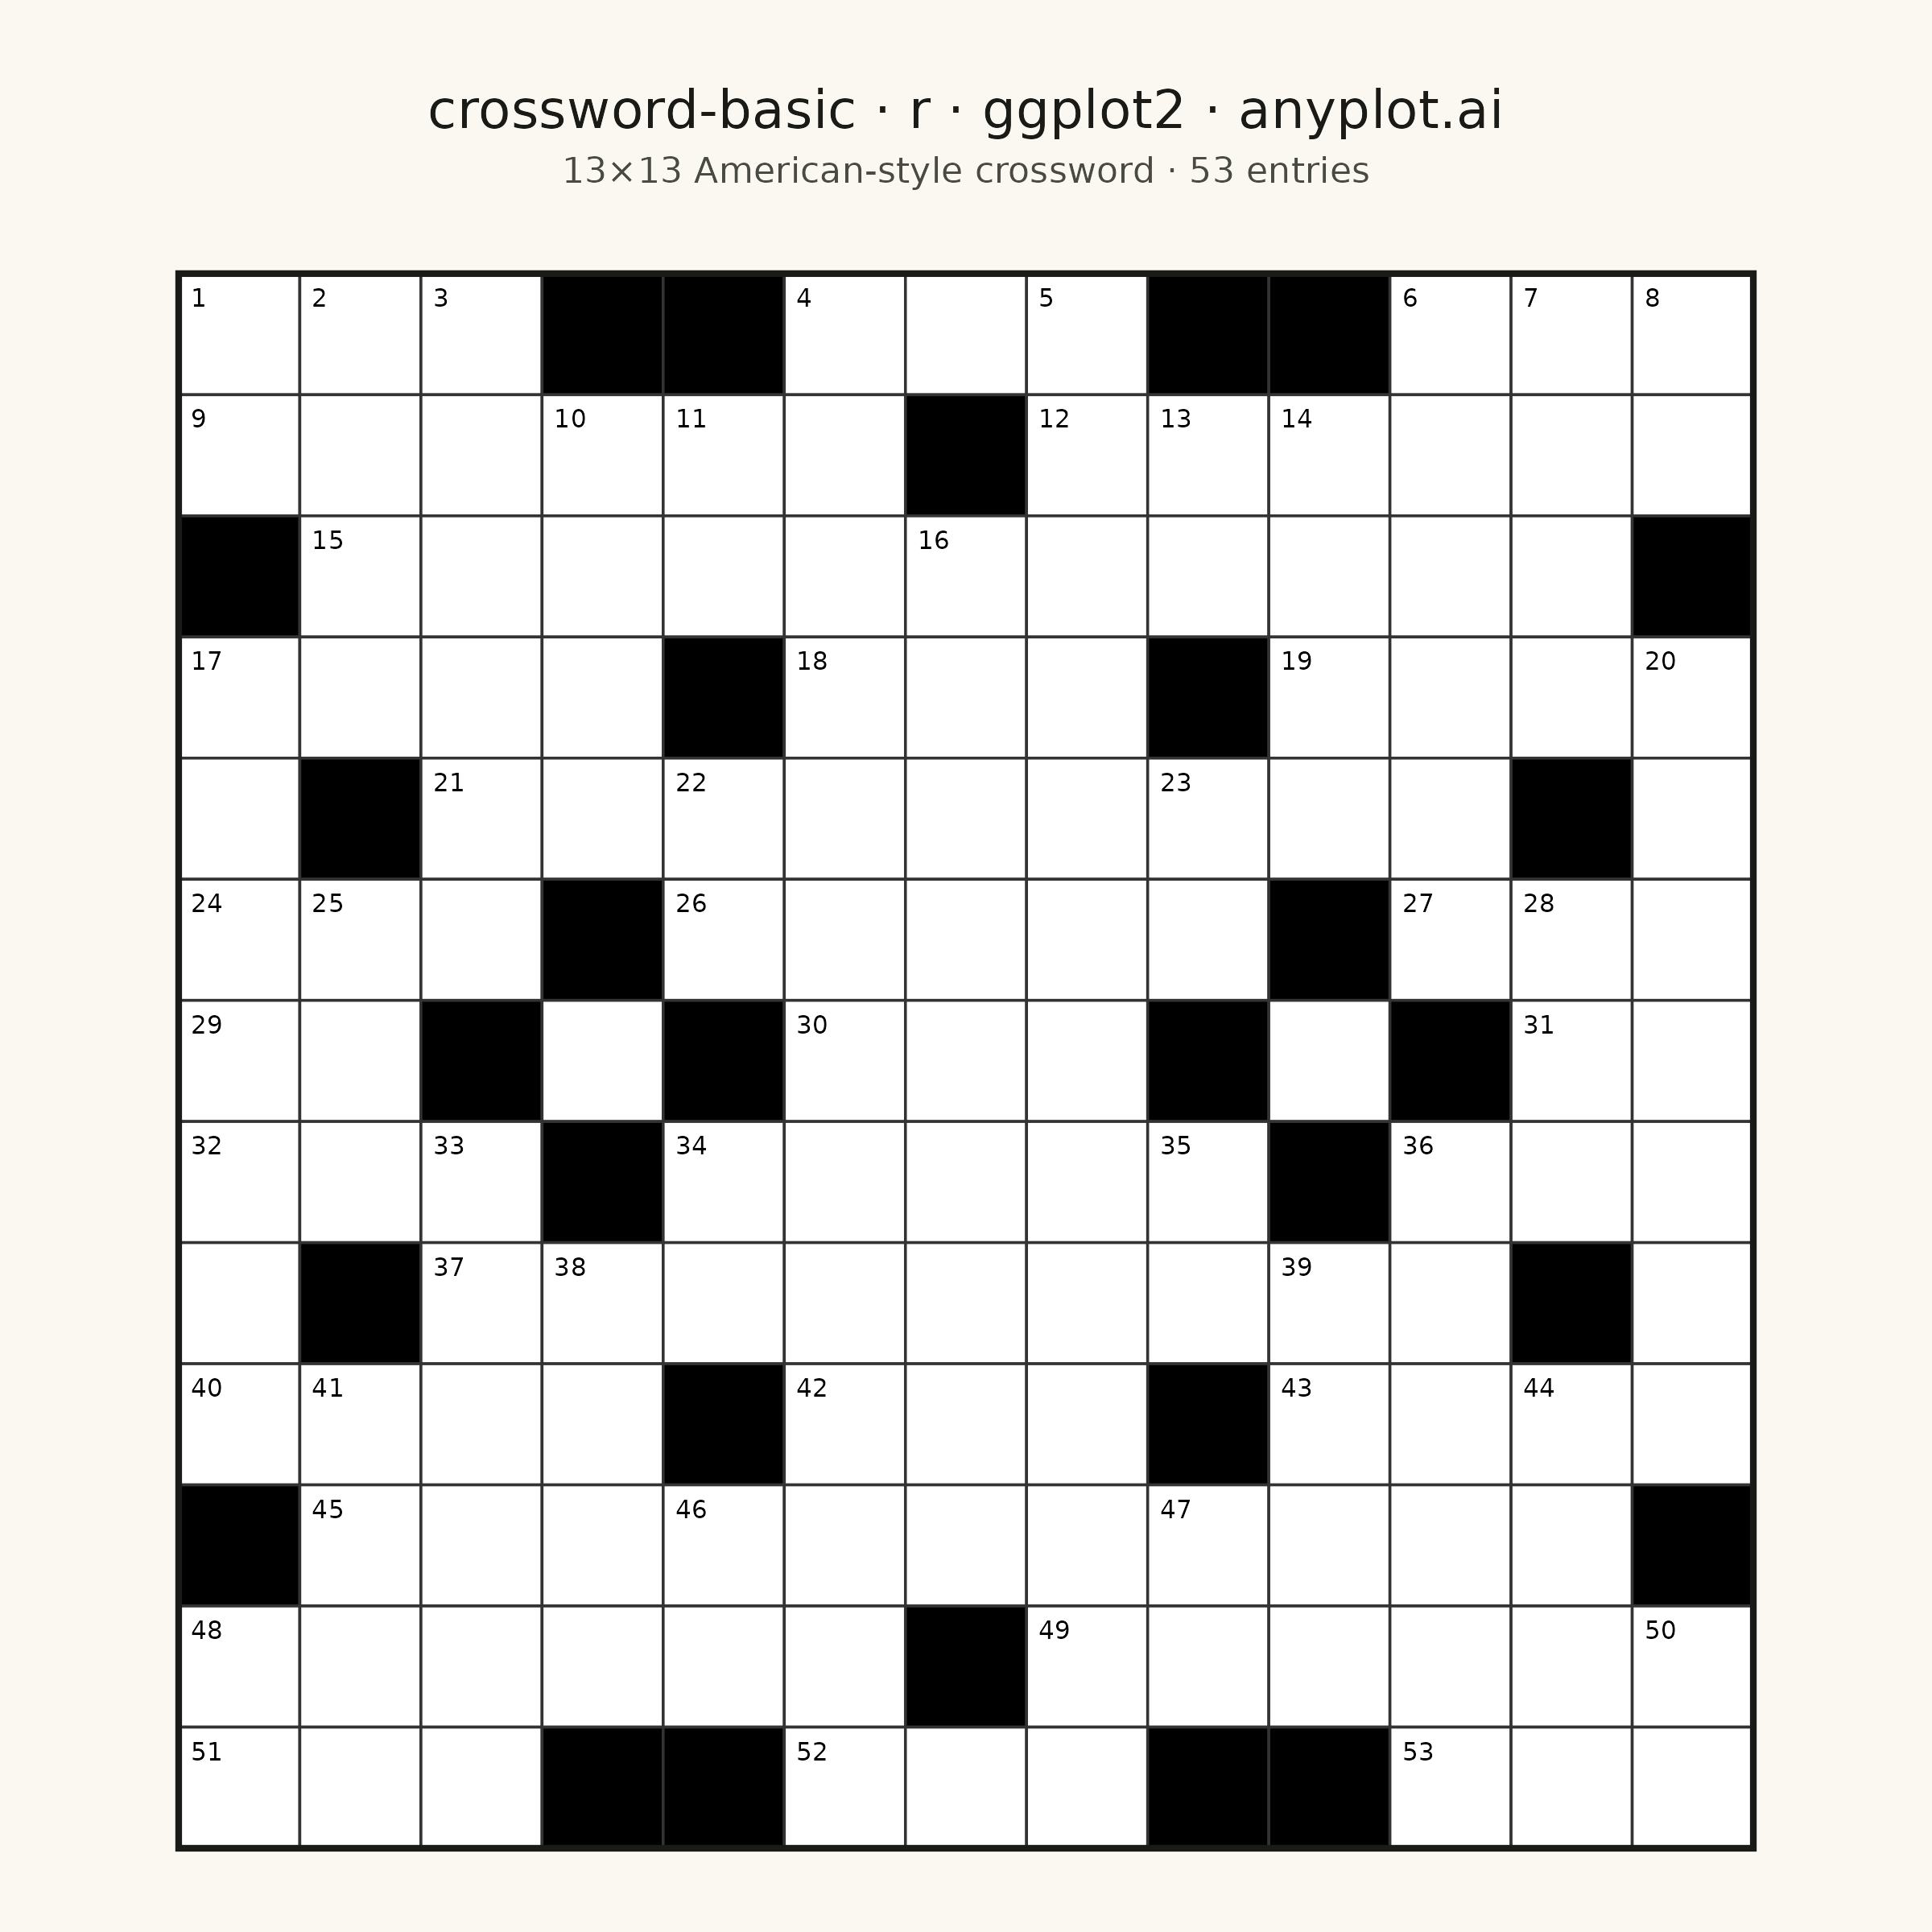
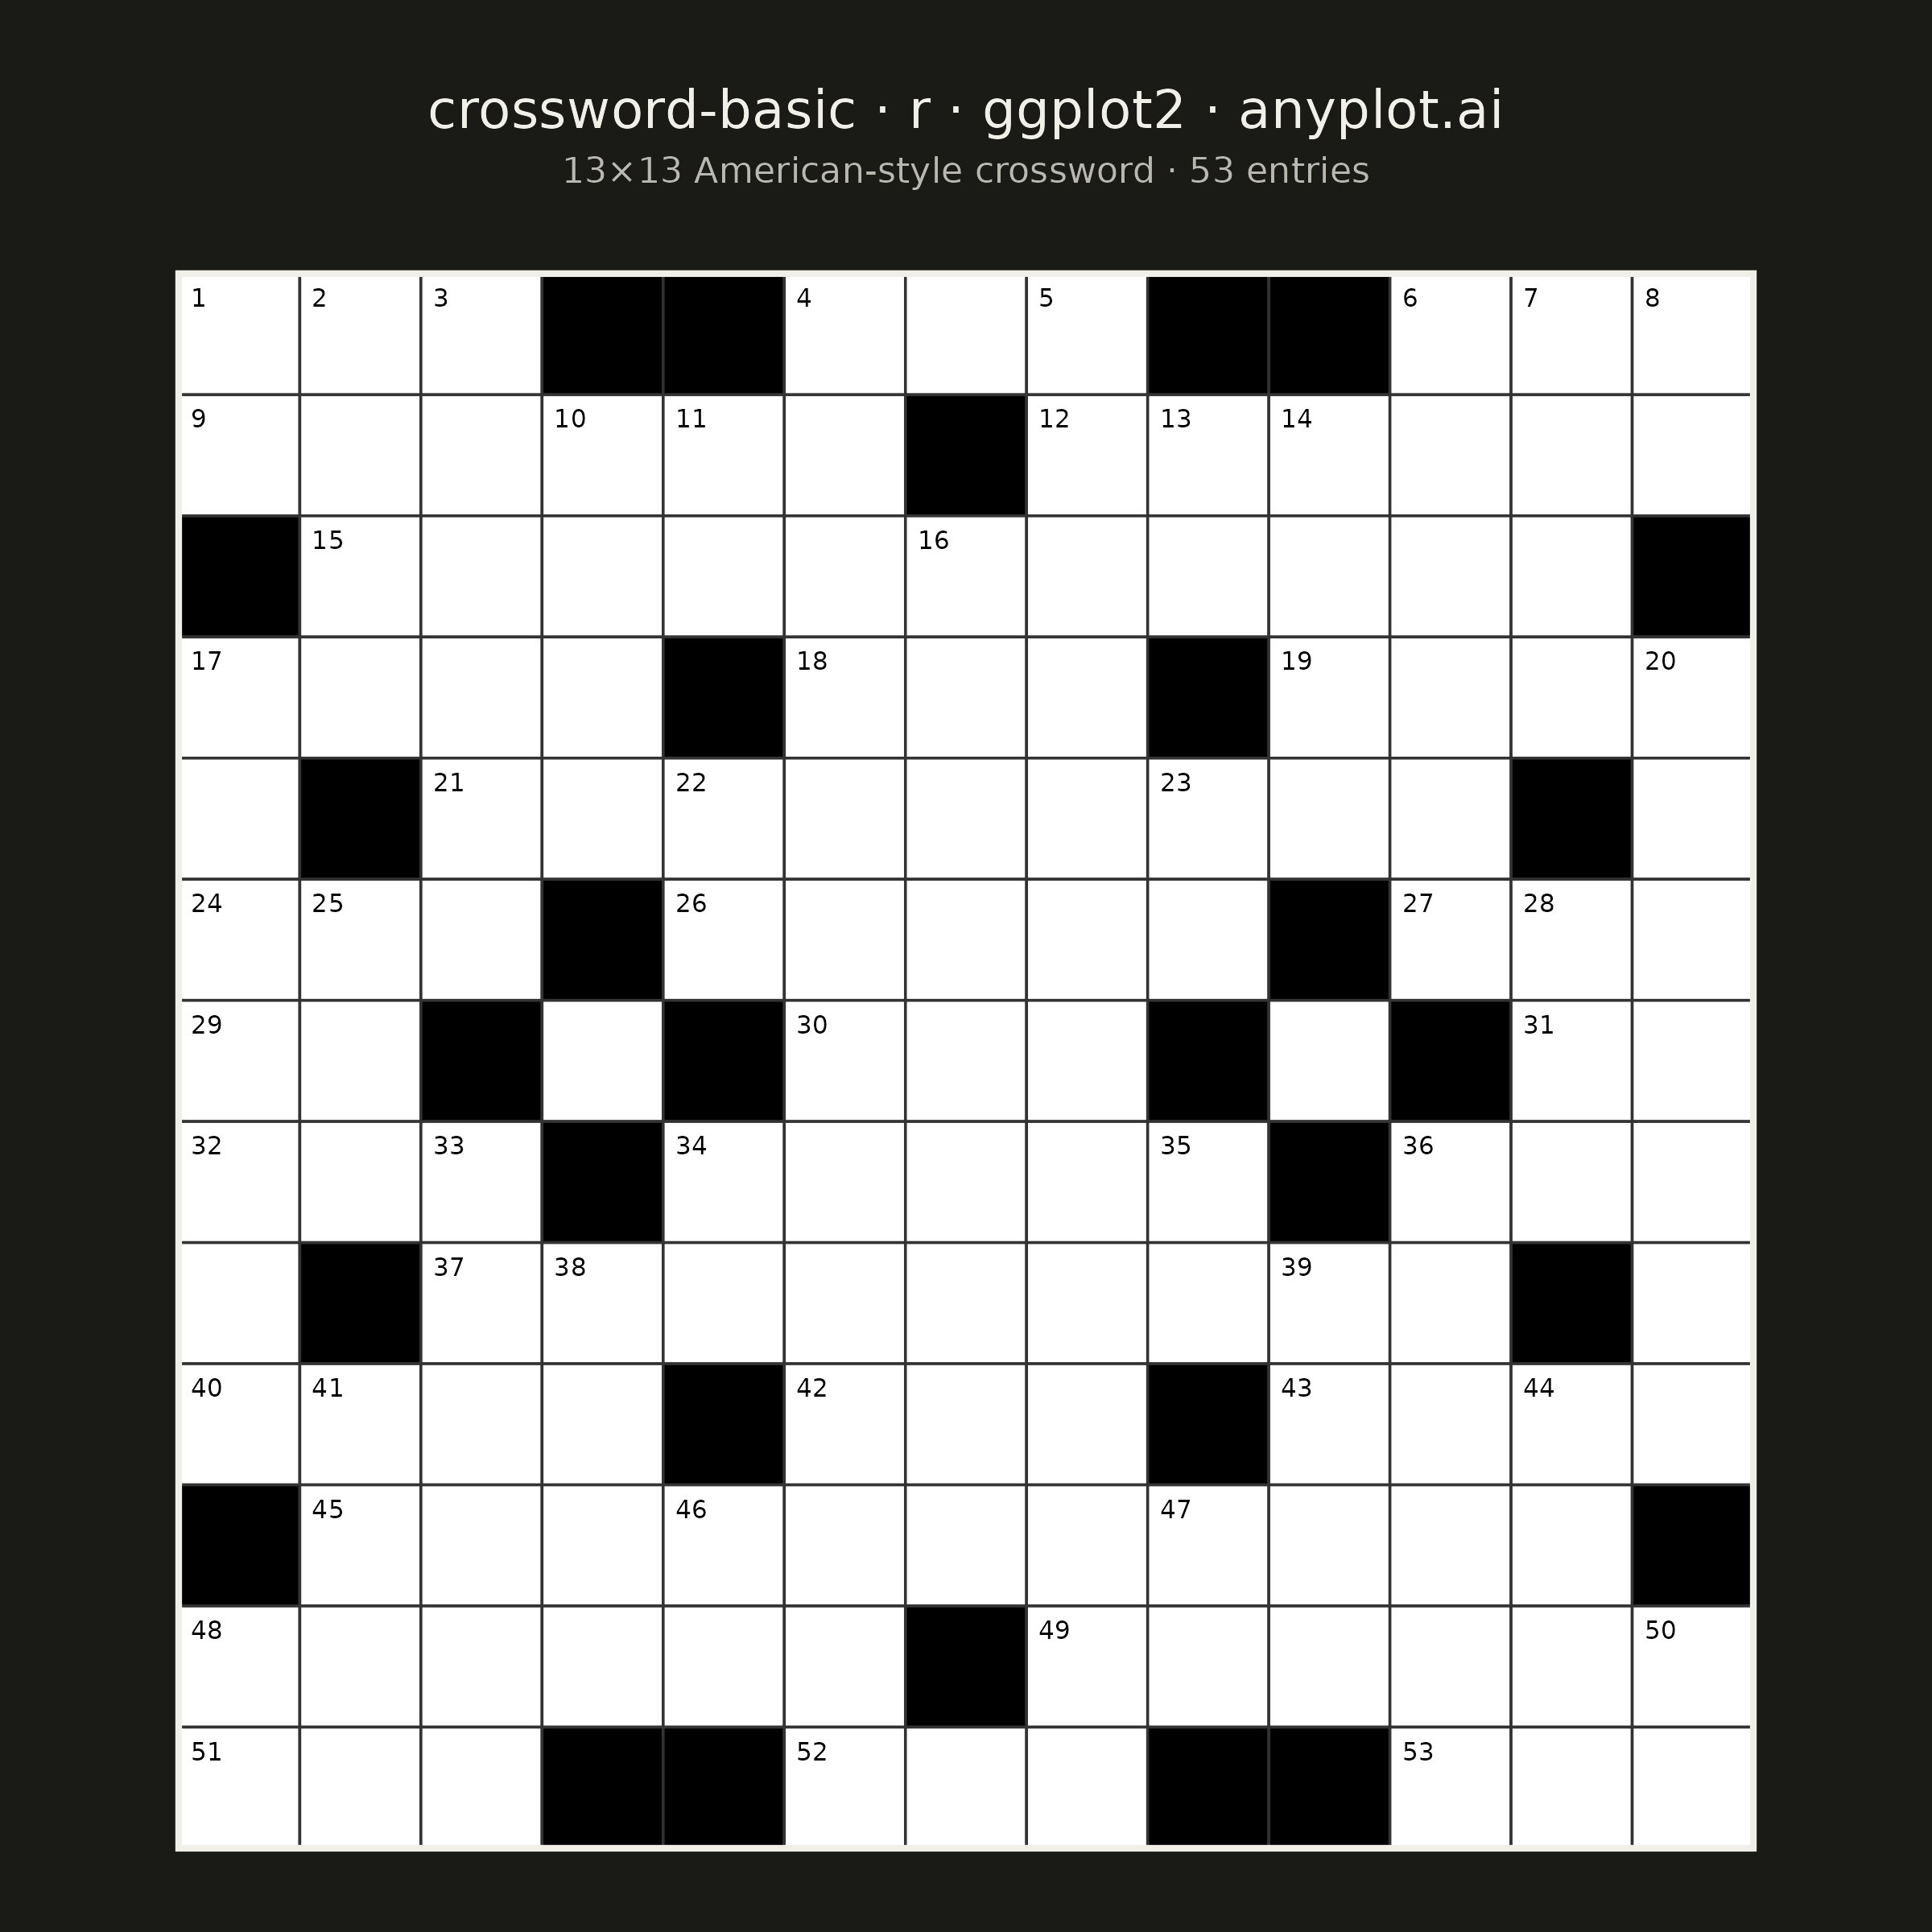
A crossword puzzle grid visualization with white entry cells for letters, black blocking cells, and numbered starting positions for across and down words. The symmetric black cell pattern follows traditional newspaper-style crossword conventions, creating a clean and recognizable puzzle layout suitable for printing or digital display.
#' anyplot.ai
#' crossword-basic: Crossword Puzzle Grid
#' Library: ggplot2 3.5.1 | R 4.4.1
#' Quality: 89/100 | Created: 2026-05-20

library(ggplot2)
library(ragg)

# Theme tokens
THEME    <- Sys.getenv("ANYPLOT_THEME", "light")
PAGE_BG  <- if (THEME == "light") "#FAF8F1" else "#1A1A17"
INK      <- if (THEME == "light") "#1A1A17" else "#F0EFE8"
INK_SOFT <- if (THEME == "light") "#4A4A44" else "#B8B7B0"

# 13x13 crossword grid (1 = black cell, 0 = entry cell)
# Traditional 180-degree rotational symmetry
n <- 13
grid_data <- matrix(c(
  0,0,0,1,1,0,0,0,1,1,0,0,0,
  0,0,0,0,0,0,1,0,0,0,0,0,0,
  1,0,0,0,0,0,0,0,0,0,0,0,1,
  0,0,0,0,1,0,0,0,1,0,0,0,0,
  0,1,0,0,0,0,0,0,0,0,0,1,0,
  0,0,0,1,0,0,0,0,0,1,0,0,0,
  0,0,1,0,1,0,0,0,1,0,1,0,0,
  0,0,0,1,0,0,0,0,0,1,0,0,0,
  0,1,0,0,0,0,0,0,0,0,0,1,0,
  0,0,0,0,1,0,0,0,1,0,0,0,0,
  1,0,0,0,0,0,0,0,0,0,0,0,1,
  0,0,0,0,0,0,1,0,0,0,0,0,0,
  0,0,0,1,1,0,0,0,1,1,0,0,0
), nrow = n, ncol = n, byrow = TRUE)

# Cell data frame — row 1 at top, so plot y = n + 1 - row
rows_idx <- rep(1:n, each = n)
cols_idx <- rep(1:n, times = n)

df <- data.frame(
  col        = cols_idx,
  y          = n + 1 - rows_idx,
  fill_color = ifelse(
    as.logical(grid_data[cbind(rows_idx, cols_idx)]),
    "black", "white"
  )
)

# Assign clue numbers in reading order (top-left to bottom-right)
num_list <- list()
clue_n   <- 1
for (r in 1:n) {
  for (c in 1:n) {
    is_across <- grid_data[r, c] == 0 &&
      (c == 1 || grid_data[r, c - 1] == 1) &&
      c < n && grid_data[r, c + 1] == 0
    is_down <- grid_data[r, c] == 0 &&
      (r == 1 || grid_data[r - 1, c] == 1) &&
      r < n && grid_data[r + 1, c] == 0
    if (is_across || is_down) {
      num_list[[length(num_list) + 1]] <- data.frame(
        col   = c,
        y     = n + 1 - r,
        label = as.character(clue_n)
      )
      clue_n <- clue_n + 1
    }
  }
}
num_df <- do.call(rbind, num_list)

# Plot
p <- ggplot(df, aes(x = col, y = y)) +
  geom_tile(aes(fill = fill_color), color = "#333333", linewidth = 0.3) +
  scale_fill_identity() +
  geom_text(
    data  = num_df,
    aes(x = col - 0.40, y = y + 0.38, label = label),
    size  = 2.0,
    color = "black",
    hjust = 0,
    vjust = 1
  ) +
  annotate(
    "rect",
    xmin = 0.5, xmax = n + 0.5,
    ymin = 0.5, ymax = n + 0.5,
    fill      = NA,
    color     = INK,
    linewidth = 0.7
  ) +
  coord_fixed(ratio = 1, clip = "off") +
  scale_x_continuous(expand = expansion(add = 0.25)) +
  scale_y_continuous(expand = expansion(add = 0.25)) +
  labs(
    title    = "crossword-basic · r · ggplot2 · anyplot.ai",
    subtitle = "13×13 American-style crossword · 53 entries"
  ) +
  theme_void() +
  theme(
    plot.background = element_rect(fill = PAGE_BG, color = PAGE_BG),
    plot.title = element_text(
      color  = INK,
      size   = 12,
      hjust  = 0.5,
      margin = margin(t = 8, b = 4)
    ),
    plot.subtitle = element_text(
      color  = INK_SOFT,
      size   = 8,
      hjust  = 0.5,
      margin = margin(b = 12)
    ),
    plot.margin = margin(12, 15, 12, 15)
  )

# Save
ggsave(
  filename = sprintf("plot-%s.png", THEME),
  plot     = p,
  device   = ragg::agg_png,
  width    = 6,
  height   = 6,
  units    = "in",
  dpi      = 400
)
Runnable source as JSON, for any HTTP client: https://api.anyplot.ai/specs/crossword-basic/ggplot2/code. Any spec id and library id listed in llms-full.txt fit the same URL shape; every URL below is complete and callable.
{
  "spec_id": "crossword-basic",
  "language": "r",
  "library": "ggplot2",
  "page": "https://anyplot.ai/crossword-basic/r/ggplot2",
  "hub": "https://anyplot.ai/crossword-basic",
  "code_json": "https://api.anyplot.ai/specs/crossword-basic/ggplot2/code",
  "spec_json": "https://api.anyplot.ai/specs/crossword-basic",
  "render_light_png": "https://storage.googleapis.com/anyplot-images/plots/crossword-basic/r/ggplot2/plot-light.png",
  "render_dark_png": "https://storage.googleapis.com/anyplot-images/plots/crossword-basic/r/ggplot2/plot-dark.png",
  "quality_score": 89.0,
  "license": "MIT",
  "guide": "https://anyplot.ai/llms.txt"
}
Part of Crossword Puzzle Grid on anyplot.ai.