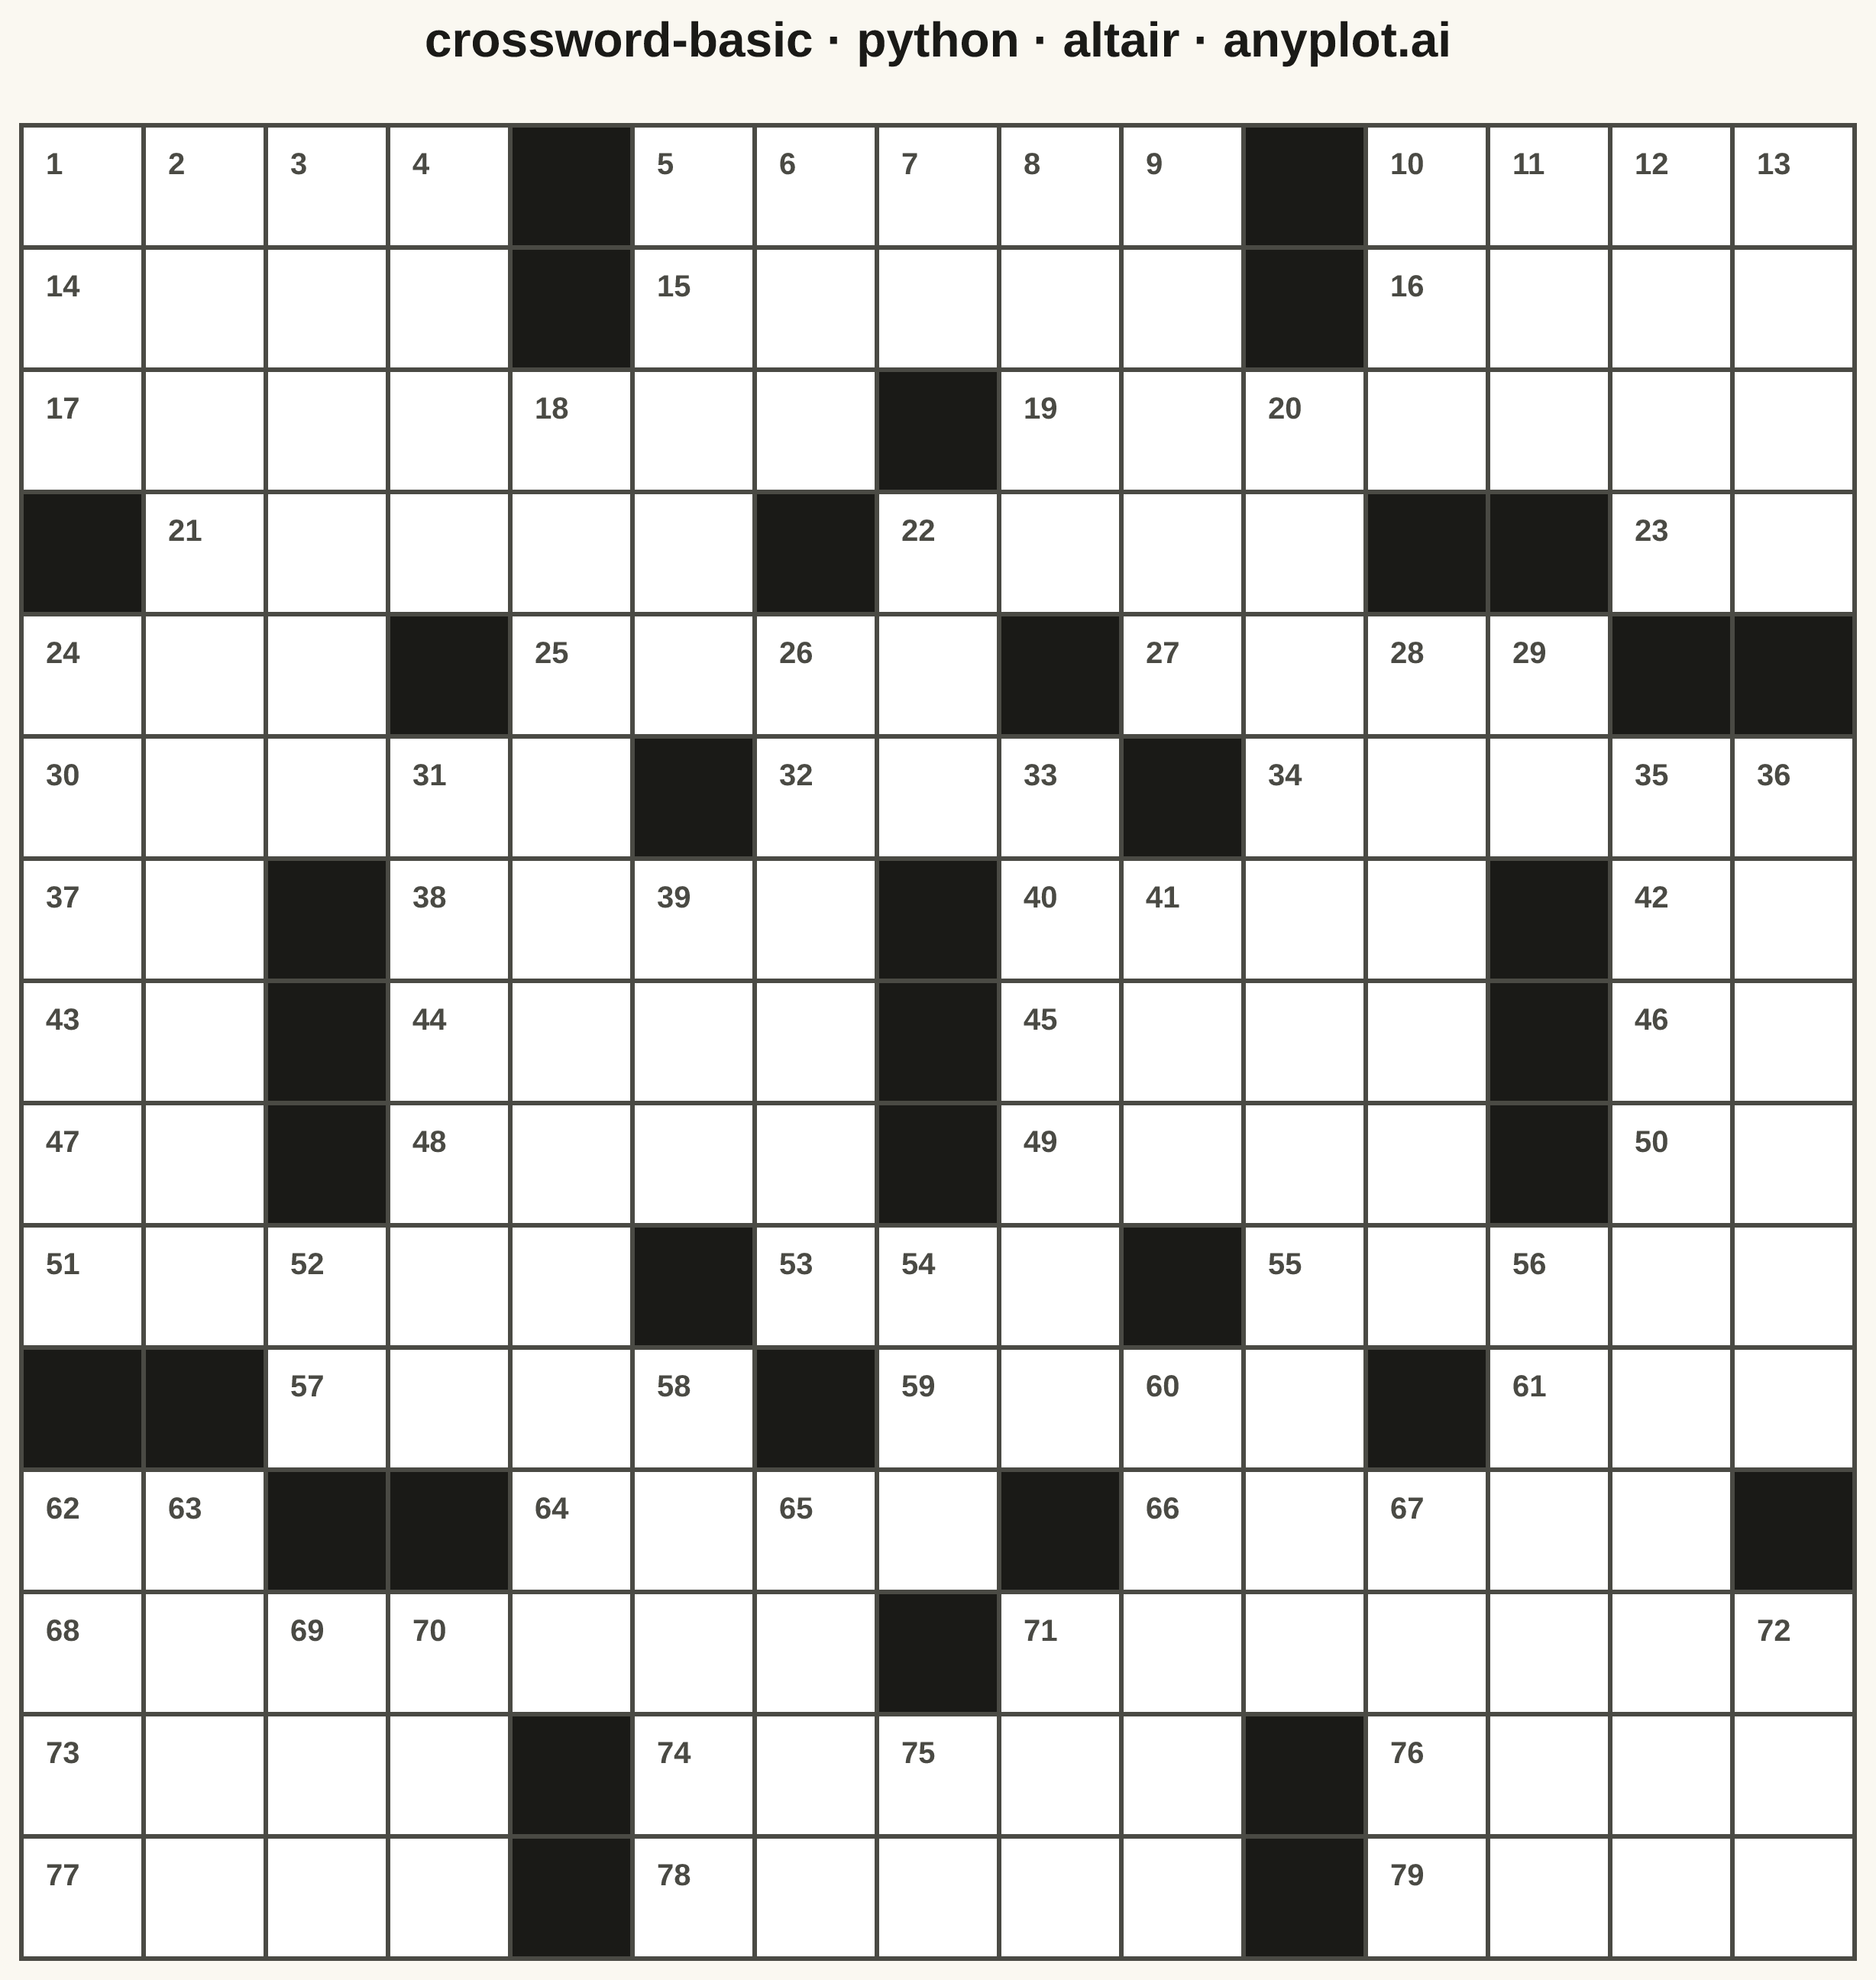
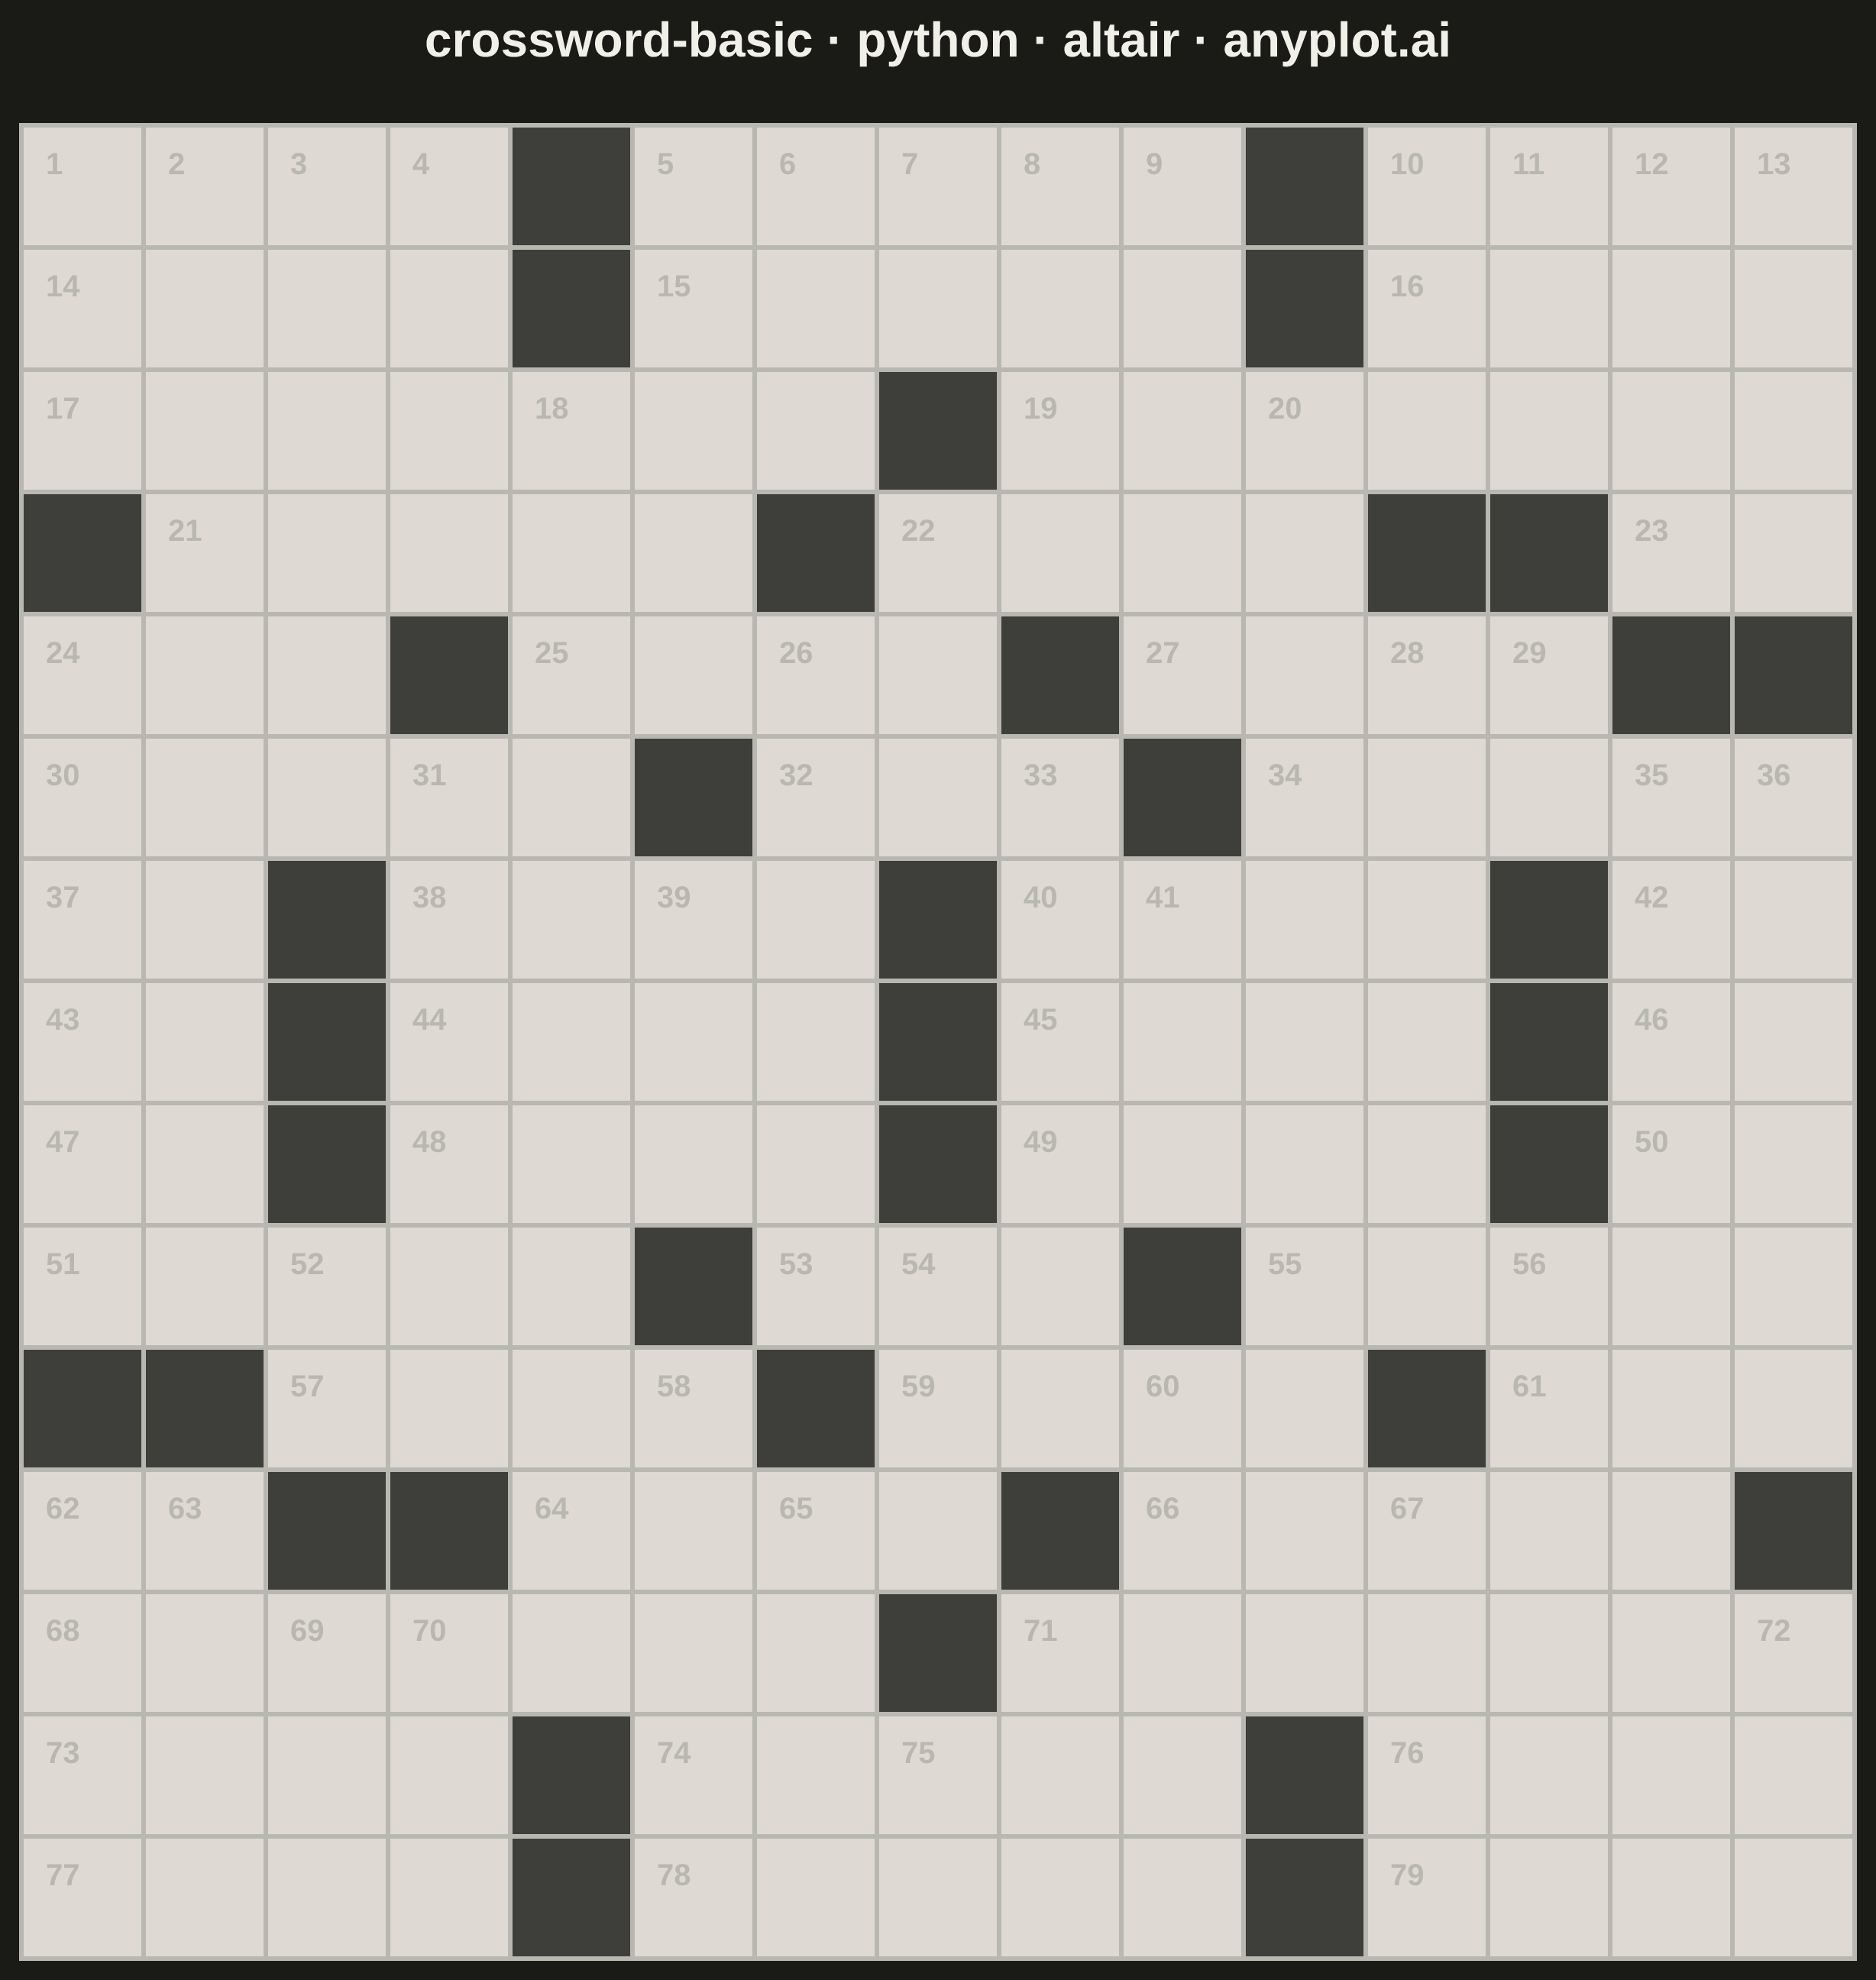
A crossword puzzle grid visualization with white entry cells for letters, black blocking cells, and numbered starting positions for across and down words. The symmetric black cell pattern follows traditional newspaper-style crossword conventions, creating a clean and recognizable puzzle layout suitable for printing or digital display.
""" anyplot.ai
crossword-basic: Crossword Puzzle Grid
Library: altair 6.1.0 | Python 3.13.13
Quality: 90/100 | Updated: 2026-05-20
"""

import os
import sys


# Prevent the script's own directory from shadowing the 'altair' package
sys.path = [p for p in sys.path if not p.endswith("/python")]

import altair as alt
import numpy as np
import pandas as pd


# Theme tokens
THEME = os.getenv("ANYPLOT_THEME", "light")
PAGE_BG = "#FAF8F1" if THEME == "light" else "#1A1A17"
INK = "#1A1A17" if THEME == "light" else "#F0EFE8"
INK_SOFT = "#4A4A44" if THEME == "light" else "#B8B7B0"

# Crossword cell colors (theme-adaptive monochrome design)
CELL_ENTRY = "#FFFFFF" if THEME == "light" else "#DEDAD3"
CELL_BLOCK = "#1A1A17" if THEME == "light" else "#3E3E3A"

# Data — 15x15 crossword grid with 180-degree rotational symmetry
np.random.seed(42)
grid_size = 15
grid = np.zeros((grid_size, grid_size), dtype=int)

black_positions = [
    (0, 4),
    (0, 10),
    (1, 4),
    (1, 10),
    (2, 7),
    (3, 0),
    (3, 6),
    (3, 11),
    (3, 12),
    (4, 3),
    (4, 8),
    (4, 13),
    (4, 14),
    (5, 5),
    (5, 9),
    (6, 2),
    (6, 7),
    (6, 12),
    (7, 2),
    (7, 7),
    (7, 12),
]

for r, c in black_positions:
    grid[r, c] = 1
    grid[grid_size - 1 - r, grid_size - 1 - c] = 1

# Determine numbered cells (start of across or down words)
numbers = {}
clue_num = 1

for r in range(grid_size):
    for c in range(grid_size):
        if grid[r, c] == 1:
            continue
        starts_across = (c == 0 or grid[r, c - 1] == 1) and (c < grid_size - 1 and grid[r, c + 1] == 0)
        starts_down = (r == 0 or grid[r - 1, c] == 1) and (r < grid_size - 1 and grid[r + 1, c] == 0)
        if starts_across or starts_down:
            numbers[(r, c)] = clue_num
            clue_num += 1

# Build dataframes
cells_data = [
    {"row": r, "col": c, "color": CELL_BLOCK if grid[r, c] == 1 else CELL_ENTRY}
    for r in range(grid_size)
    for c in range(grid_size)
]
cells_df = pd.DataFrame(cells_data)

numbers_df = pd.DataFrame([{"row": r, "col": c, "number": str(num)} for (r, c), num in numbers.items()])

# Grid cells layer
cells = (
    alt.Chart(cells_df)
    .mark_rect(stroke=INK_SOFT, strokeWidth=1.5)
    .encode(x=alt.X("col:O", axis=None), y=alt.Y("row:O", axis=None), color=alt.Color("color:N", scale=None))
)

# Clue numbers overlay
clue_numbers = (
    alt.Chart(numbers_df)
    .mark_text(align="left", baseline="top", dx=-12, dy=-12, fontSize=10, fontWeight="bold", color=INK_SOFT)
    .encode(x=alt.X("col:O", axis=None), y=alt.Y("row:O", axis=None), text="number:N")
)

# Compose chart — square 600×600 canvas → 2400×2400 px at scale=4
chart = (
    (cells + clue_numbers)
    .properties(
        width=600,
        height=600,
        background=PAGE_BG,
        title=alt.Title(
            "crossword-basic · python · altair · anyplot.ai", fontSize=16, anchor="middle", offset=18, color=INK
        ),
    )
    .configure_view(fill=PAGE_BG, strokeWidth=0)
)

# Save outputs
chart.save(f"plot-{THEME}.png", scale_factor=4.0)
chart.save(f"plot-{THEME}.html")
Runnable source as JSON, for any HTTP client: https://api.anyplot.ai/specs/crossword-basic/altair/code. Any spec id and library id listed in llms-full.txt fit the same URL shape; every URL below is complete and callable.
{
  "spec_id": "crossword-basic",
  "language": "python",
  "library": "altair",
  "page": "https://anyplot.ai/crossword-basic/python/altair",
  "hub": "https://anyplot.ai/crossword-basic",
  "code_json": "https://api.anyplot.ai/specs/crossword-basic/altair/code",
  "spec_json": "https://api.anyplot.ai/specs/crossword-basic",
  "render_light_png": "https://storage.googleapis.com/anyplot-images/plots/crossword-basic/python/altair/plot-light.png",
  "render_dark_png": "https://storage.googleapis.com/anyplot-images/plots/crossword-basic/python/altair/plot-dark.png",
  "interactive_light_html": "https://storage.googleapis.com/anyplot-images/plots/crossword-basic/python/altair/plot-light.html",
  "interactive_dark_html": "https://storage.googleapis.com/anyplot-images/plots/crossword-basic/python/altair/plot-dark.html",
  "quality_score": 90.0,
  "license": "MIT",
  "guide": "https://anyplot.ai/llms.txt"
}
Part of Crossword Puzzle Grid on anyplot.ai.