The same plot in 14 other libraries — JavaScript: D3.js, Apache ECharts, Highcharts, MUI X Charts; Python: Altair, Bokeh, lets-plot, Matplotlib, Plotly, plotnine, Pygal, Seaborn; R: ggplot2; Julia: Makie.jl. Compare all 15 side by side: Crossword Puzzle Grid in Python, R, Julia and JavaScript.
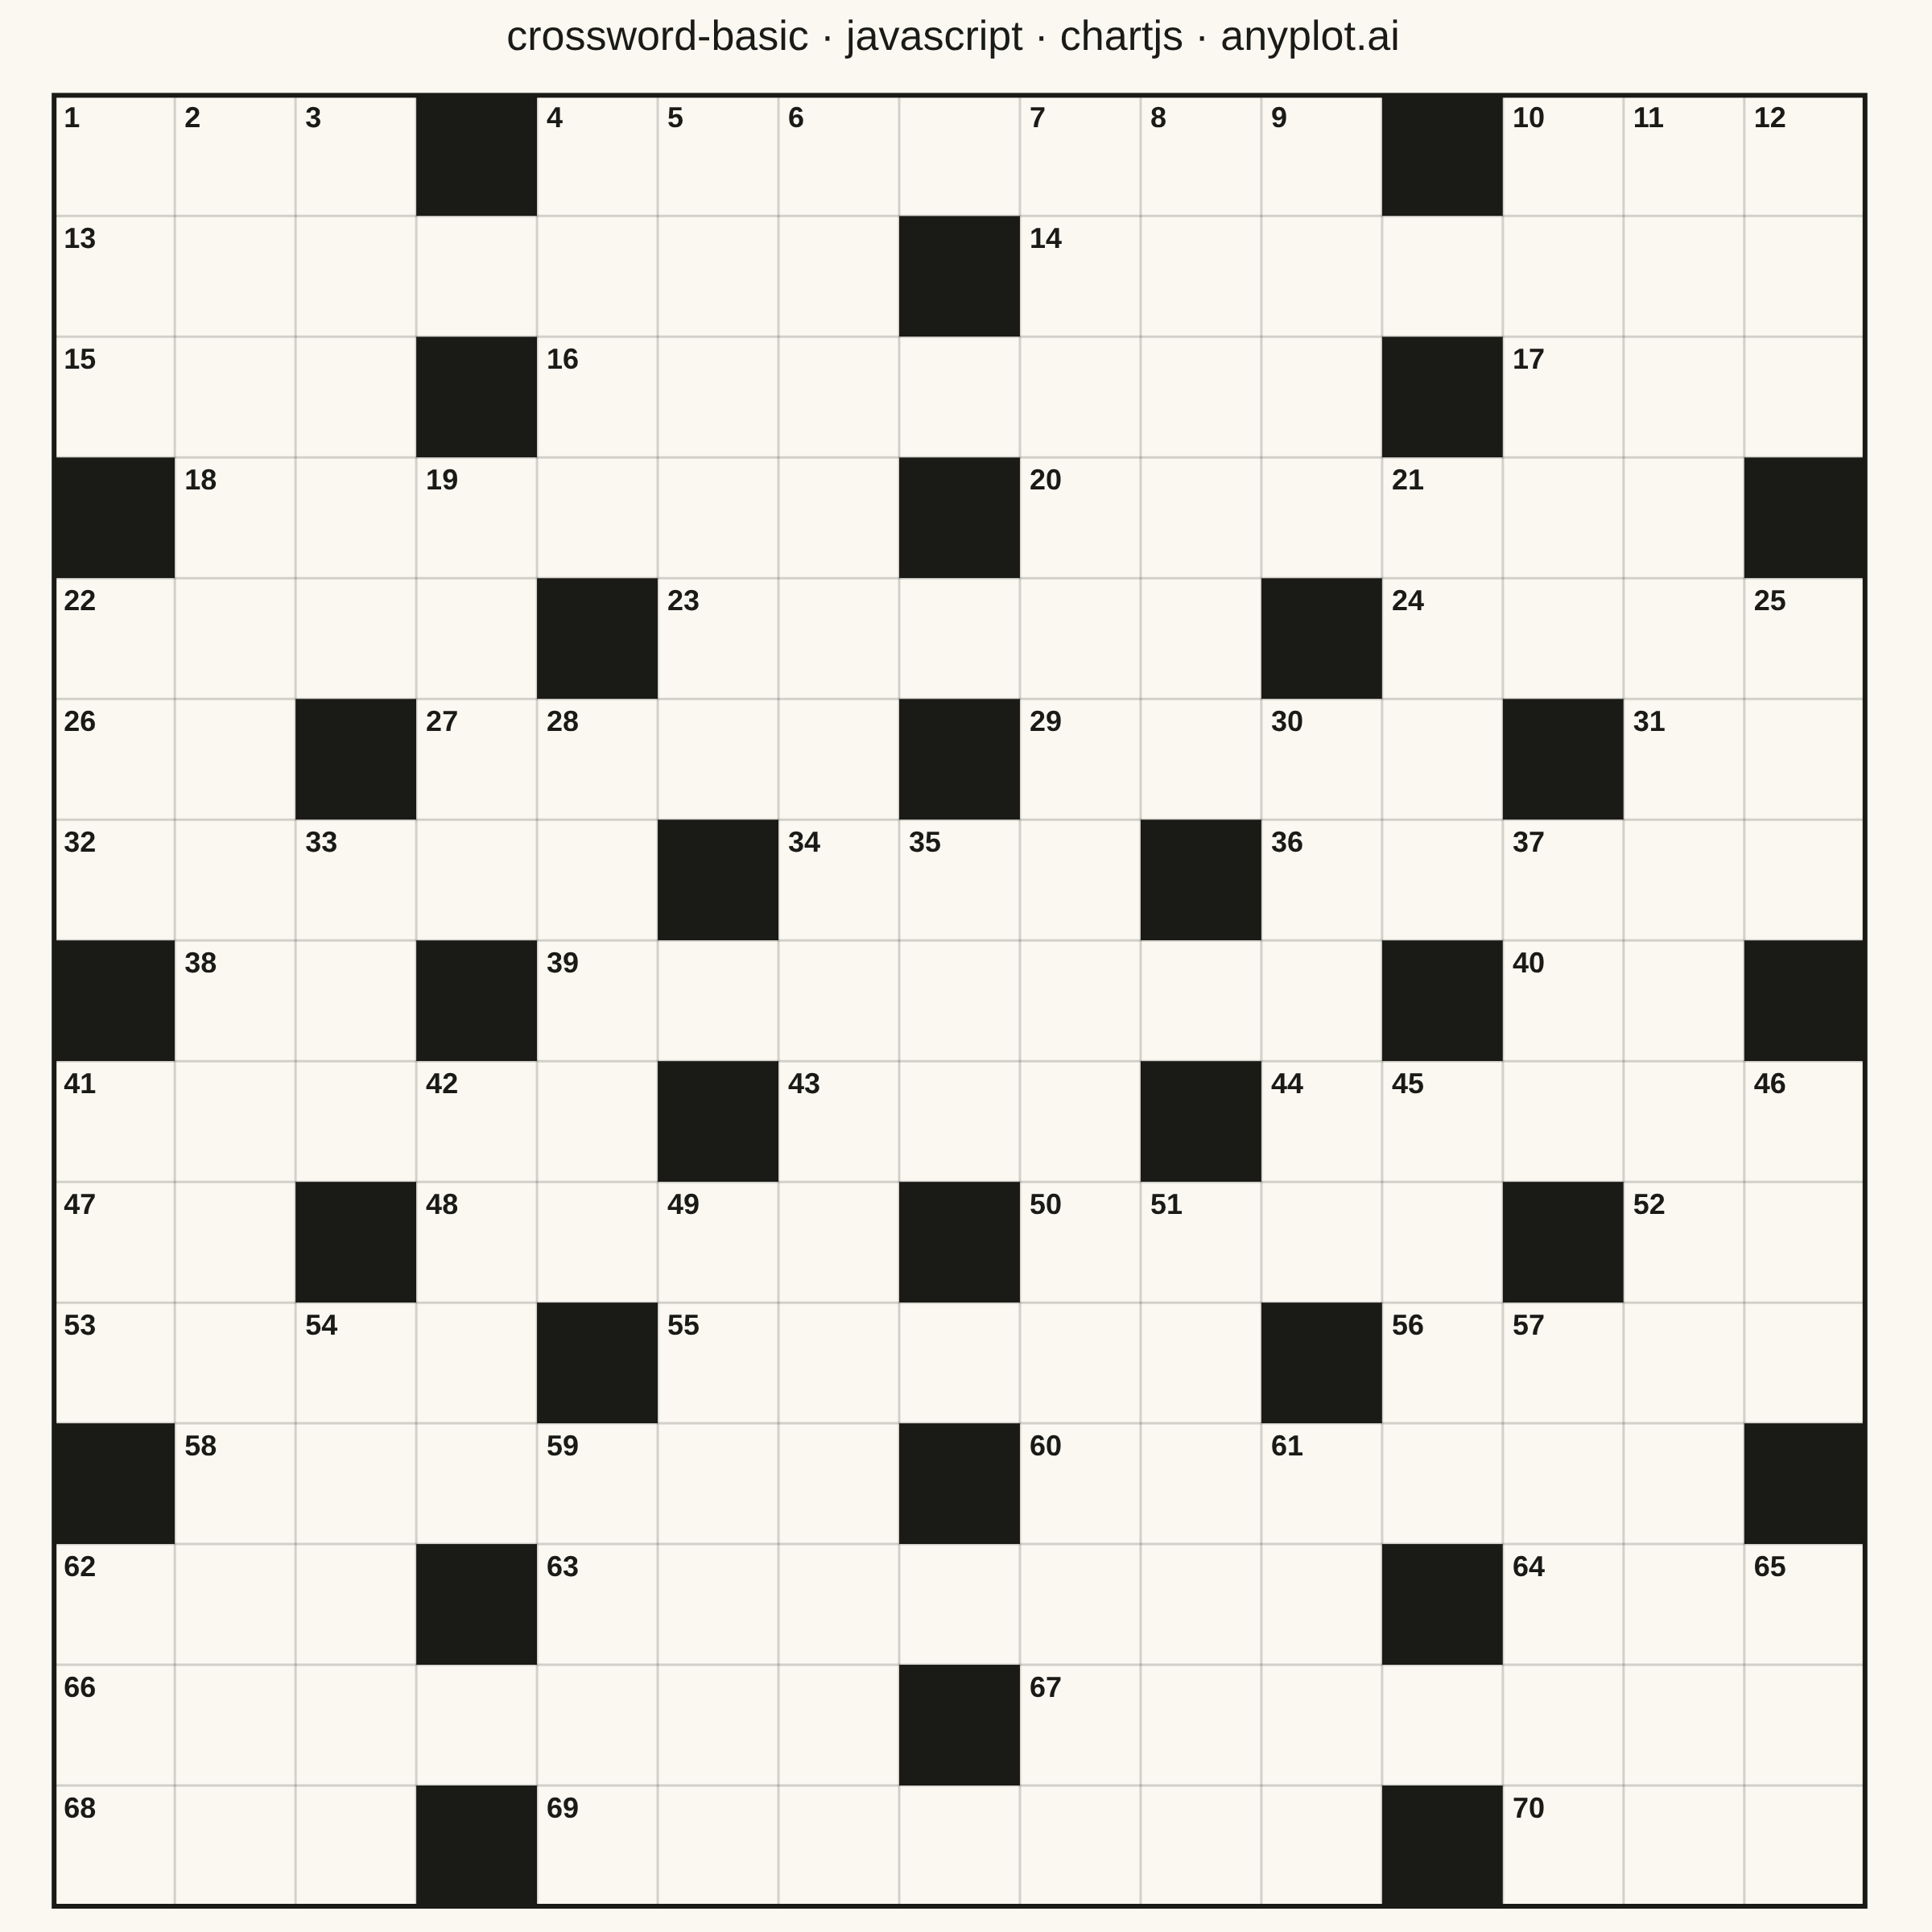
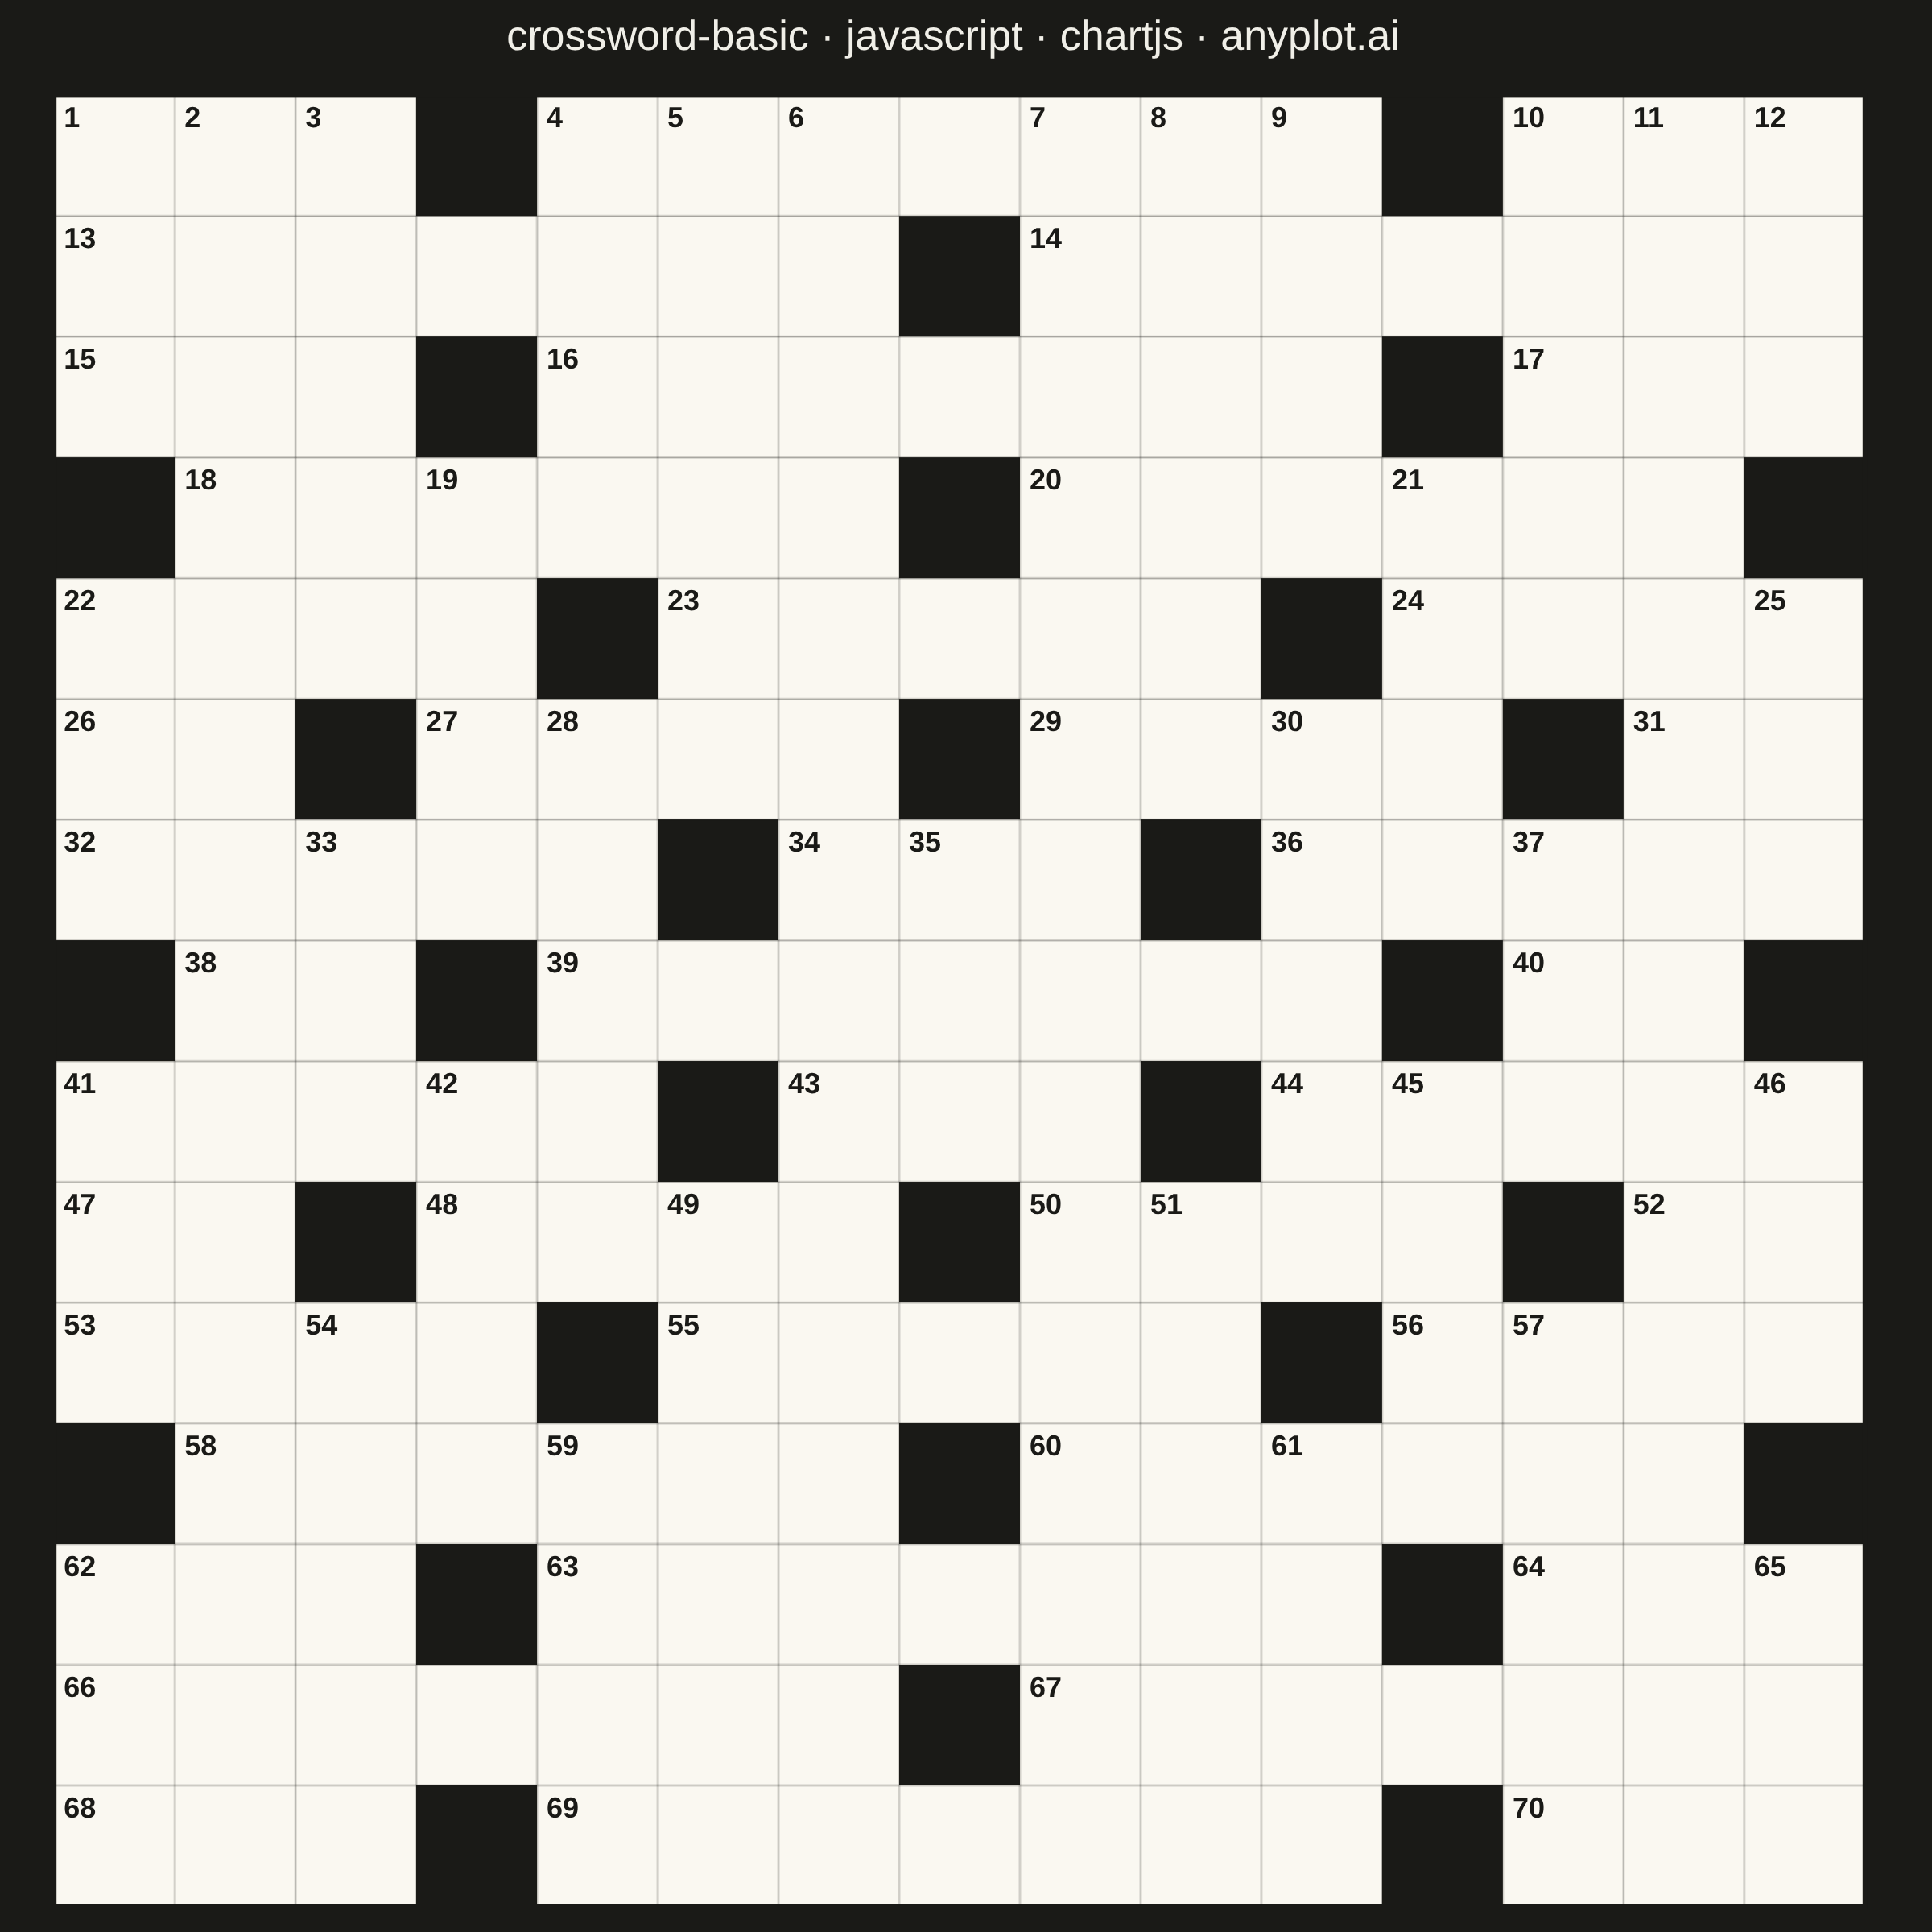
A crossword puzzle grid visualization with white entry cells for letters, black blocking cells, and numbered starting positions for across and down words. The symmetric black cell pattern follows traditional newspaper-style crossword conventions, creating a clean and recognizable puzzle layout suitable for printing or digital display.
// anyplot.ai
// crossword-basic: Crossword Puzzle Grid
// Library: chartjs 4.4.7 | JavaScript 22.23.2
// Quality: 89/100 | Created: 2026-09-02

//# anyplot-orientation: square
const t = window.ANYPLOT_TOKENS;

// --- Data (in-memory, deterministic) ----------------------------------------
// Standard 15x15 grid with 180-degree rotational symmetry: only the "primary"
// half is listed below, and each entry's rotational partner
// (SIZE-1-row, SIZE-1-col) is added automatically. Row 0 is the top row.
const SIZE = 15;
const PRIMARY_BLOCKS = [
  [0, 3], [0, 11],
  [1, 7],
  [2, 3], [2, 11],
  [3, 0], [3, 7], [3, 14],
  [4, 4], [4, 10],
  [5, 2], [5, 7], [5, 12],
  [6, 5], [6, 9],
  [7, 0], [7, 3], [7, 11], [7, 14],
];
const blocked = new Set();
PRIMARY_BLOCKS.forEach(([r, c]) => {
  blocked.add(`${r},${c}`);
  blocked.add(`${SIZE - 1 - r},${SIZE - 1 - c}`);
});
const isBlocked = (r, c) => blocked.has(`${r},${c}`);

// Standard numbering: a cell gets a number if it starts an across entry
// (leftmost column or left neighbor blocked, plus a run of 2+ cells) or a
// down entry (topmost row or top neighbor blocked, plus a run of 2+ cells).
const numbering = new Map();
let clueCount = 1;
for (let r = 0; r < SIZE; r++) {
  for (let c = 0; c < SIZE; c++) {
    if (isBlocked(r, c)) continue;
    const startsAcross = (c === 0 || isBlocked(r, c - 1)) && c < SIZE - 1 && !isBlocked(r, c + 1);
    const startsDown = (r === 0 || isBlocked(r - 1, c)) && r < SIZE - 1 && !isBlocked(r + 1, c);
    if (startsAcross || startsDown) {
      numbering.set(`${r},${c}`, clueCount);
      clueCount += 1;
    }
  }
}

const cells = [];
for (let r = 0; r < SIZE; r++) {
  for (let c = 0; c < SIZE; c++) {
    cells.push({
      x: c,
      y: SIZE - 1 - r, // row 0 at the top of the chart
      row: r,
      col: c,
      isBlocked: isBlocked(r, c),
      number: numbering.get(`${r},${c}`) ?? null,
    });
  }
}
const numberedCells = cells.filter((cell) => cell.number !== null);

// Monochrome design (spec: "optimized for printing") — the board itself
// renders as printed paper, so cell fills and grid lines stay fixed
// regardless of viewer theme (a physical newspaper page doesn't invert for
// dark mode). Only the title/chrome (below) adapts to theme. Values reuse
// the canonical light-theme page-bg / ink tokens rather than inventing new
// hexes.
const PAPER_ENTRY = "#FAF8F1";
const PAPER_BLOCK = "#1A1A17";
const PAPER_GRID = "rgba(26, 26, 23, 0.18)";

// --- Square-aspect layout + grid-drawing plugin -----------------------------
// The title block eats vertical space the axis area doesn't eat horizontally,
// so the raw chart area isn't square. Shrink it to the largest centered
// square before the scatter points are laid out, then draw uniform grid
// lines between every cell, the clue numbers, and a crisp outer frame.
const crosswordGrid = {
  id: "crosswordGrid",
  afterLayout(chart) {
    const { x, y } = chart.scales;
    if (!x || !y) return;
    const width = x.right - x.left;
    const height = y.bottom - y.top;
    const side = Math.min(width, height);
    x.left += (width - side) / 2;
    x.right = x.left + side;
    y.top += (height - side) / 2;
    y.bottom = y.top + side;
    chart.chartArea.left = x.left;
    chart.chartArea.right = x.right;
    chart.chartArea.top = y.top;
    chart.chartArea.bottom = y.bottom;
    // LinearScale caches _startPixel/_length in configure() during layout —
    // it must re-run for the shrunk box to affect pixel conversion.
    x.configure();
    y.configure();
  },
  afterDatasetsDraw(chart) {
    const { ctx, chartArea: area, scales } = chart;
    const { x, y } = scales;
    if (!x || !y) return;

    // Cell fills — drawn here directly (not left to Chart.js's own point
    // renderer) so every element in this plugin — fills, grid lines, and
    // numbers — shares one pixel mapping computed in the same pass. Letting
    // Chart.js draw the points separately risked them reading a stale scale
    // state from before the afterLayout square-crop above, which desynced
    // the fills from the grid lines drawn here.
    ctx.save();
    cells.forEach((cell) => {
      const left = x.getPixelForValue(cell.x - 0.5);
      const right = x.getPixelForValue(cell.x + 0.5);
      const top = y.getPixelForValue(cell.y + 0.5);
      const bottom = y.getPixelForValue(cell.y - 0.5);
      ctx.fillStyle = cell.isBlocked ? PAPER_BLOCK : PAPER_ENTRY;
      ctx.fillRect(left, top, right - left, bottom - top);
    });
    ctx.restore();

    // Uniform grid lines separating every cell (spec: "Clean, uniform grid
    // lines separating all cells").
    ctx.save();
    ctx.strokeStyle = PAPER_GRID;
    ctx.lineWidth = 1.5;
    for (let i = 0; i <= SIZE; i++) {
      const gx = x.getPixelForValue(i - 0.5);
      ctx.beginPath();
      ctx.moveTo(gx, area.top);
      ctx.lineTo(gx, area.bottom);
      ctx.stroke();

      const gy = y.getPixelForValue(i - 0.5);
      ctx.beginPath();
      ctx.moveTo(area.left, gy);
      ctx.lineTo(area.right, gy);
      ctx.stroke();
    }
    ctx.restore();

    // Clue numbers, top-left corner of each starting cell.
    const cellSize = x.getPixelForValue(0.5) - x.getPixelForValue(-0.5);
    ctx.save();
    ctx.fillStyle = PAPER_BLOCK;
    ctx.font = `600 ${Math.round(cellSize * 0.24)}px sans-serif`;
    ctx.textAlign = "left";
    ctx.textBaseline = "top";
    const pad = cellSize * 0.08;
    numberedCells.forEach(({ x: col, y: dataY, number }) => {
      const cellLeft = x.getPixelForValue(col - 0.5);
      const cellTop = y.getPixelForValue(dataY + 0.5);
      ctx.fillText(String(number), cellLeft + pad, cellTop + pad);
    });
    ctx.restore();

    // Outer frame so the board reads as one solid block.
    ctx.save();
    ctx.strokeStyle = PAPER_BLOCK;
    ctx.lineWidth = 3;
    ctx.strokeRect(area.left, area.top, area.right - area.left, area.bottom - area.top);
    ctx.restore();
  },
};

// --- Mount -------------------------------------------------------------------
const canvas = document.createElement("canvas");
document.getElementById("container").appendChild(canvas);

// --- Chart -------------------------------------------------------------------
new Chart(canvas, {
  type: "scatter",
  plugins: [crosswordGrid],
  data: {
    datasets: [
      {
        data: cells,
        showLine: false,
        pointStyle: "rect",
        // Invisible — the crosswordGrid plugin draws the actual cell fills
        // (see afterDatasetsDraw) so fills and grid lines share one pixel
        // mapping. These points exist only to give the tooltip a hit target.
        backgroundColor: "transparent",
        pointBorderWidth: 0,
        pointRadius: (ctx) => {
          const { x, y } = ctx.chart.scales;
          if (!x || !y) return 8;
          const pxPerCol = Math.abs(x.getPixelForValue(1) - x.getPixelForValue(0));
          const pxPerRow = Math.abs(y.getPixelForValue(1) - y.getPixelForValue(0));
          return Math.min(pxPerCol, pxPerRow) / 2;
        },
        pointHoverBackgroundColor: "transparent",
        pointHoverBorderColor: t.palette[0],
        pointHoverBorderWidth: 2,
      },
    ],
  },
  options: {
    responsive: true,
    maintainAspectRatio: false,
    animation: false,
    layout: { padding: { top: 8, right: 24, bottom: 8, left: 8 } },
    plugins: {
      title: {
        display: true,
        text: "crossword-basic · javascript · chartjs · anyplot.ai",
        color: t.ink,
        font: { size: 26, weight: "500" },
        padding: { bottom: 20 },
      },
      legend: { display: false },
      tooltip: {
        callbacks: {
          title: (items) => `Row ${items[0].raw.row + 1}, Col ${items[0].raw.col + 1}`,
          label: (item) => {
            if (item.raw.isBlocked) return "Blocked cell";
            return item.raw.number ? `Entry cell · clue ${item.raw.number}` : "Entry cell";
          },
        },
      },
    },
    scales: {
      x: {
        type: "linear",
        min: -0.5,
        max: SIZE - 0.5,
        ticks: { display: false },
        grid: { display: false },
        border: { display: false },
      },
      y: {
        type: "linear",
        min: -0.5,
        max: SIZE - 0.5,
        ticks: { display: false },
        grid: { display: false },
        border: { display: false },
      },
    },
  },
});
Runnable source as JSON, for any HTTP client: https://api.anyplot.ai/specs/crossword-basic/chartjs/code. Any spec id and library id listed in llms-full.txt fit the same URL shape; every URL below is complete and callable.
{
  "spec_id": "crossword-basic",
  "language": "javascript",
  "library": "chartjs",
  "page": "https://anyplot.ai/crossword-basic/javascript/chartjs",
  "hub": "https://anyplot.ai/crossword-basic",
  "code_json": "https://api.anyplot.ai/specs/crossword-basic/chartjs/code",
  "spec_json": "https://api.anyplot.ai/specs/crossword-basic",
  "render_light_png": "https://storage.googleapis.com/anyplot-images/plots/crossword-basic/javascript/chartjs/plot-light.png",
  "render_dark_png": "https://storage.googleapis.com/anyplot-images/plots/crossword-basic/javascript/chartjs/plot-dark.png",
  "interactive_light_html": "https://storage.googleapis.com/anyplot-images/plots/crossword-basic/javascript/chartjs/plot-light.html",
  "interactive_dark_html": "https://storage.googleapis.com/anyplot-images/plots/crossword-basic/javascript/chartjs/plot-dark.html",
  "quality_score": 89.0,
  "license": "MIT",
  "guide": "https://anyplot.ai/llms.txt"
}
Part of Crossword Puzzle Grid on anyplot.ai.