The same plot in 14 other libraries — JavaScript: D3.js, Apache ECharts, Highcharts, MUI X Charts; Python: Altair, Bokeh, lets-plot, Matplotlib, Plotly, plotnine, Pygal, Seaborn; R: ggplot2; Julia: Makie.jl. Compare all 15 side by side: Elbow Curve for K-Means Clustering in Python, R, Julia and JavaScript.
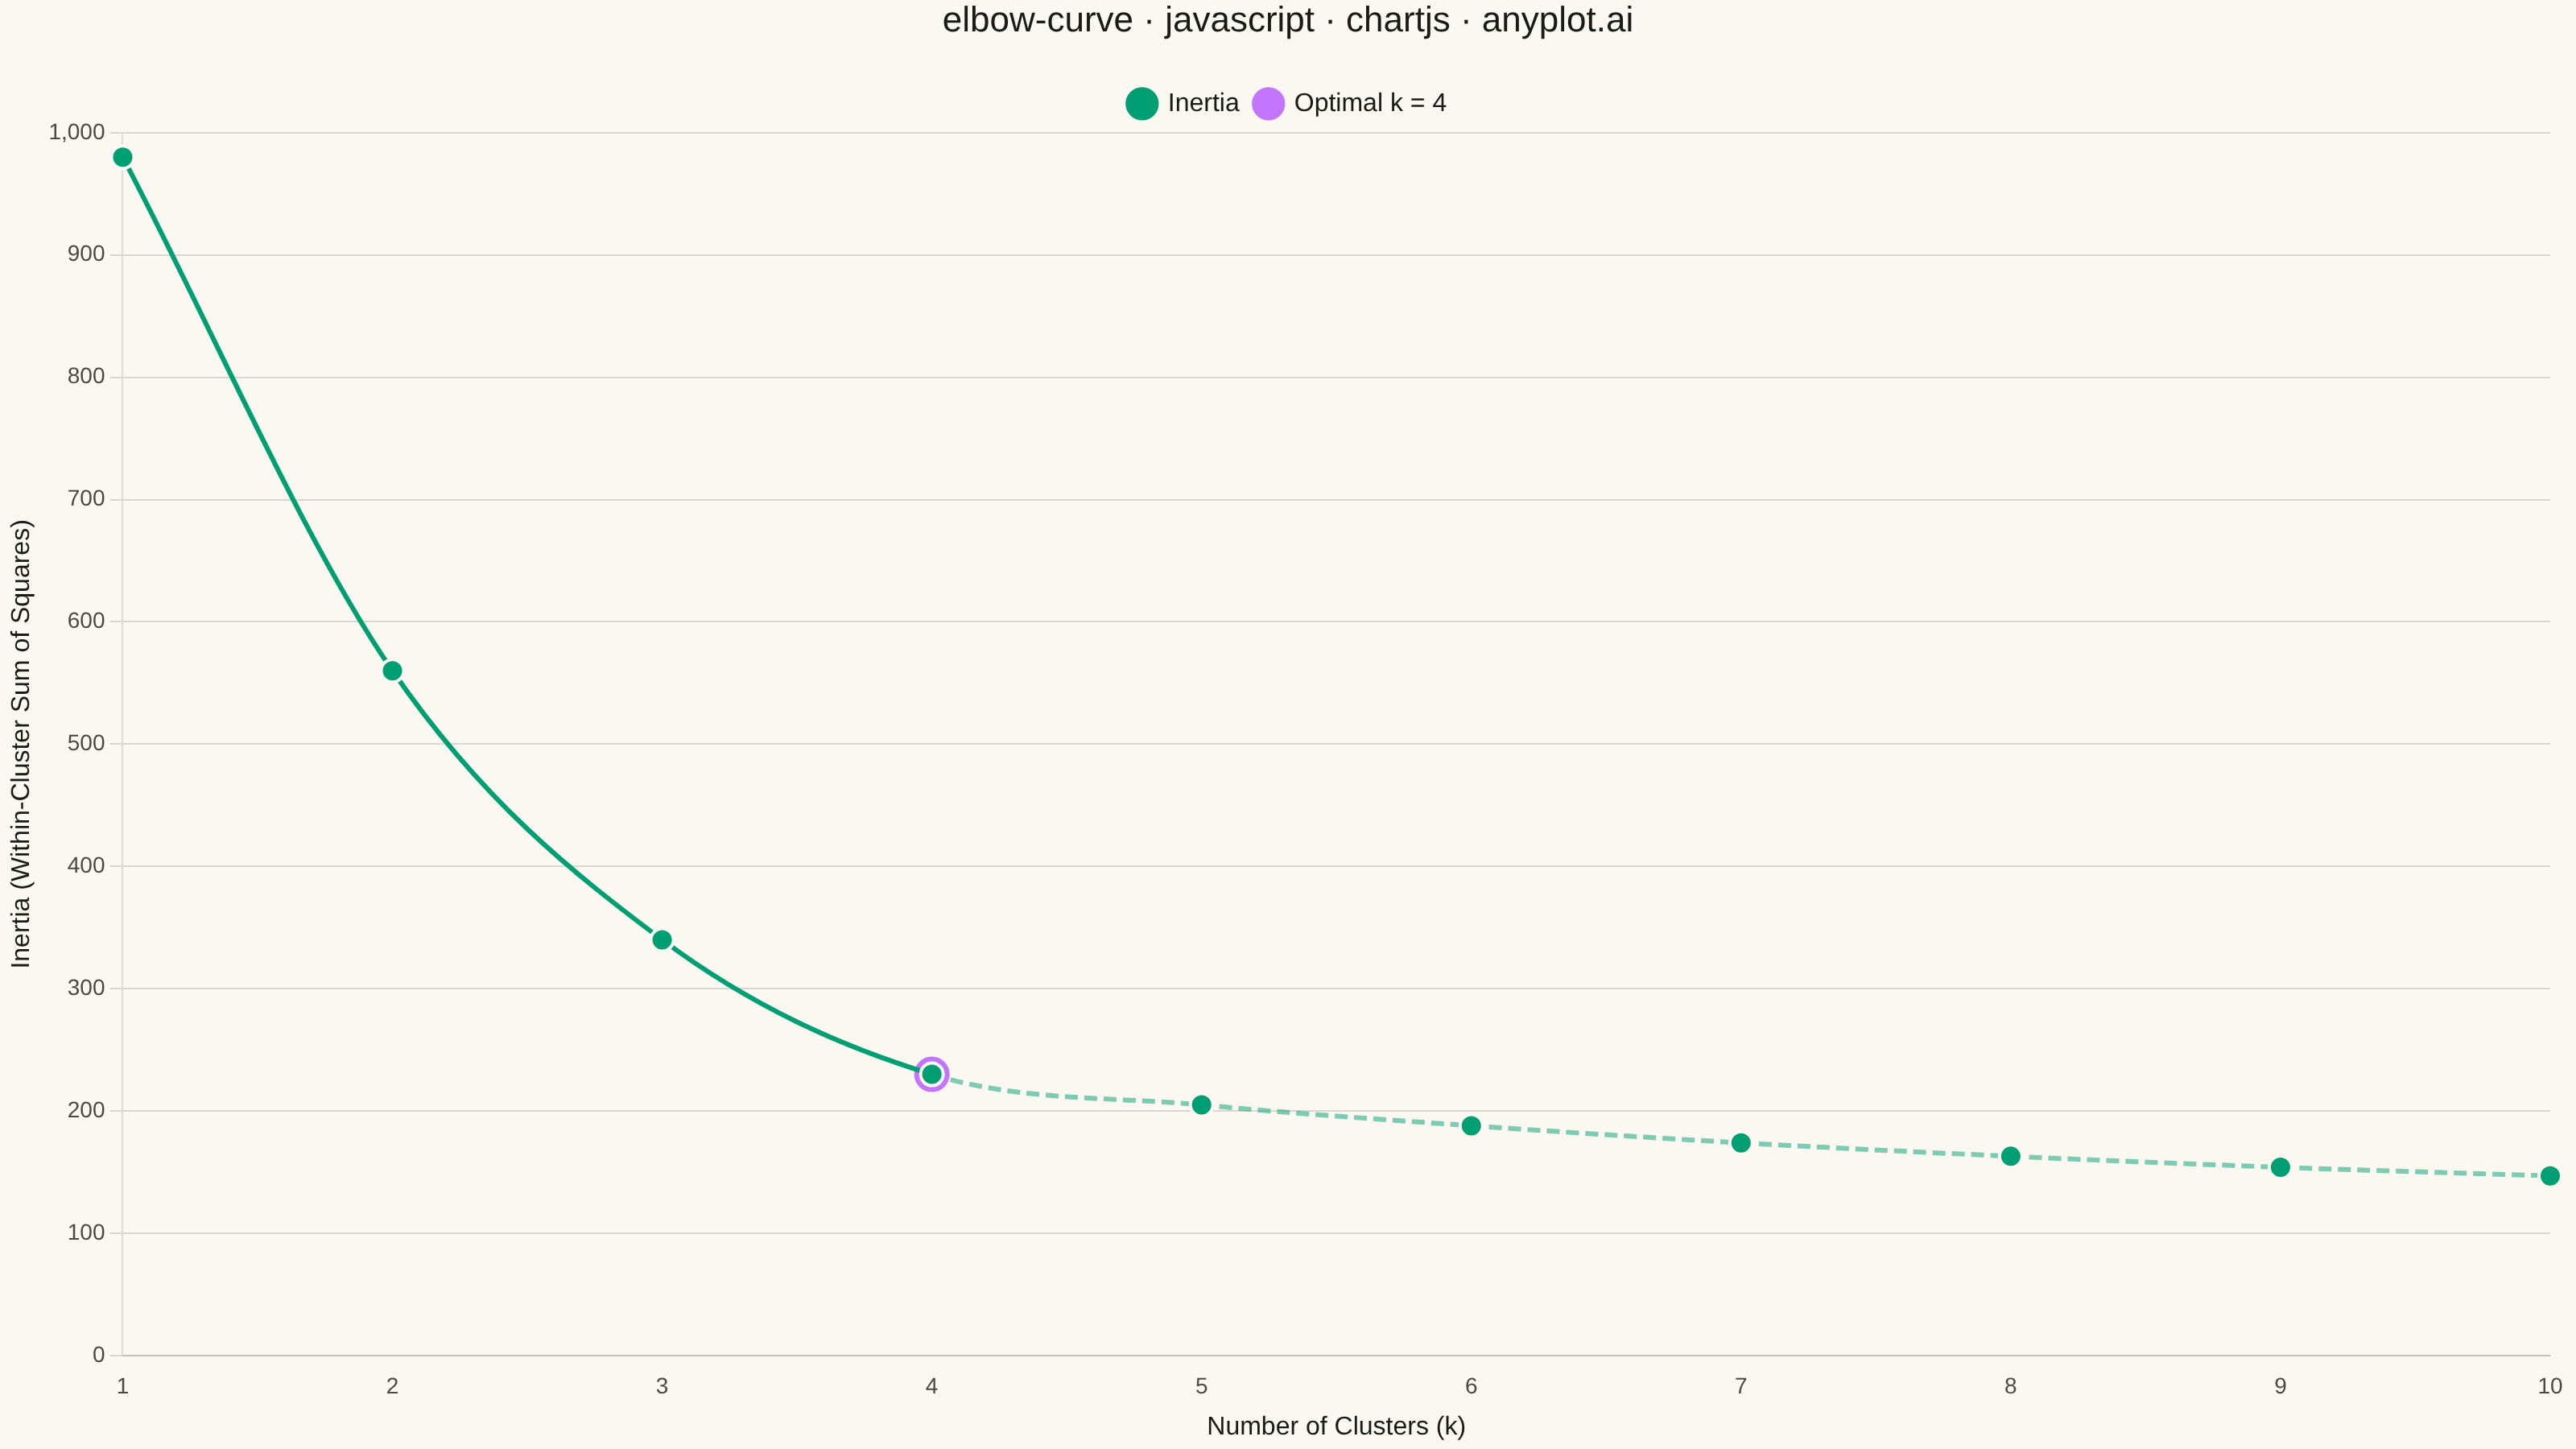
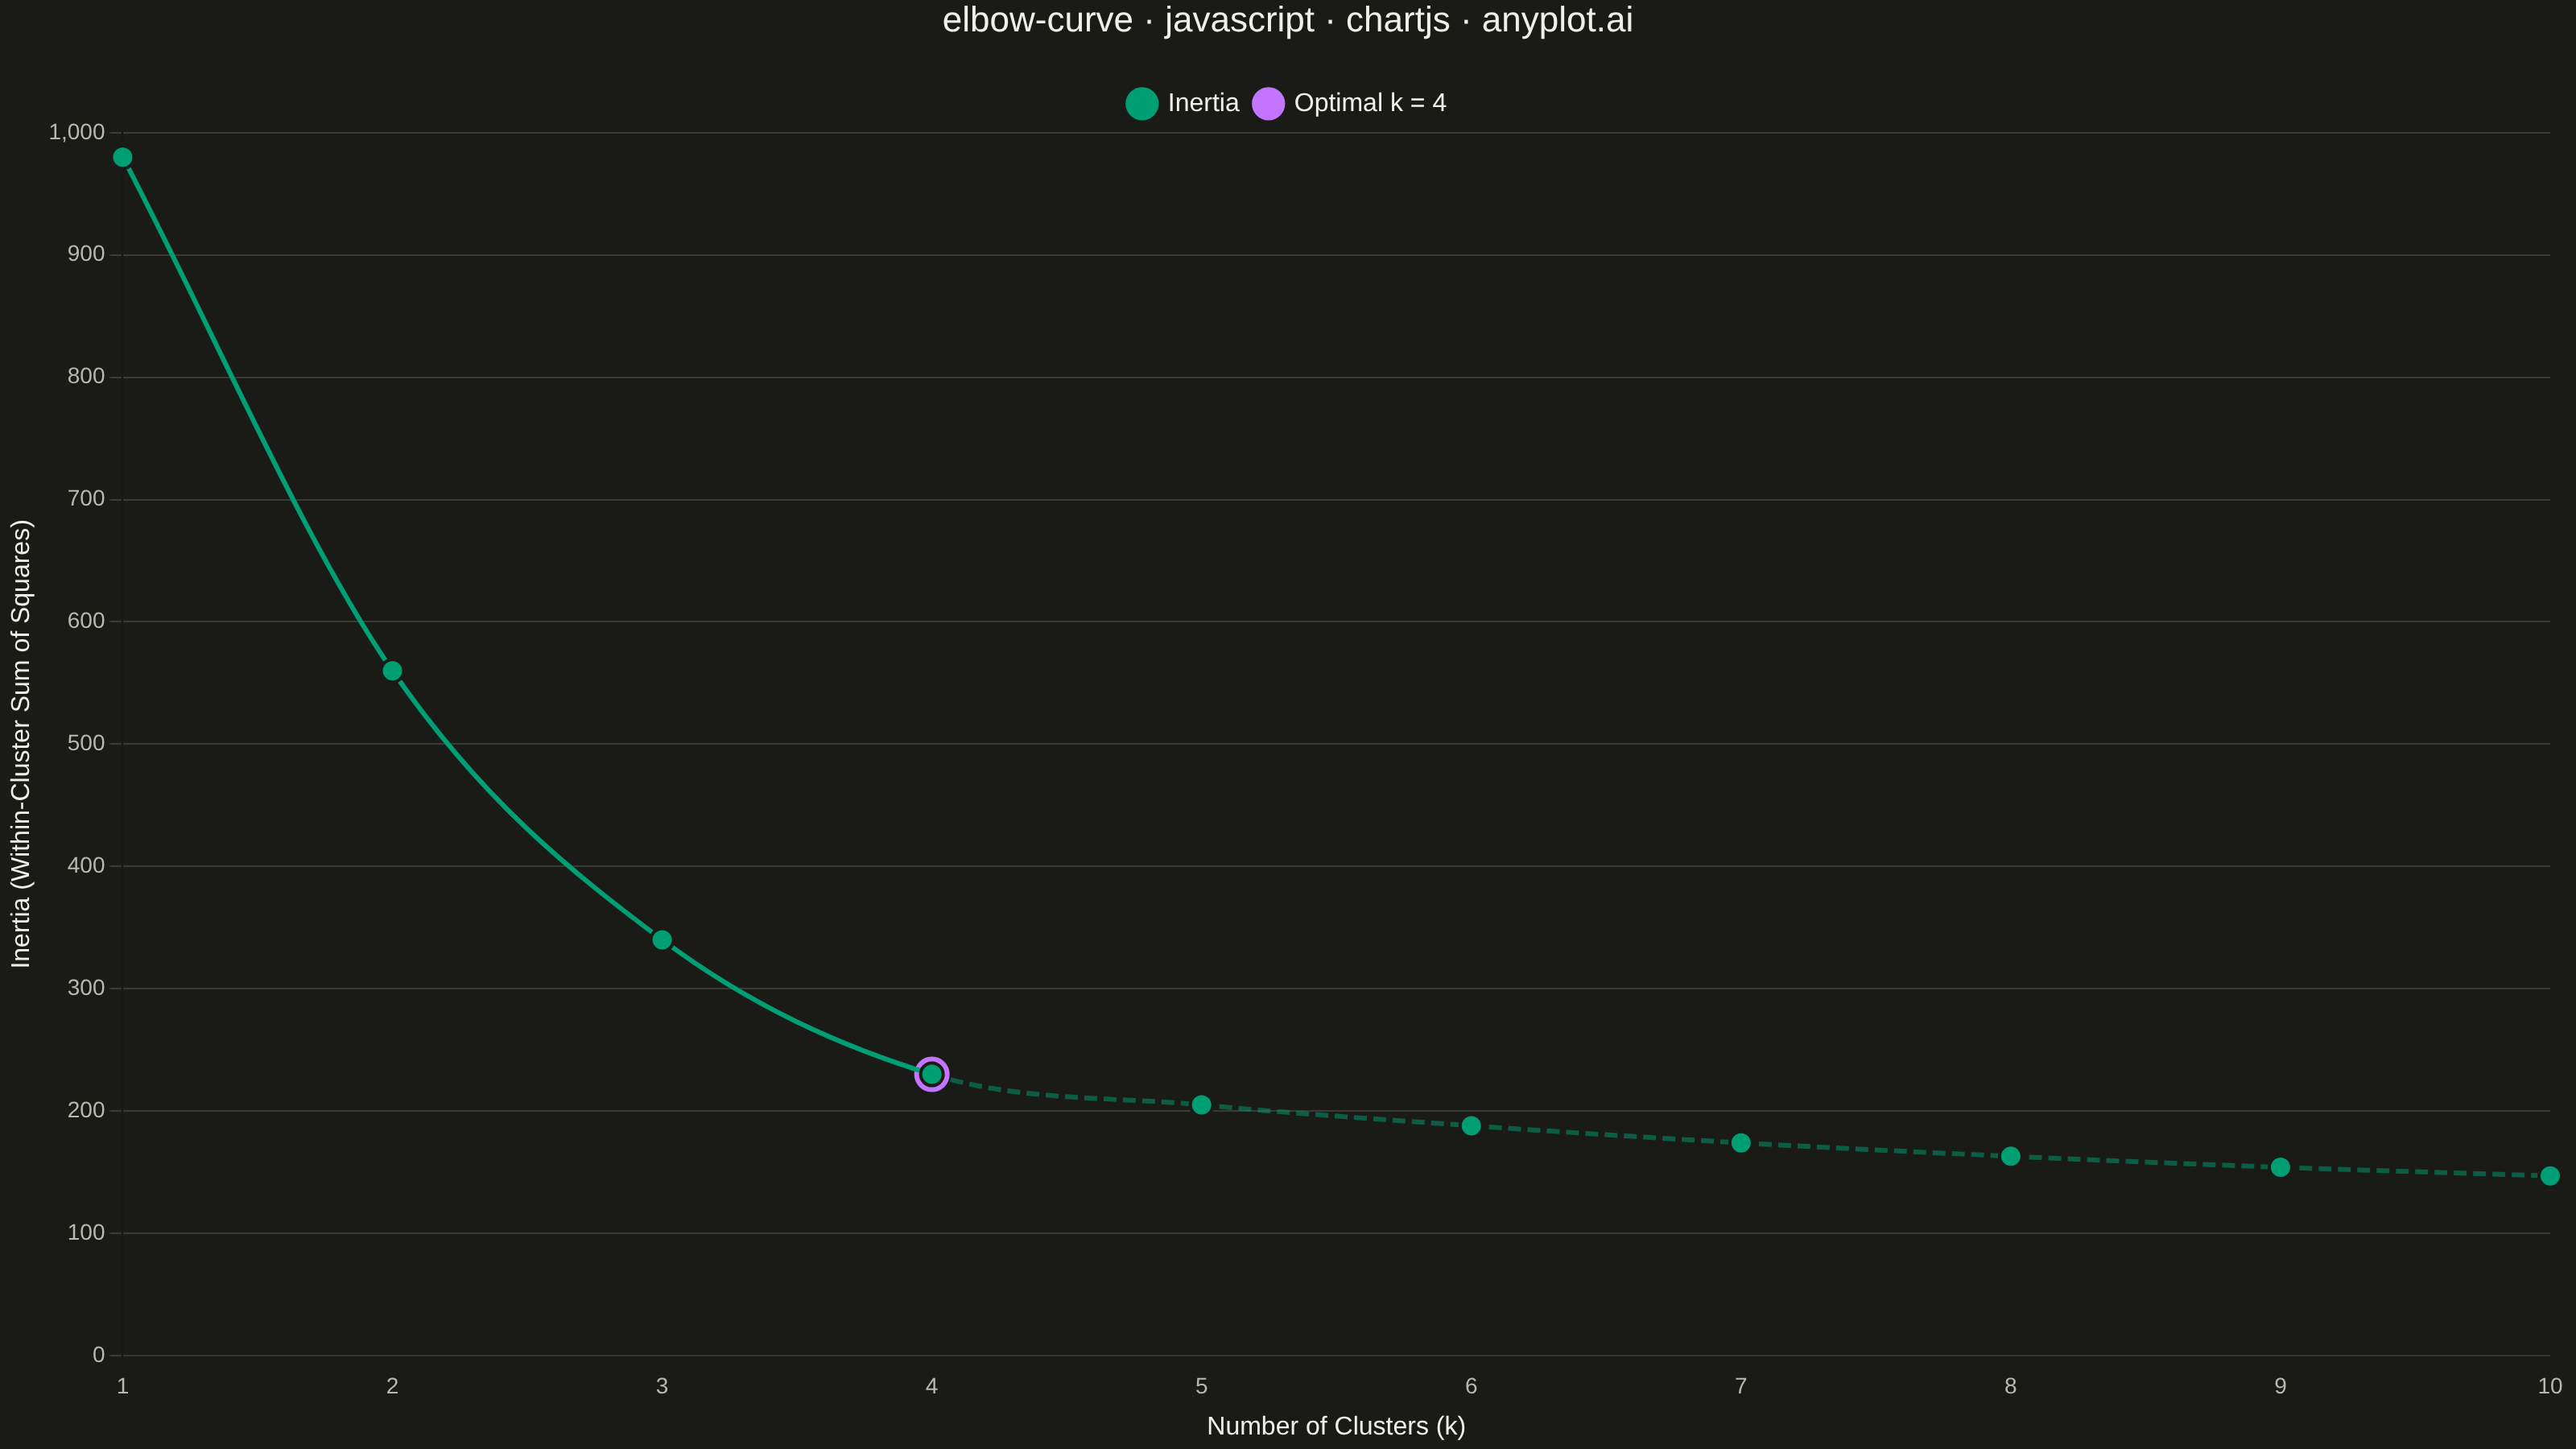
An elbow curve visualizes the relationship between the number of clusters (k) and within-cluster sum of squares (inertia/distortion) in K-means clustering. The plot helps identify the optimal number of clusters by finding the "elbow point" where adding more clusters yields diminishing returns in reducing inertia. This is a fundamental diagnostic tool for unsupervised learning parameter selection.
// anyplot.ai
// elbow-curve: Elbow Curve for K-Means Clustering
// Library: chartjs 4.4.7 | JavaScript 22.23.2
// Quality: 93/100 | Created: 2026-09-05

const t = window.ANYPLOT_TOKENS;

// --- Data (in-memory, deterministic) ----------------------------------------
// Customer segmentation: K-means inertia across k=1..10 on behavioral features
// (purchase frequency, average order value, recency).
const kValues = [1, 2, 3, 4, 5, 6, 7, 8, 9, 10];
const inertia = [980, 560, 340, 230, 205, 188, 174, 163, 154, 147];
const optimalK = 4;

// --- Mount -------------------------------------------------------------------
const canvas = document.createElement("canvas");
document.getElementById("container").appendChild(canvas);

// --- Chart -------------------------------------------------------------------
new Chart(canvas, {
  type: "line",
  data: {
    labels: kValues,
    datasets: [
      {
        label: "Inertia",
        data: inertia,
        borderColor: t.palette[0],
        backgroundColor: t.palette[0],
        pointBackgroundColor: t.palette[0],
        pointBorderColor: t.pageBg,
        pointBorderWidth: 2,
        pointRadius: 7,
        pointHoverRadius: 9,
        borderWidth: 3,
        cubicInterpolationMode: "monotone",
        tension: 0.3,
        fill: false,
        segment: {
          // De-emphasize the post-elbow segments (dashed + muted) to visually
          // reinforce the "diminishing returns" story beyond the highlighted marker.
          borderDash: (ctx) => (ctx.p0DataIndex >= optimalK - 1 ? [8, 4] : undefined),
          borderColor: (ctx) => (ctx.p0DataIndex >= optimalK - 1 ? `${t.palette[0]}80` : t.palette[0]),
        },
      },
      {
        label: `Optimal k = ${optimalK}`,
        data: kValues.map((k) => (k === optimalK ? inertia[optimalK - 1] : null)),
        showLine: false,
        pointBackgroundColor: t.palette[1],
        pointBorderColor: t.pageBg,
        pointBorderWidth: 2,
        pointRadius: 12,
        pointHoverRadius: 14,
      },
    ],
  },
  options: {
    responsive: true,
    maintainAspectRatio: false,
    animation: false,
    plugins: {
      title: {
        display: true,
        text: "elbow-curve · javascript · chartjs · anyplot.ai",
        color: t.ink,
        font: { size: 22, weight: "500" },
        padding: { bottom: 20 },
      },
      legend: {
        labels: { color: t.ink, font: { size: 16 }, usePointStyle: true, pointStyle: "circle" },
      },
    },
    scales: {
      x: {
        title: { display: true, text: "Number of Clusters (k)", color: t.ink, font: { size: 16 } },
        ticks: { color: t.inkSoft, font: { size: 14 } },
        grid: { display: false },
      },
      y: {
        title: { display: true, text: "Inertia (Within-Cluster Sum of Squares)", color: t.ink, font: { size: 16 } },
        ticks: { color: t.inkSoft, font: { size: 14 } },
        grid: { color: t.grid },
        beginAtZero: true,
      },
    },
  },
});
Runnable source as JSON, for any HTTP client: https://api.anyplot.ai/specs/elbow-curve/chartjs/code. Any spec id and library id listed in llms-full.txt fit the same URL shape; every URL below is complete and callable.
{
  "spec_id": "elbow-curve",
  "language": "javascript",
  "library": "chartjs",
  "page": "https://anyplot.ai/elbow-curve/javascript/chartjs",
  "hub": "https://anyplot.ai/elbow-curve",
  "code_json": "https://api.anyplot.ai/specs/elbow-curve/chartjs/code",
  "spec_json": "https://api.anyplot.ai/specs/elbow-curve",
  "render_light_png": "https://storage.googleapis.com/anyplot-images/plots/elbow-curve/javascript/chartjs/plot-light.png",
  "render_dark_png": "https://storage.googleapis.com/anyplot-images/plots/elbow-curve/javascript/chartjs/plot-dark.png",
  "interactive_light_html": "https://storage.googleapis.com/anyplot-images/plots/elbow-curve/javascript/chartjs/plot-light.html",
  "interactive_dark_html": "https://storage.googleapis.com/anyplot-images/plots/elbow-curve/javascript/chartjs/plot-dark.html",
  "quality_score": 93.0,
  "license": "MIT",
  "guide": "https://anyplot.ai/llms.txt"
}
Part of Elbow Curve for K-Means Clustering on anyplot.ai.