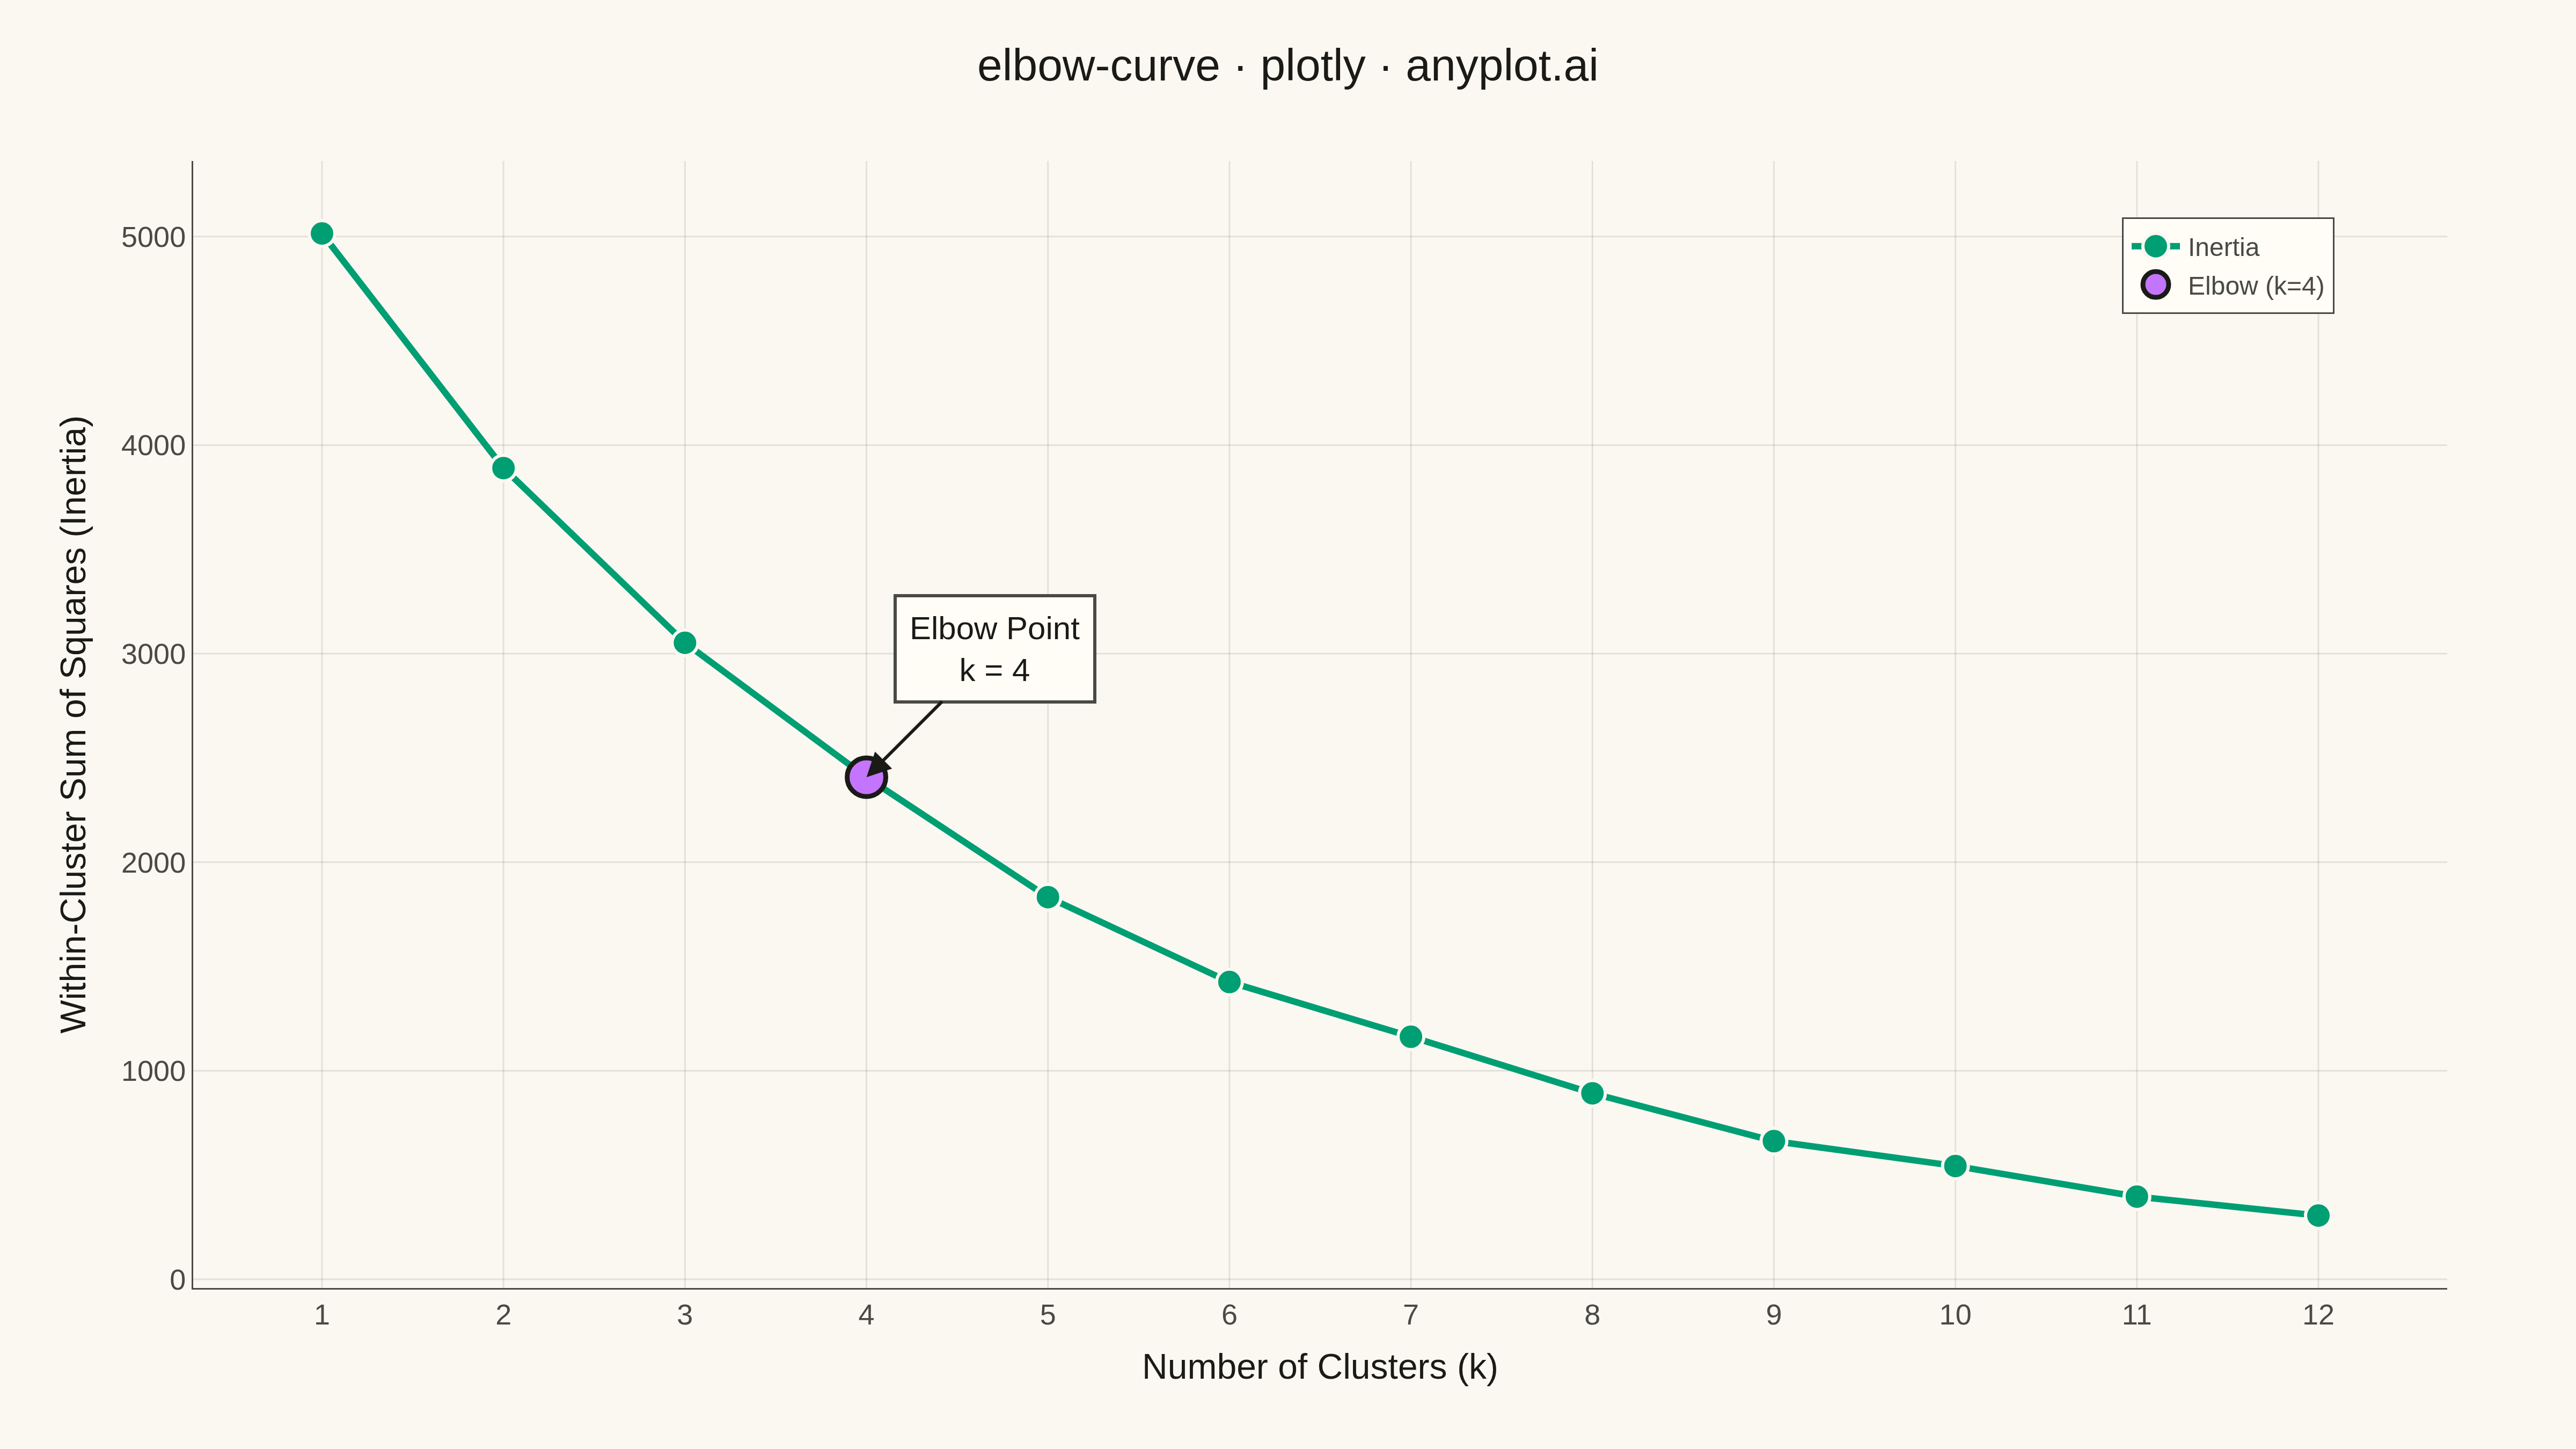
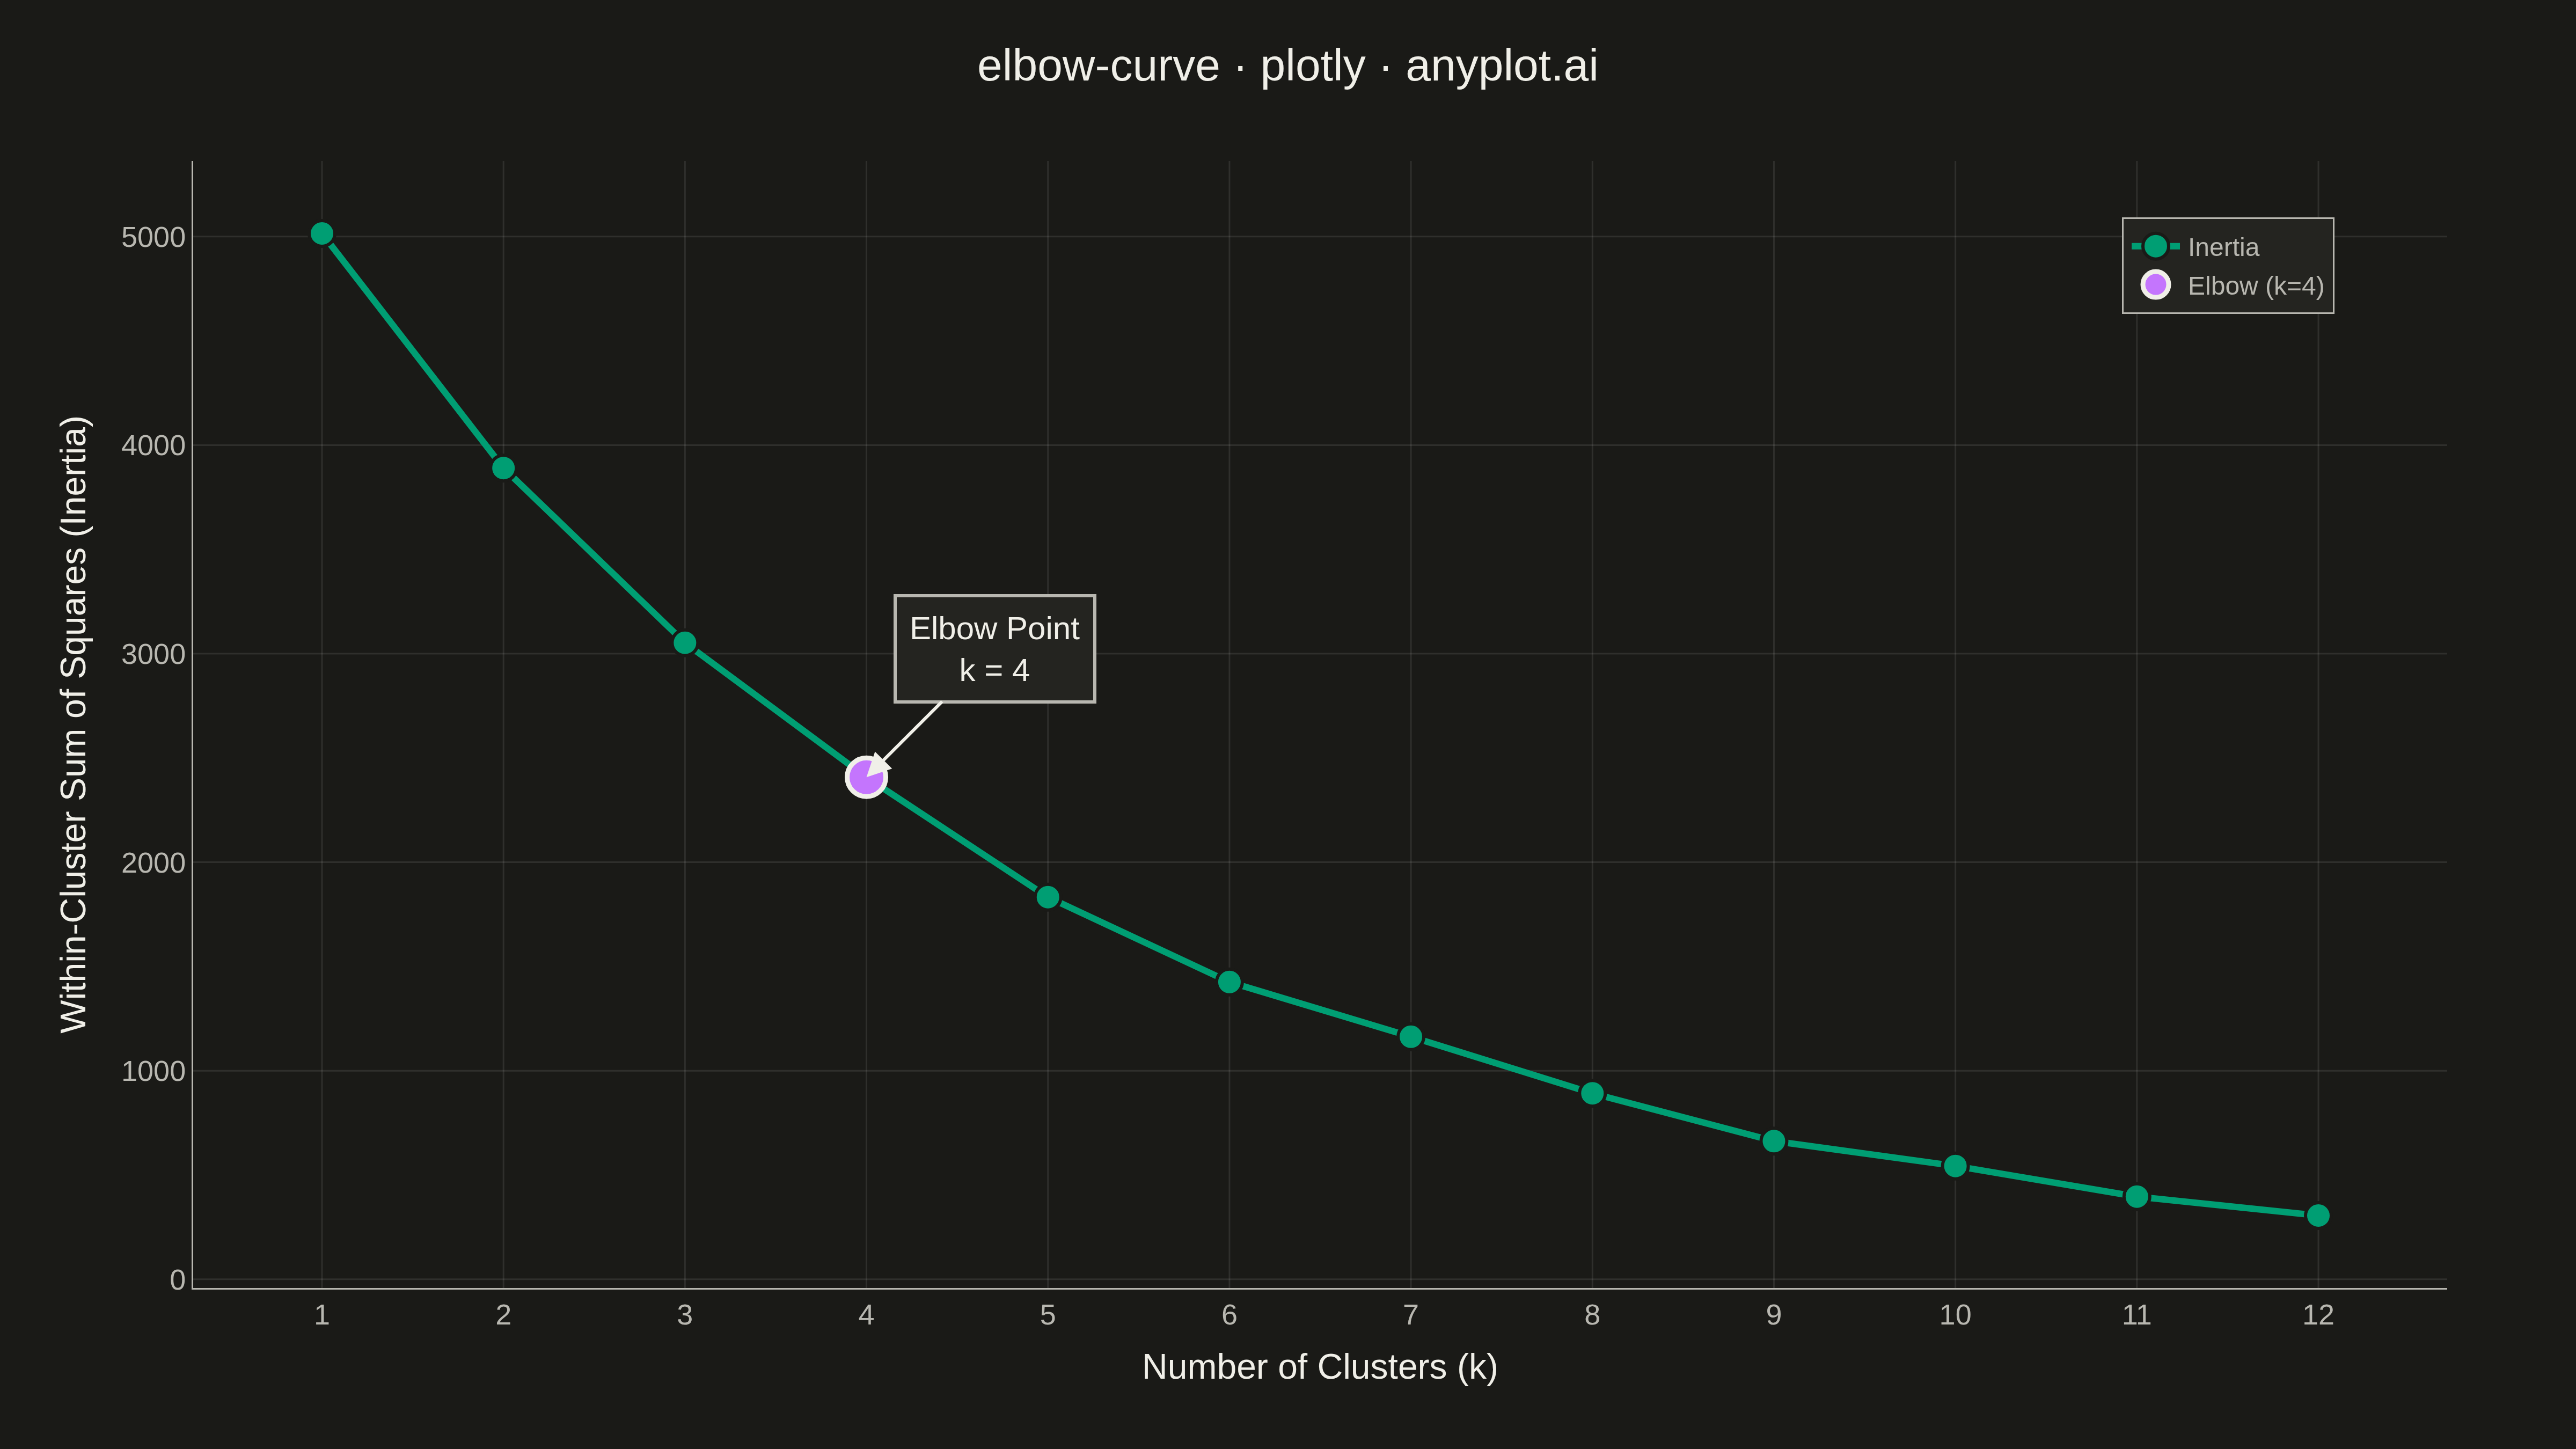
An elbow curve visualizes the relationship between the number of clusters (k) and within-cluster sum of squares (inertia/distortion) in K-means clustering. The plot helps identify the optimal number of clusters by finding the "elbow point" where adding more clusters yields diminishing returns in reducing inertia. This is a fundamental diagnostic tool for unsupervised learning parameter selection.
""" anyplot.ai
elbow-curve: Elbow Curve for K-Means Clustering
Library: plotly 6.7.0 | Python 3.13.13
Quality: 97/100 | Updated: 2026-05-10
"""

import os

import numpy as np
import plotly.graph_objects as go


# Theme tokens
THEME = os.getenv("ANYPLOT_THEME", "light")
PAGE_BG = "#FAF8F1" if THEME == "light" else "#1A1A17"
ELEVATED_BG = "#FFFDF6" if THEME == "light" else "#242420"
INK = "#1A1A17" if THEME == "light" else "#F0EFE8"
INK_SOFT = "#4A4A44" if THEME == "light" else "#B8B7B0"
GRID = "rgba(26,26,23,0.10)" if THEME == "light" else "rgba(240,239,232,0.10)"
BRAND = "#009E73"
ACCENT = "#C475FD"

# Data - simulate K-means inertia values for k=1 to k=12
np.random.seed(42)
k_values = np.arange(1, 13)

# Generate realistic inertia values that decrease with k
base_inertia = 5000
inertia = base_inertia * np.exp(-0.25 * (k_values - 1)) + np.random.normal(0, 30, len(k_values))
inertia = np.maximum(inertia, 100)
inertia = np.sort(inertia)[::-1]

# Optimal k (elbow point) is around k=4
optimal_k = 4
optimal_inertia = inertia[optimal_k - 1]

# Create figure
fig = go.Figure()

# Main curve with markers
fig.add_trace(
    go.Scatter(
        x=k_values,
        y=inertia,
        mode="lines+markers",
        name="Inertia",
        line={"color": BRAND, "width": 4},
        marker={"size": 16, "color": BRAND, "line": {"color": PAGE_BG, "width": 2}},
        hovertemplate="k=%{x}<br>Inertia=%{y:.0f}<extra></extra>",
    )
)

# Highlight the elbow point
fig.add_trace(
    go.Scatter(
        x=[optimal_k],
        y=[optimal_inertia],
        mode="markers",
        name=f"Elbow (k={optimal_k})",
        marker={"size": 24, "color": ACCENT, "symbol": "circle", "line": {"color": INK, "width": 3}},
        hovertemplate=f"Optimal k={optimal_k}<br>Inertia={optimal_inertia:.0f}<extra></extra>",
    )
)

# Add annotation for the elbow point
fig.add_annotation(
    x=optimal_k,
    y=optimal_inertia,
    text=f"Elbow Point<br>k = {optimal_k}",
    showarrow=True,
    arrowhead=2,
    arrowsize=1.5,
    arrowwidth=2,
    arrowcolor=INK,
    ax=80,
    ay=-80,
    font={"size": 20, "color": INK},
    bgcolor=ELEVATED_BG,
    bordercolor=INK_SOFT,
    borderwidth=2,
    borderpad=8,
)

# Update layout
fig.update_layout(
    title={"text": "elbow-curve · plotly · anyplot.ai", "font": {"size": 28, "color": INK}, "x": 0.5, "xanchor": "center"},
    xaxis={
        "title": {"text": "Number of Clusters (k)", "font": {"size": 22, "color": INK}},
        "tickfont": {"size": 18, "color": INK_SOFT},
        "tickmode": "linear",
        "tick0": 1,
        "dtick": 1,
        "showgrid": True,
        "gridcolor": GRID,
        "gridwidth": 1,
        "zeroline": False,
        "linecolor": INK_SOFT,
        "zerolinecolor": INK_SOFT,
    },
    yaxis={
        "title": {"text": "Within-Cluster Sum of Squares (Inertia)", "font": {"size": 22, "color": INK}},
        "tickfont": {"size": 18, "color": INK_SOFT},
        "showgrid": True,
        "gridcolor": GRID,
        "gridwidth": 1,
        "zeroline": False,
        "linecolor": INK_SOFT,
        "zerolinecolor": INK_SOFT,
    },
    paper_bgcolor=PAGE_BG,
    plot_bgcolor=PAGE_BG,
    showlegend=True,
    legend={
        "x": 0.95,
        "y": 0.95,
        "xanchor": "right",
        "yanchor": "top",
        "font": {"size": 16, "color": INK_SOFT},
        "bgcolor": ELEVATED_BG,
        "bordercolor": INK_SOFT,
        "borderwidth": 1,
    },
    margin={"l": 120, "r": 80, "t": 100, "b": 100},
)

# Save as PNG (4800x2700 via scale=3)
output_dir = os.path.dirname(os.path.abspath(__file__))
fig.write_image(os.path.join(output_dir, f"plot-{THEME}.png"), width=1600, height=900, scale=3)

# Save interactive HTML
fig.write_html(os.path.join(output_dir, f"plot-{THEME}.html"), include_plotlyjs="cdn")
Runnable source as JSON, for any HTTP client: https://api.anyplot.ai/specs/elbow-curve/plotly/code. Any spec id and library id listed in llms-full.txt fit the same URL shape; every URL below is complete and callable.
{
  "spec_id": "elbow-curve",
  "language": "python",
  "library": "plotly",
  "page": "https://anyplot.ai/elbow-curve/python/plotly",
  "hub": "https://anyplot.ai/elbow-curve",
  "code_json": "https://api.anyplot.ai/specs/elbow-curve/plotly/code",
  "spec_json": "https://api.anyplot.ai/specs/elbow-curve",
  "render_light_png": "https://storage.googleapis.com/anyplot-images/plots/elbow-curve/python/plotly/plot-light.png",
  "render_dark_png": "https://storage.googleapis.com/anyplot-images/plots/elbow-curve/python/plotly/plot-dark.png",
  "interactive_light_html": "https://storage.googleapis.com/anyplot-images/plots/elbow-curve/python/plotly/plot-light.html",
  "interactive_dark_html": "https://storage.googleapis.com/anyplot-images/plots/elbow-curve/python/plotly/plot-dark.html",
  "quality_score": 97.0,
  "license": "MIT",
  "guide": "https://anyplot.ai/llms.txt"
}
Part of Elbow Curve for K-Means Clustering on anyplot.ai.