The same plot in 14 other libraries — JavaScript: Chart.js, D3.js, Apache ECharts, Highcharts; Python: Altair, Bokeh, lets-plot, Matplotlib, Plotly, plotnine, Pygal, Seaborn; R: ggplot2; Julia: Makie.jl. Compare all 15 side by side: Elbow Curve for K-Means Clustering in Python, R, Julia and JavaScript.
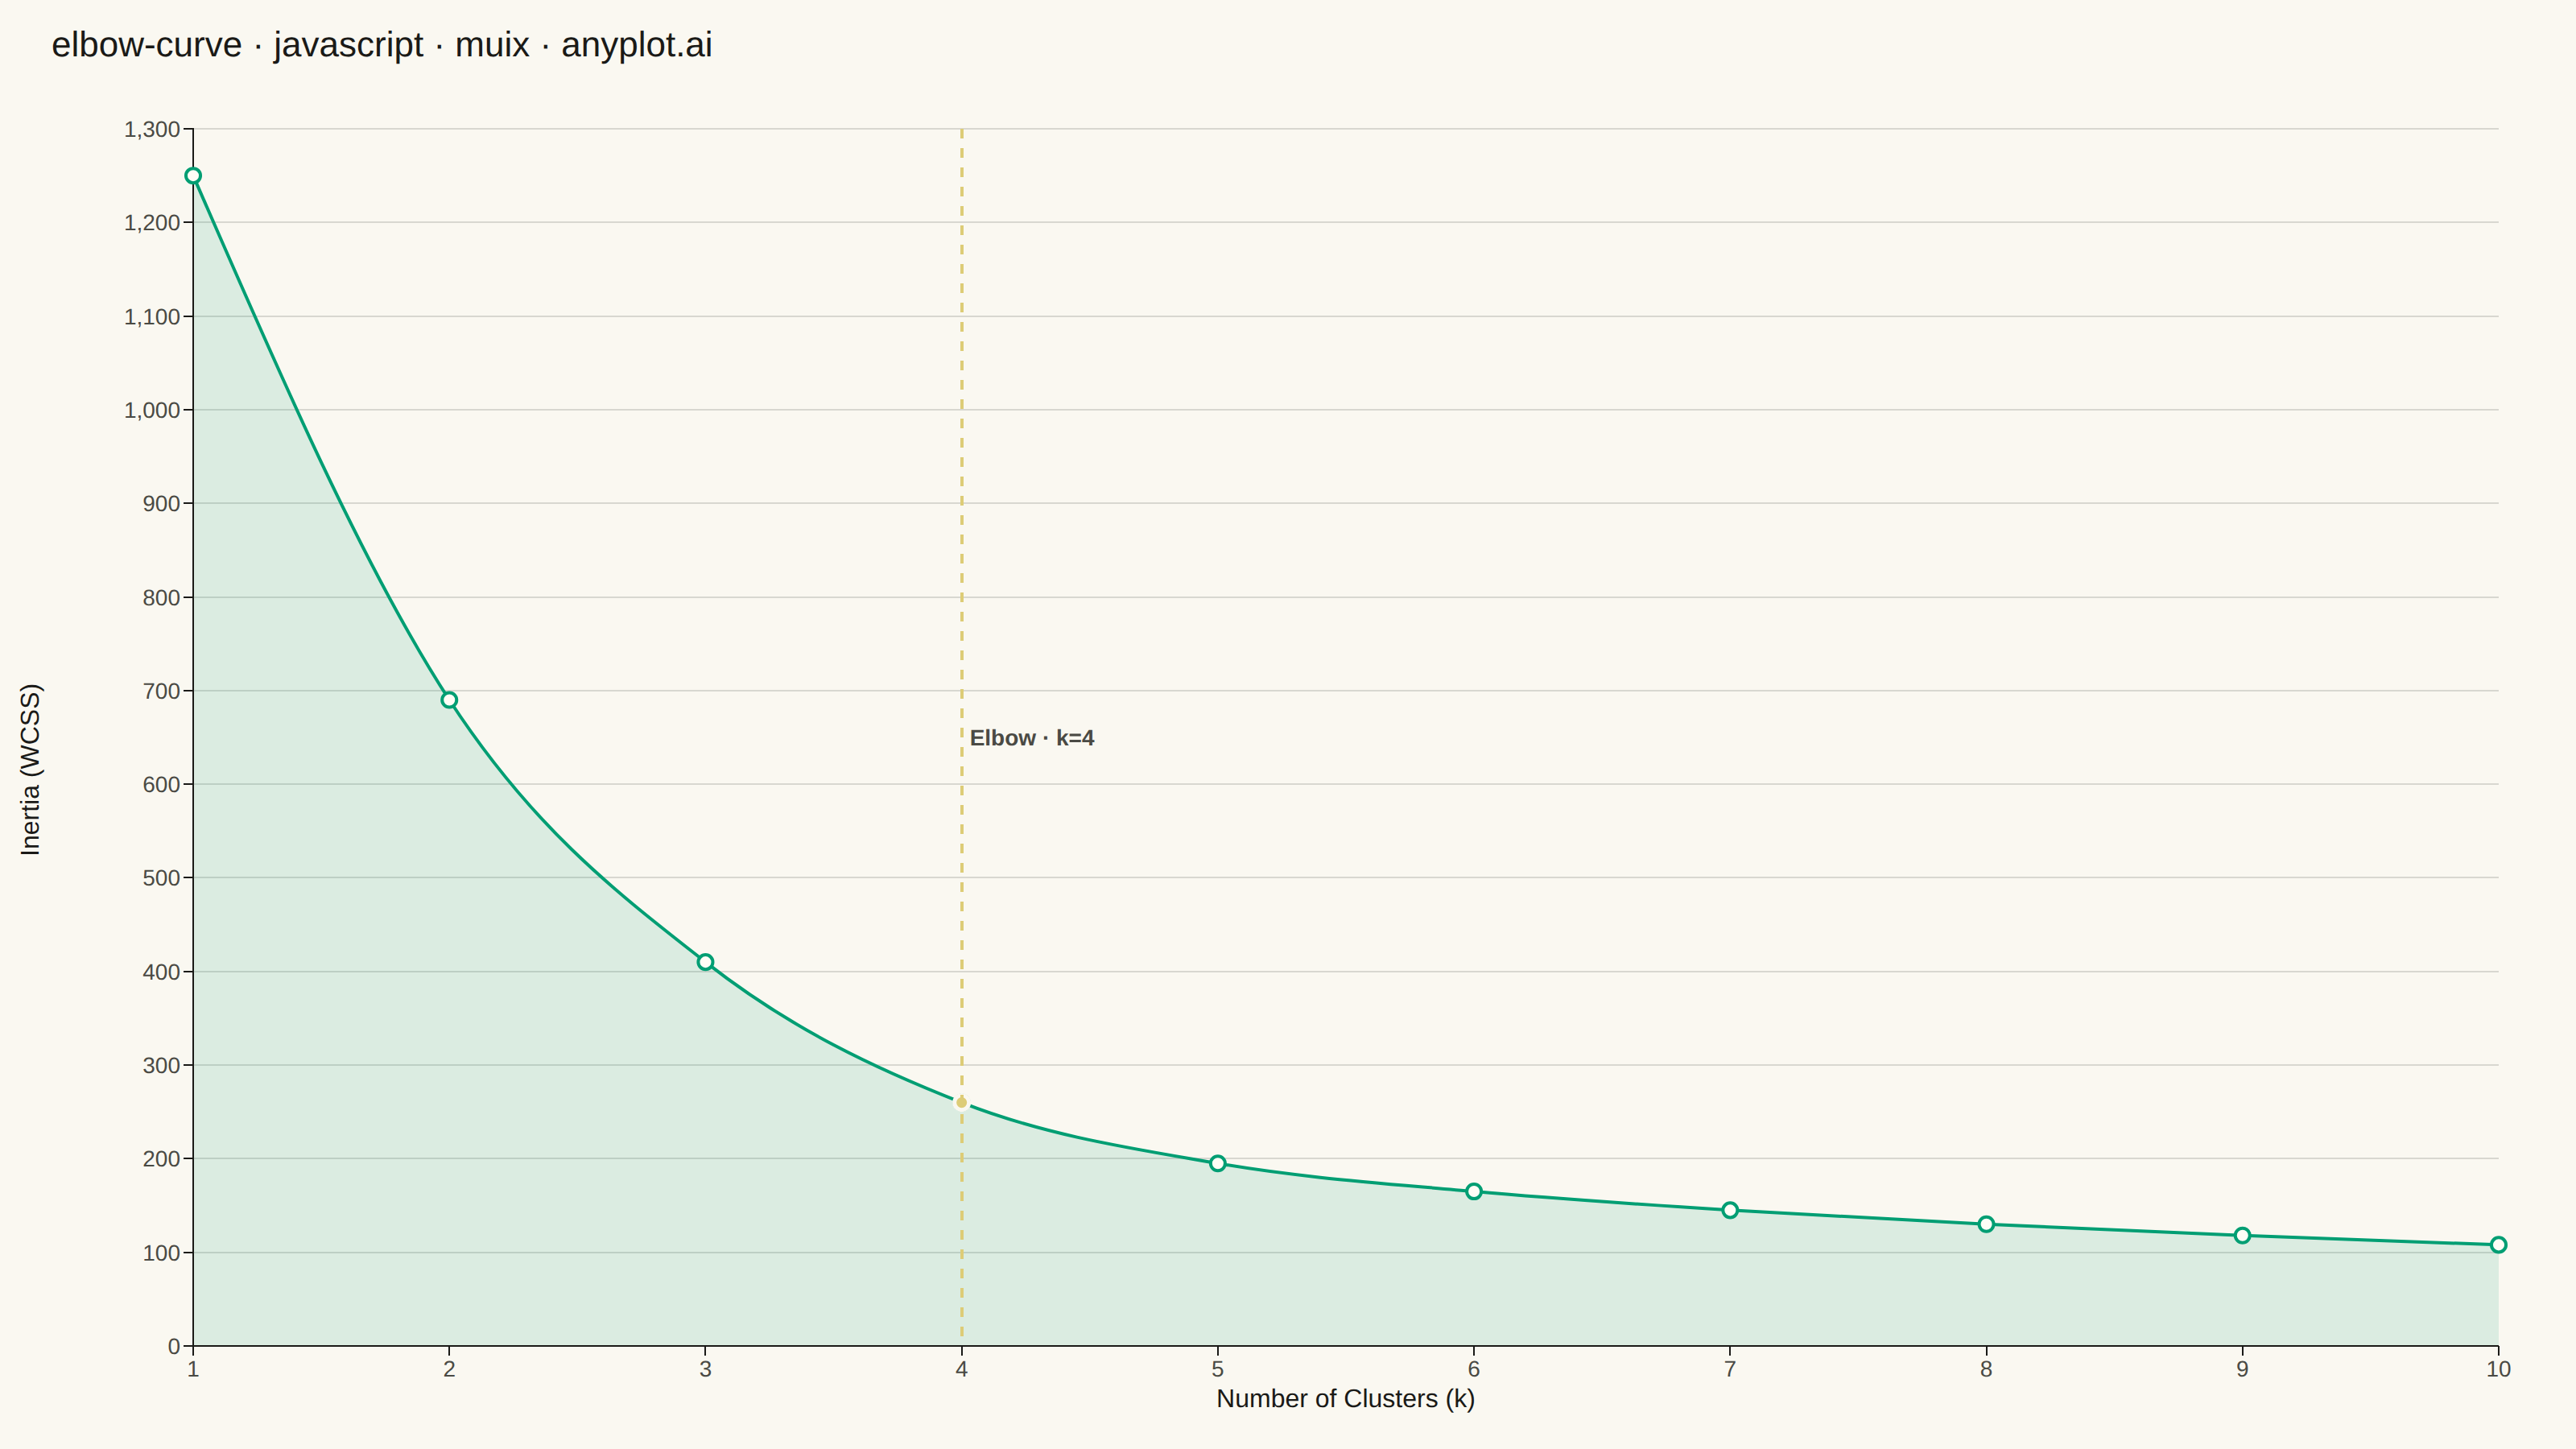
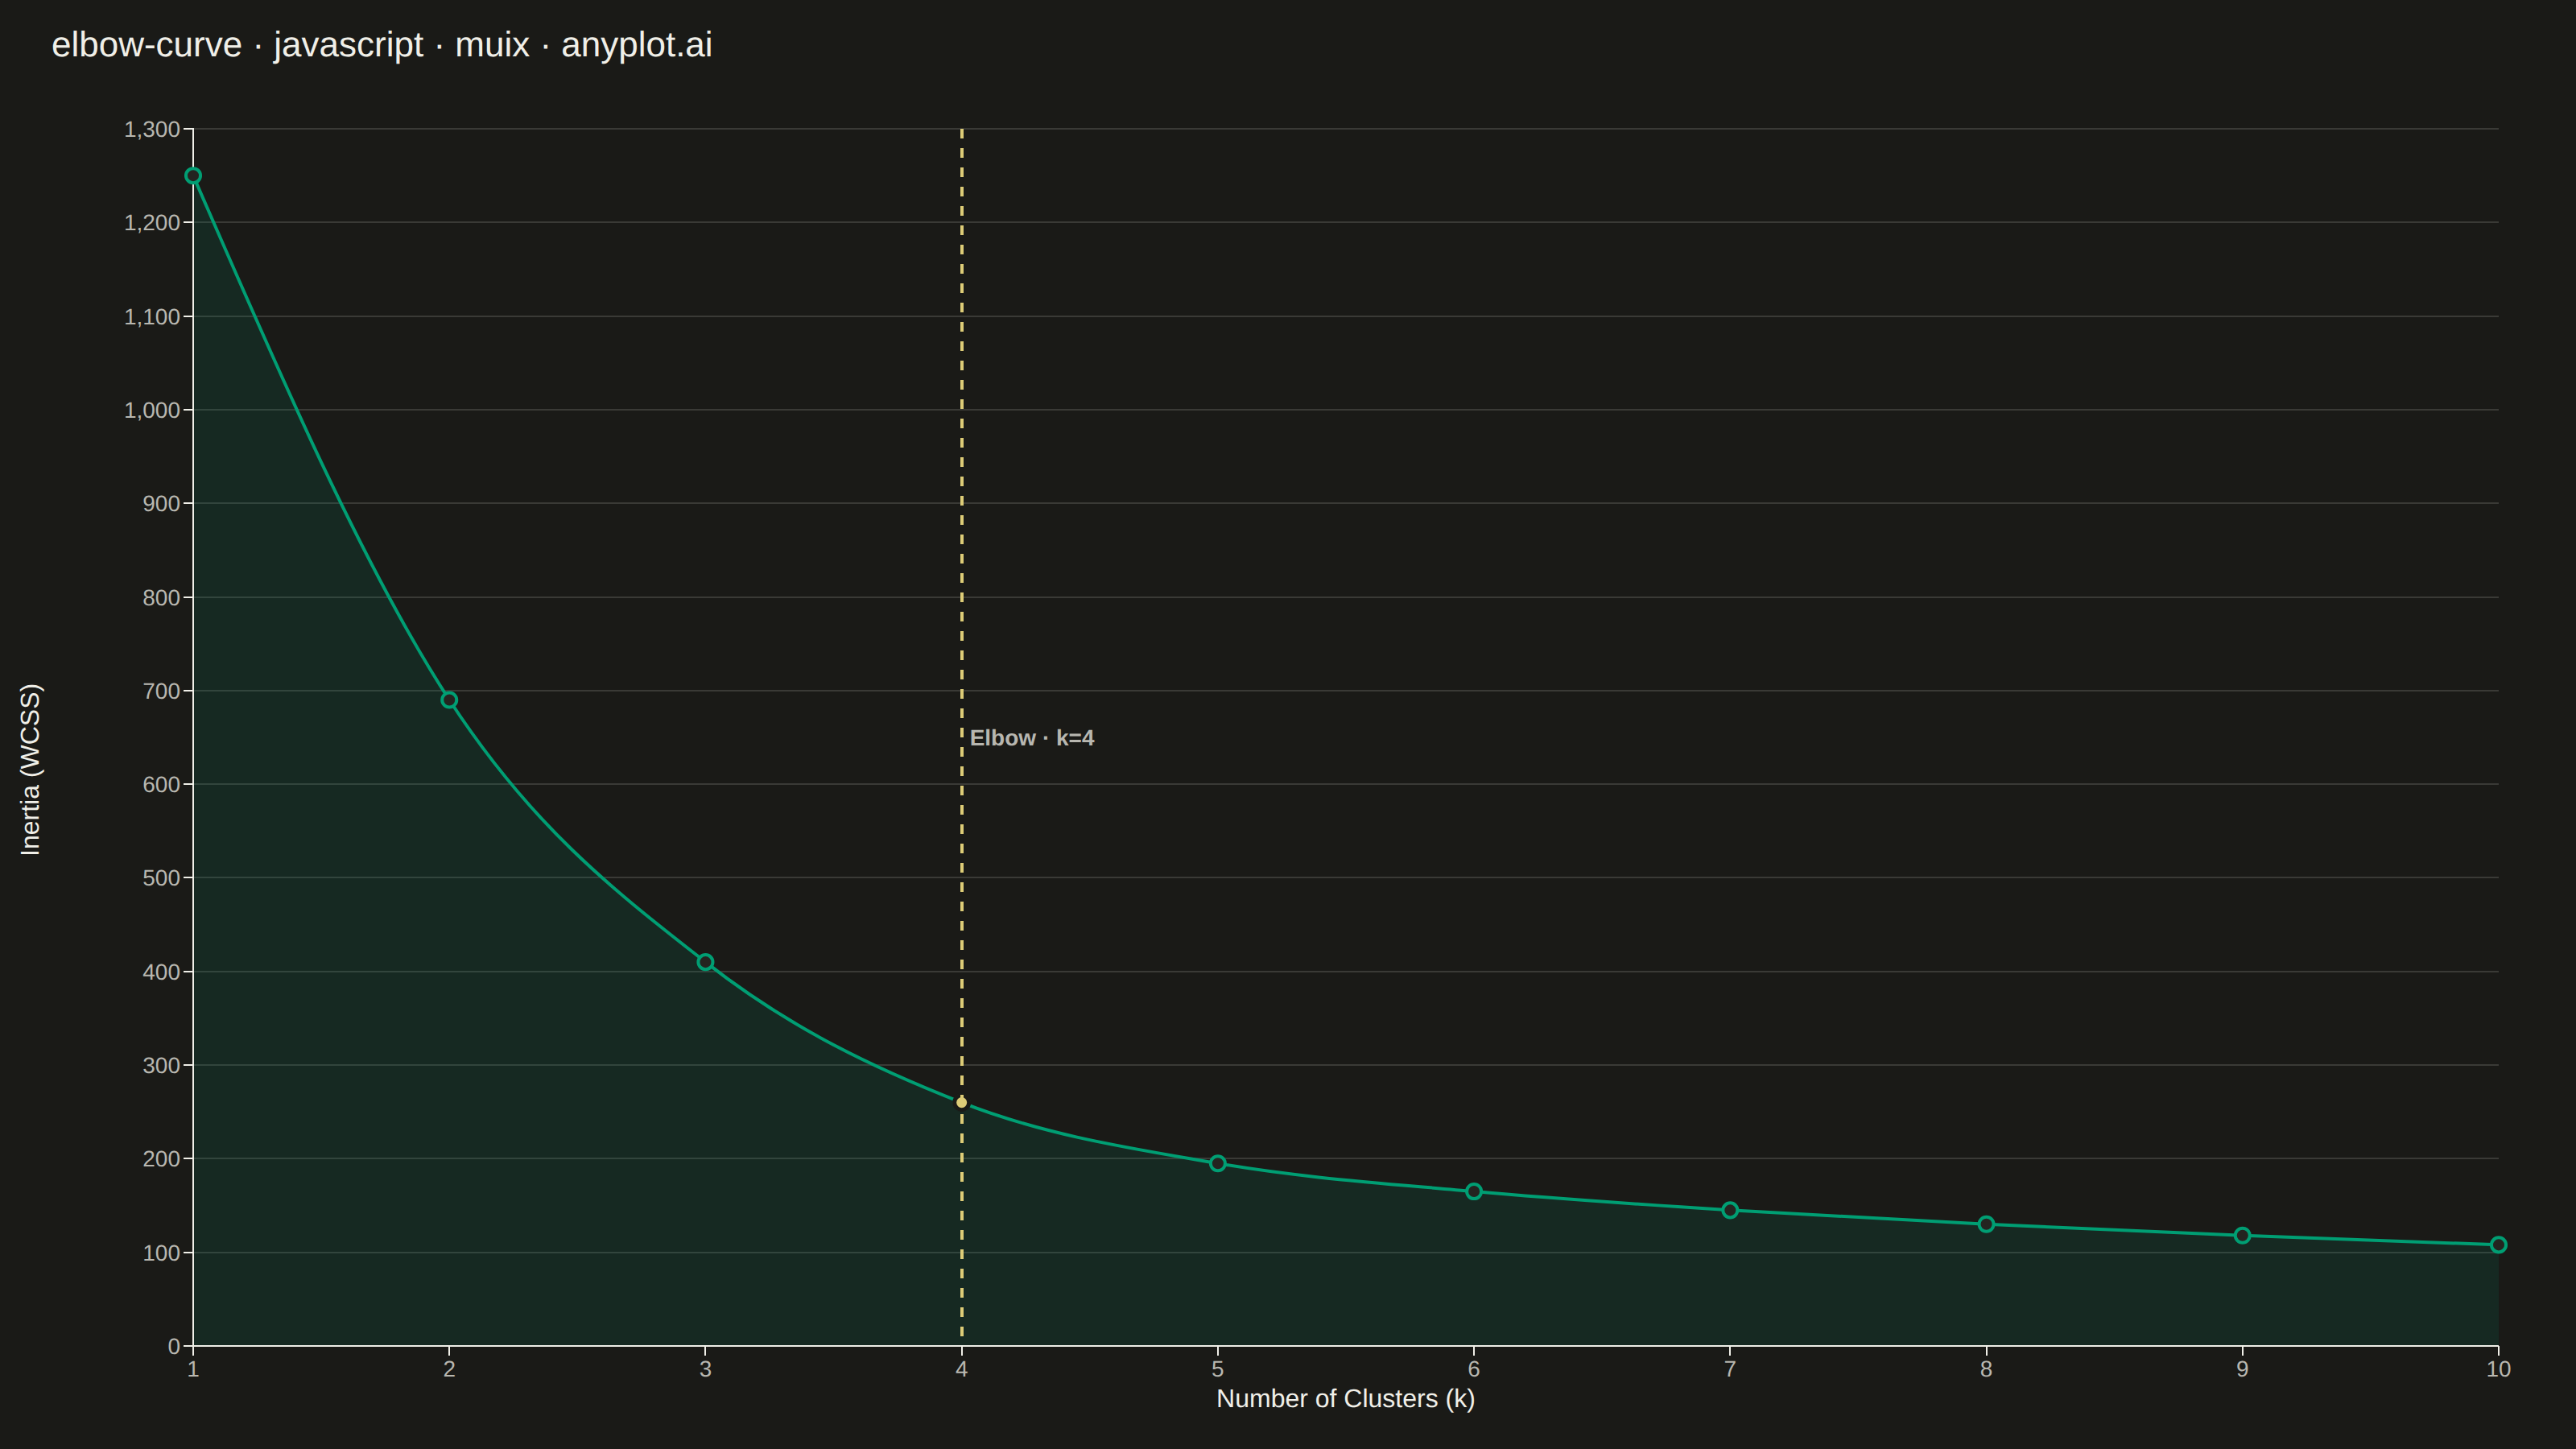
An elbow curve visualizes the relationship between the number of clusters (k) and within-cluster sum of squares (inertia/distortion) in K-means clustering. The plot helps identify the optimal number of clusters by finding the "elbow point" where adding more clusters yields diminishing returns in reducing inertia. This is a fundamental diagnostic tool for unsupervised learning parameter selection.
// anyplot.ai
// elbow-curve: Elbow Curve for K-Means Clustering
// Library: muix 7.29.1 | JavaScript 22.23.2
// Quality: 94/100 | Created: 2026-09-05
import { LineChart } from "@mui/x-charts/LineChart";
import { ChartsReferenceLine } from "@mui/x-charts/ChartsReferenceLine";

const t = window.ANYPLOT_TOKENS;
const { width, height } = window.ANYPLOT_SIZE;

// --- Data (in-memory, deterministic): K-means inertia for customer segmentation ---
const kValues = [1, 2, 3, 4, 5, 6, 7, 8, 9, 10];
const inertia = [1250, 690, 410, 260, 195, 165, 145, 130, 118, 108];
const optimalK = 4;
const optimalKIndex = kValues.indexOf(optimalK);
// A second series holding a single non-null point (the rest are `null`, with
// connectNulls off) so only the elbow marker renders — recolored via `sx`
// below to emphasize the elbow point beyond the reference line alone.
const elbowMarkerData = kValues.map((_, i) =>
  i === optimalKIndex ? inertia[optimalKIndex] : null,
);

const TITLE = "elbow-curve · javascript · muix · anyplot.ai";
const TITLE_HEIGHT = 56;
const Y_LABEL_WIDTH = 40;

// MUI X's built-in yAxis `label` offsets from a fixed (tickFontSize + tickSize
// + 10) constant rather than the tick labels' measured width, so it collides
// with wide tick numbers (e.g. "1,300") at this fontSize — render the axis
// title as its own rotated element instead, with guaranteed dedicated space.
const yAxisLabelStyle = {
  writingMode: "vertical-rl" as const,
  transform: "rotate(180deg)",
  color: t.ink,
  fontSize: 16,
  width: Y_LABEL_WIDTH,
  display: "flex",
  alignItems: "center",
  justifyContent: "center",
};

// --- Chart (default-exported component — the harness mounts it) -------------
export default function Chart() {
  return (
    <div
      style={{
        width,
        height,
        display: "flex",
        flexDirection: "column",
        backgroundColor: t.pageBg,
      }}
    >
      <div
        style={{
          height: TITLE_HEIGHT,
          display: "flex",
          alignItems: "center",
          paddingLeft: 32,
        }}
      >
        <span style={{ color: t.ink, fontSize: 22, fontWeight: 500 }}>
          {TITLE}
        </span>
      </div>
      <div
        style={{
          display: "flex",
          flexDirection: "row",
          height: height - TITLE_HEIGHT,
        }}
      >
        <span style={yAxisLabelStyle}>Inertia (WCSS)</span>
        <LineChart
          width={width - Y_LABEL_WIDTH}
          height={height - TITLE_HEIGHT}
          skipAnimation
          margin={{ top: 24, right: 48, bottom: 64, left: 80 }}
          xAxis={[
            {
              data: kValues,
              scaleType: "linear",
              label: "Number of Clusters (k)",
              tickMinStep: 1,
              labelStyle: { fontSize: 16, fill: t.ink },
              tickLabelStyle: { fontSize: 14, fill: t.inkSoft },
            },
          ]}
          yAxis={[
            {
              tickLabelStyle: { fontSize: 14, fill: t.inkSoft },
            },
          ]}
          series={[
            {
              id: "inertia",
              data: inertia,
              label: "Within-cluster sum of squares",
              color: t.palette[0],
              showMark: true,
              curve: "monotoneX",
              area: true,
            },
            {
              id: "elbowMarker",
              data: elbowMarkerData,
              color: t.amber,
              showMark: true,
              connectNulls: false,
              disableHighlight: true,
            },
          ]}
          grid={{ horizontal: true }}
          slotProps={{ legend: { hidden: true } }}
          sx={{
            // Subtle brand-green fill under the curve — a deliberate design
            // touch beyond a bare line, kept low-opacity so it stays a wash
            // rather than competing with the line/markers.
            "& .MuiAreaElement-series-inertia": {
              fill: t.palette[0],
              opacity: 0.12,
            },
            // Solid amber-filled marker at k=4 (vs. the hollow green marks
            // elsewhere) so the elbow point reads as emphasized, not just
            // co-located with the dashed reference line.
            "& .MuiMarkElement-series-elbowMarker": {
              fill: t.amber,
              stroke: t.pageBg,
              strokeWidth: 2.5,
            },
          }}
        >
          <ChartsReferenceLine
            x={optimalK}
            label={`Elbow · k=${optimalK}`}
            labelAlign="middle"
            lineStyle={{
              stroke: t.amber,
              strokeDasharray: "6 6",
              strokeWidth: 2,
            }}
            labelStyle={{
              fill: t.inkSoft,
              fontSize: 14,
              fontWeight: 600,
              // Text-stroke halo acts as a background chip so the label
              // stays crisp where it crosses gridlines/the dashed line.
              paintOrder: "stroke",
              stroke: t.pageBg,
              strokeWidth: 6,
              strokeLinejoin: "round",
            }}
          />
        </LineChart>
      </div>
    </div>
  );
}
Runnable source as JSON, for any HTTP client: https://api.anyplot.ai/specs/elbow-curve/muix/code. Any spec id and library id listed in llms-full.txt fit the same URL shape; every URL below is complete and callable.
{
  "spec_id": "elbow-curve",
  "language": "javascript",
  "library": "muix",
  "page": "https://anyplot.ai/elbow-curve/javascript/muix",
  "hub": "https://anyplot.ai/elbow-curve",
  "code_json": "https://api.anyplot.ai/specs/elbow-curve/muix/code",
  "spec_json": "https://api.anyplot.ai/specs/elbow-curve",
  "render_light_png": "https://storage.googleapis.com/anyplot-images/plots/elbow-curve/javascript/muix/plot-light.png",
  "render_dark_png": "https://storage.googleapis.com/anyplot-images/plots/elbow-curve/javascript/muix/plot-dark.png",
  "interactive_light_html": "https://storage.googleapis.com/anyplot-images/plots/elbow-curve/javascript/muix/plot-light.html",
  "interactive_dark_html": "https://storage.googleapis.com/anyplot-images/plots/elbow-curve/javascript/muix/plot-dark.html",
  "quality_score": 94.0,
  "license": "MIT",
  "guide": "https://anyplot.ai/llms.txt"
}
Part of Elbow Curve for K-Means Clustering on anyplot.ai.