The same plot in 14 other libraries — JavaScript: Chart.js, Apache ECharts, Highcharts, MUI X Charts; Python: Altair, Bokeh, lets-plot, Matplotlib, Plotly, plotnine, Pygal, Seaborn; R: ggplot2; Julia: Makie.jl. Compare all 15 side by side: Elbow Curve for K-Means Clustering in Python, R, Julia and JavaScript.
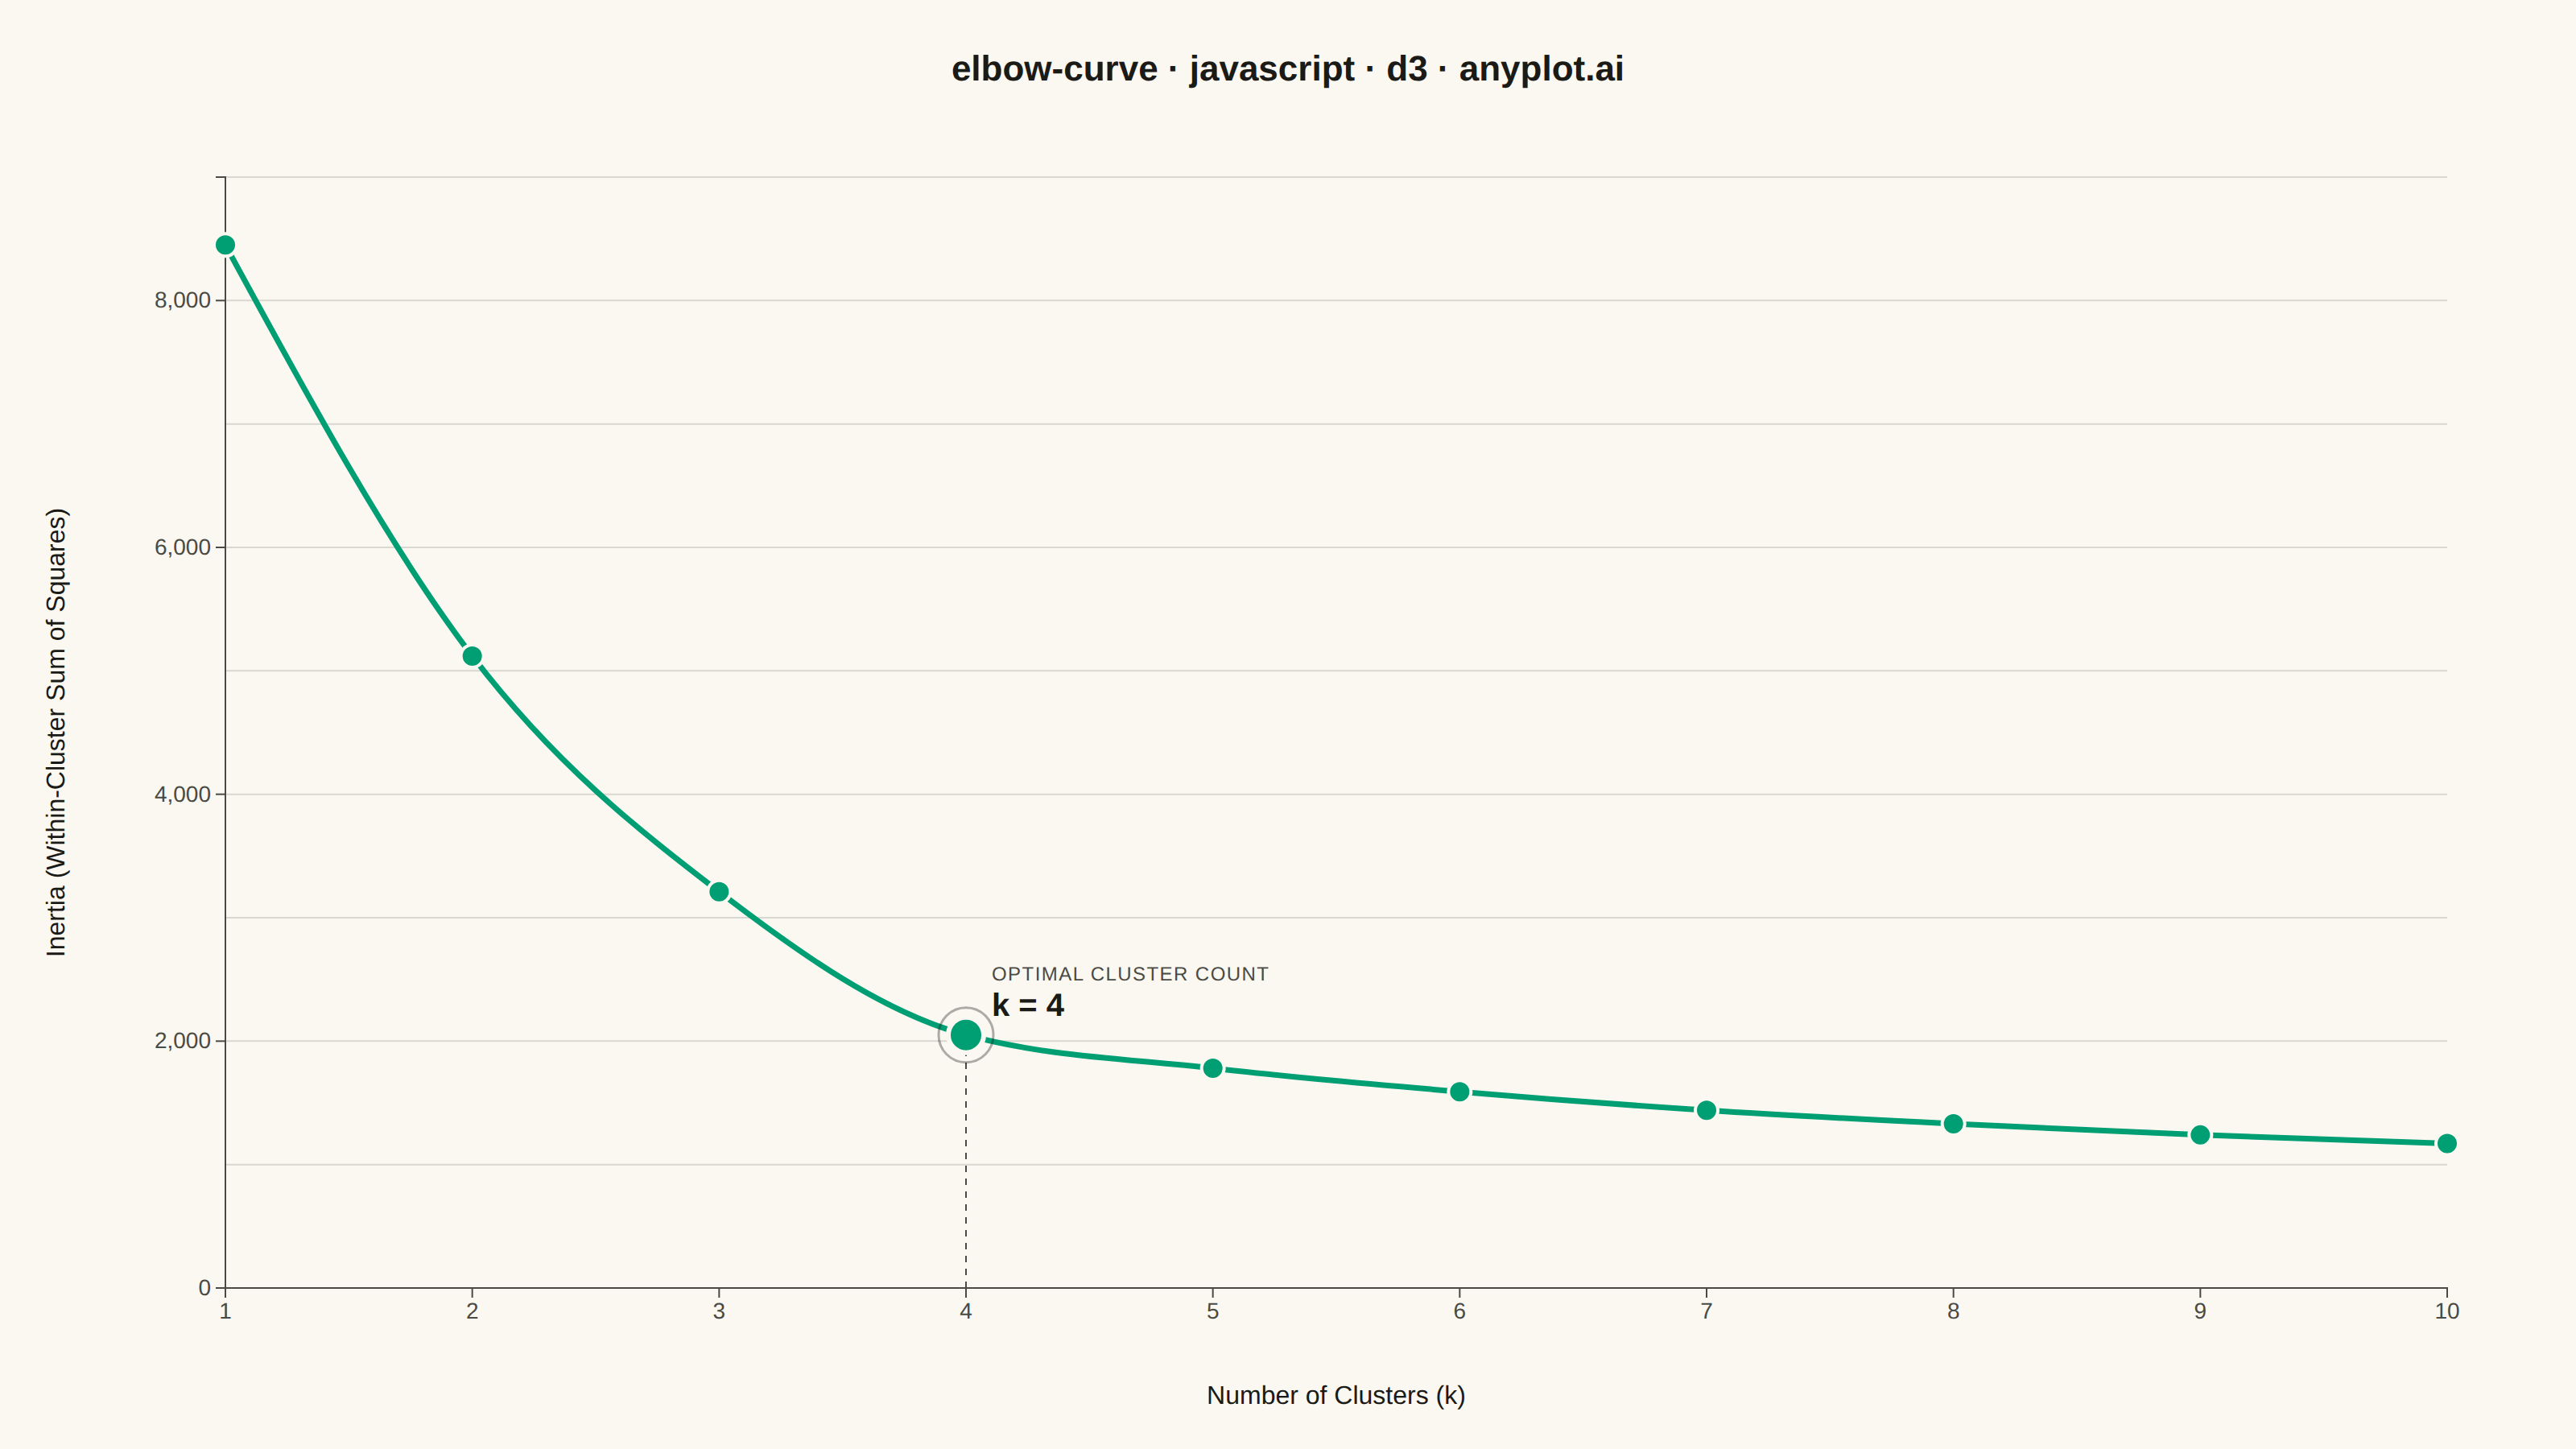
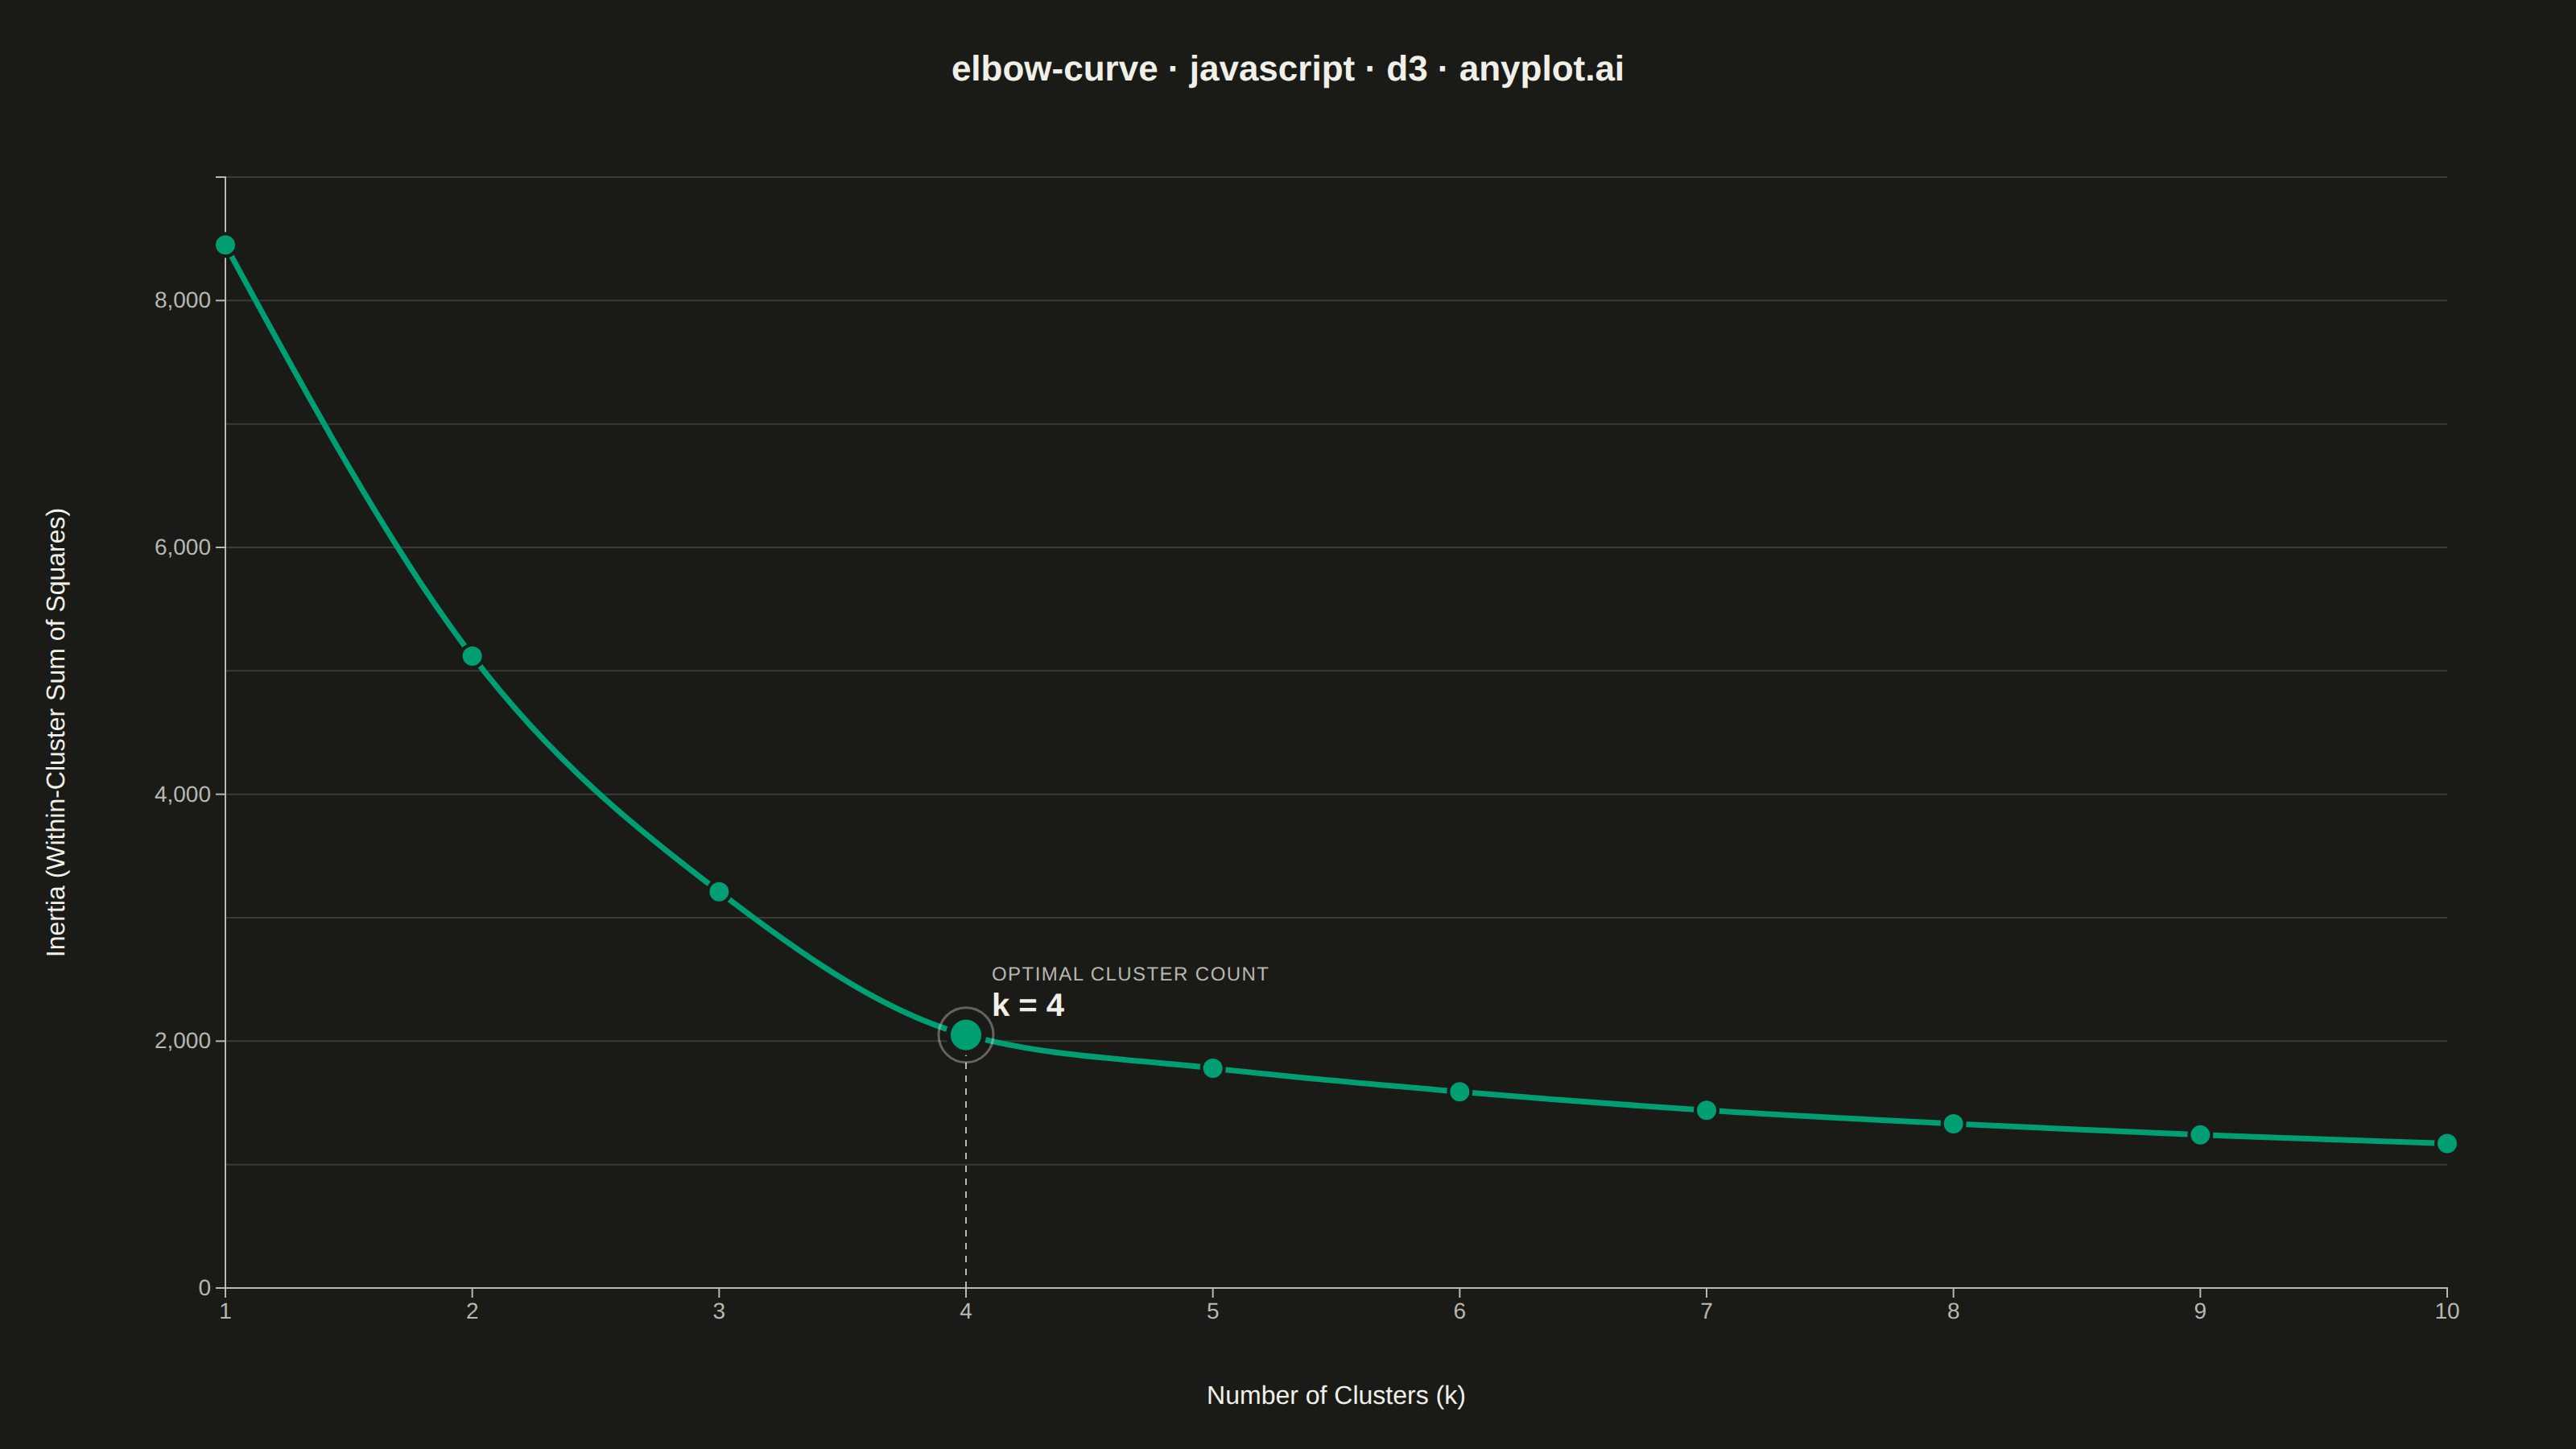
An elbow curve visualizes the relationship between the number of clusters (k) and within-cluster sum of squares (inertia/distortion) in K-means clustering. The plot helps identify the optimal number of clusters by finding the "elbow point" where adding more clusters yields diminishing returns in reducing inertia. This is a fundamental diagnostic tool for unsupervised learning parameter selection.
// anyplot.ai
// elbow-curve: Elbow Curve for K-Means Clustering
// Library: d3 7.9.0 | JavaScript 22.23.2
// Quality: 92/100 | Created: 2026-09-05

const t = window.ANYPLOT_TOKENS;
const { width, height } = window.ANYPLOT_SIZE;
const margin = { top: 110, right: 80, bottom: 100, left: 140 };
const iw = width - margin.left - margin.right;
const ih = height - margin.top - margin.bottom;

// --- Data (in-memory, deterministic) ----------------------------------------
// K-means inertia (within-cluster sum of squares) for customer segmentation
// on annual spend + purchase frequency, k = 1..10. The rate of decrease flattens
// sharply after k = 4 — the elbow point.
const kValues = [1, 2, 3, 4, 5, 6, 7, 8, 9, 10];
const inertia = [8450, 5120, 3210, 2050, 1780, 1590, 1440, 1330, 1240, 1170];
const elbowK = 4;

// --- SVG mount ---------------------------------------------------------------
const svg = d3.select("#container").append("svg").attr("width", width).attr("height", height);
const g = svg.append("g").attr("transform", `translate(${margin.left},${margin.top})`);

// --- Scales --------------------------------------------------------------------
const x = d3.scaleLinear().domain([1, 10]).range([0, iw]);
const y = d3.scaleLinear().domain([0, d3.max(inertia)]).nice().range([ih, 0]);

// --- Y-axis gridlines (subtle, no x-axis grid for a single-line chart) --------
g.append("g")
  .call(d3.axisLeft(y).tickSize(-iw).tickFormat(""))
  .call((sel) => sel.select(".domain").remove())
  .selectAll("line")
  .attr("stroke", t.grid);

// --- Axes ------------------------------------------------------------------
const xAxis = g
  .append("g")
  .attr("transform", `translate(0,${ih})`)
  .call(d3.axisBottom(x).ticks(10).tickFormat(d3.format("d")));
const yAxis = g.append("g").call(d3.axisLeft(y).ticks(6).tickFormat(d3.format(",")));

for (const ax of [xAxis, yAxis]) {
  ax.selectAll("text").attr("fill", t.inkSoft).style("font-size", "14px");
  ax.selectAll("line").attr("stroke", t.inkSoft);
  ax.select(".domain").attr("stroke", t.inkSoft);
}

// --- Elbow guide line -----------------------------------------------------
g.append("line")
  .attr("x1", x(elbowK))
  .attr("x2", x(elbowK))
  .attr("y1", y(0))
  .attr("y2", y(inertia[elbowK - 1]))
  .attr("stroke", t.inkSoft)
  .attr("stroke-dasharray", "4,4")
  .attr("stroke-width", 1);

// --- Connecting line (curveMonotoneX: a d3-shape interpolation that keeps the
// curve monotone between points, so the elbow bend reads as a smooth shape
// instead of jointed straight segments, without overshooting the data) -------
const line = d3
  .line()
  .x((d, i) => x(kValues[i]))
  .y((d) => y(d))
  .curve(d3.curveMonotoneX);
g.append("path").datum(inertia).attr("fill", "none").attr("stroke", t.palette[0]).attr("stroke-width", 3.5).attr("d", line);

// --- Elbow halo: a non-semantic ink ring (no amber) draws the eye to the
// optimal point while its size, not its hue, carries the emphasis ------------
g.append("circle")
  .attr("cx", x(elbowK))
  .attr("cy", y(inertia[elbowK - 1]))
  .attr("r", 17)
  .attr("fill", "none")
  .attr("stroke", t.ink)
  .attr("stroke-width", 1.5)
  .attr("opacity", 0.35);

// --- Markers, with the elbow point picked out by size + a bolder page-bg
// stroke rather than a semantic (warning) color ------------------------------
g.selectAll("circle.point")
  .data(inertia)
  .join("circle")
  .attr("class", "point")
  .attr("cx", (d, i) => x(kValues[i]))
  .attr("cy", (d) => y(d))
  .attr("r", (d, i) => (kValues[i] === elbowK ? 11 : 7))
  .attr("fill", t.palette[0])
  .attr("stroke", t.pageBg)
  .attr("stroke-width", (d, i) => (kValues[i] === elbowK ? 3 : 2));

// --- Elbow annotation (spec explicitly calls for highlighting the optimal k) —
// a small-caps label over a bold value gives the callout its own typographic
// hierarchy instead of a single line at the axis-label weight ----------------
const annotation = g
  .append("g")
  .attr("transform", `translate(${x(elbowK) + 16},${y(inertia[elbowK - 1]) - 34})`);
annotation
  .append("text")
  .attr("fill", t.inkSoft)
  .style("font-size", "12px")
  .style("font-weight", "500")
  .style("letter-spacing", "0.06em")
  .text("OPTIMAL CLUSTER COUNT");
annotation
  .append("text")
  .attr("y", 22)
  .attr("fill", t.ink)
  .style("font-size", "20px")
  .style("font-weight", "700")
  .text(`k = ${elbowK}`);

// --- Axis labels -------------------------------------------------------------
svg
  .append("text")
  .attr("x", margin.left + iw / 2)
  .attr("y", height - 28)
  .attr("text-anchor", "middle")
  .attr("fill", t.ink)
  .style("font-size", "16px")
  .text("Number of Clusters (k)");

svg
  .append("text")
  .attr("transform", "rotate(-90)")
  .attr("x", -(margin.top + ih / 2))
  .attr("y", 40)
  .attr("text-anchor", "middle")
  .attr("fill", t.ink)
  .style("font-size", "16px")
  .text("Inertia (Within-Cluster Sum of Squares)");

// --- Title -------------------------------------------------------------------
svg
  .append("text")
  .attr("x", width / 2)
  .attr("y", 50)
  .attr("text-anchor", "middle")
  .attr("fill", t.ink)
  .style("font-size", "22px")
  .style("font-weight", "600")
  .text("elbow-curve · javascript · d3 · anyplot.ai");
Runnable source as JSON, for any HTTP client: https://api.anyplot.ai/specs/elbow-curve/d3/code. Any spec id and library id listed in llms-full.txt fit the same URL shape; every URL below is complete and callable.
{
  "spec_id": "elbow-curve",
  "language": "javascript",
  "library": "d3",
  "page": "https://anyplot.ai/elbow-curve/javascript/d3",
  "hub": "https://anyplot.ai/elbow-curve",
  "code_json": "https://api.anyplot.ai/specs/elbow-curve/d3/code",
  "spec_json": "https://api.anyplot.ai/specs/elbow-curve",
  "render_light_png": "https://storage.googleapis.com/anyplot-images/plots/elbow-curve/javascript/d3/plot-light.png",
  "render_dark_png": "https://storage.googleapis.com/anyplot-images/plots/elbow-curve/javascript/d3/plot-dark.png",
  "interactive_light_html": "https://storage.googleapis.com/anyplot-images/plots/elbow-curve/javascript/d3/plot-light.html",
  "interactive_dark_html": "https://storage.googleapis.com/anyplot-images/plots/elbow-curve/javascript/d3/plot-dark.html",
  "quality_score": 92.0,
  "license": "MIT",
  "guide": "https://anyplot.ai/llms.txt"
}
Part of Elbow Curve for K-Means Clustering on anyplot.ai.