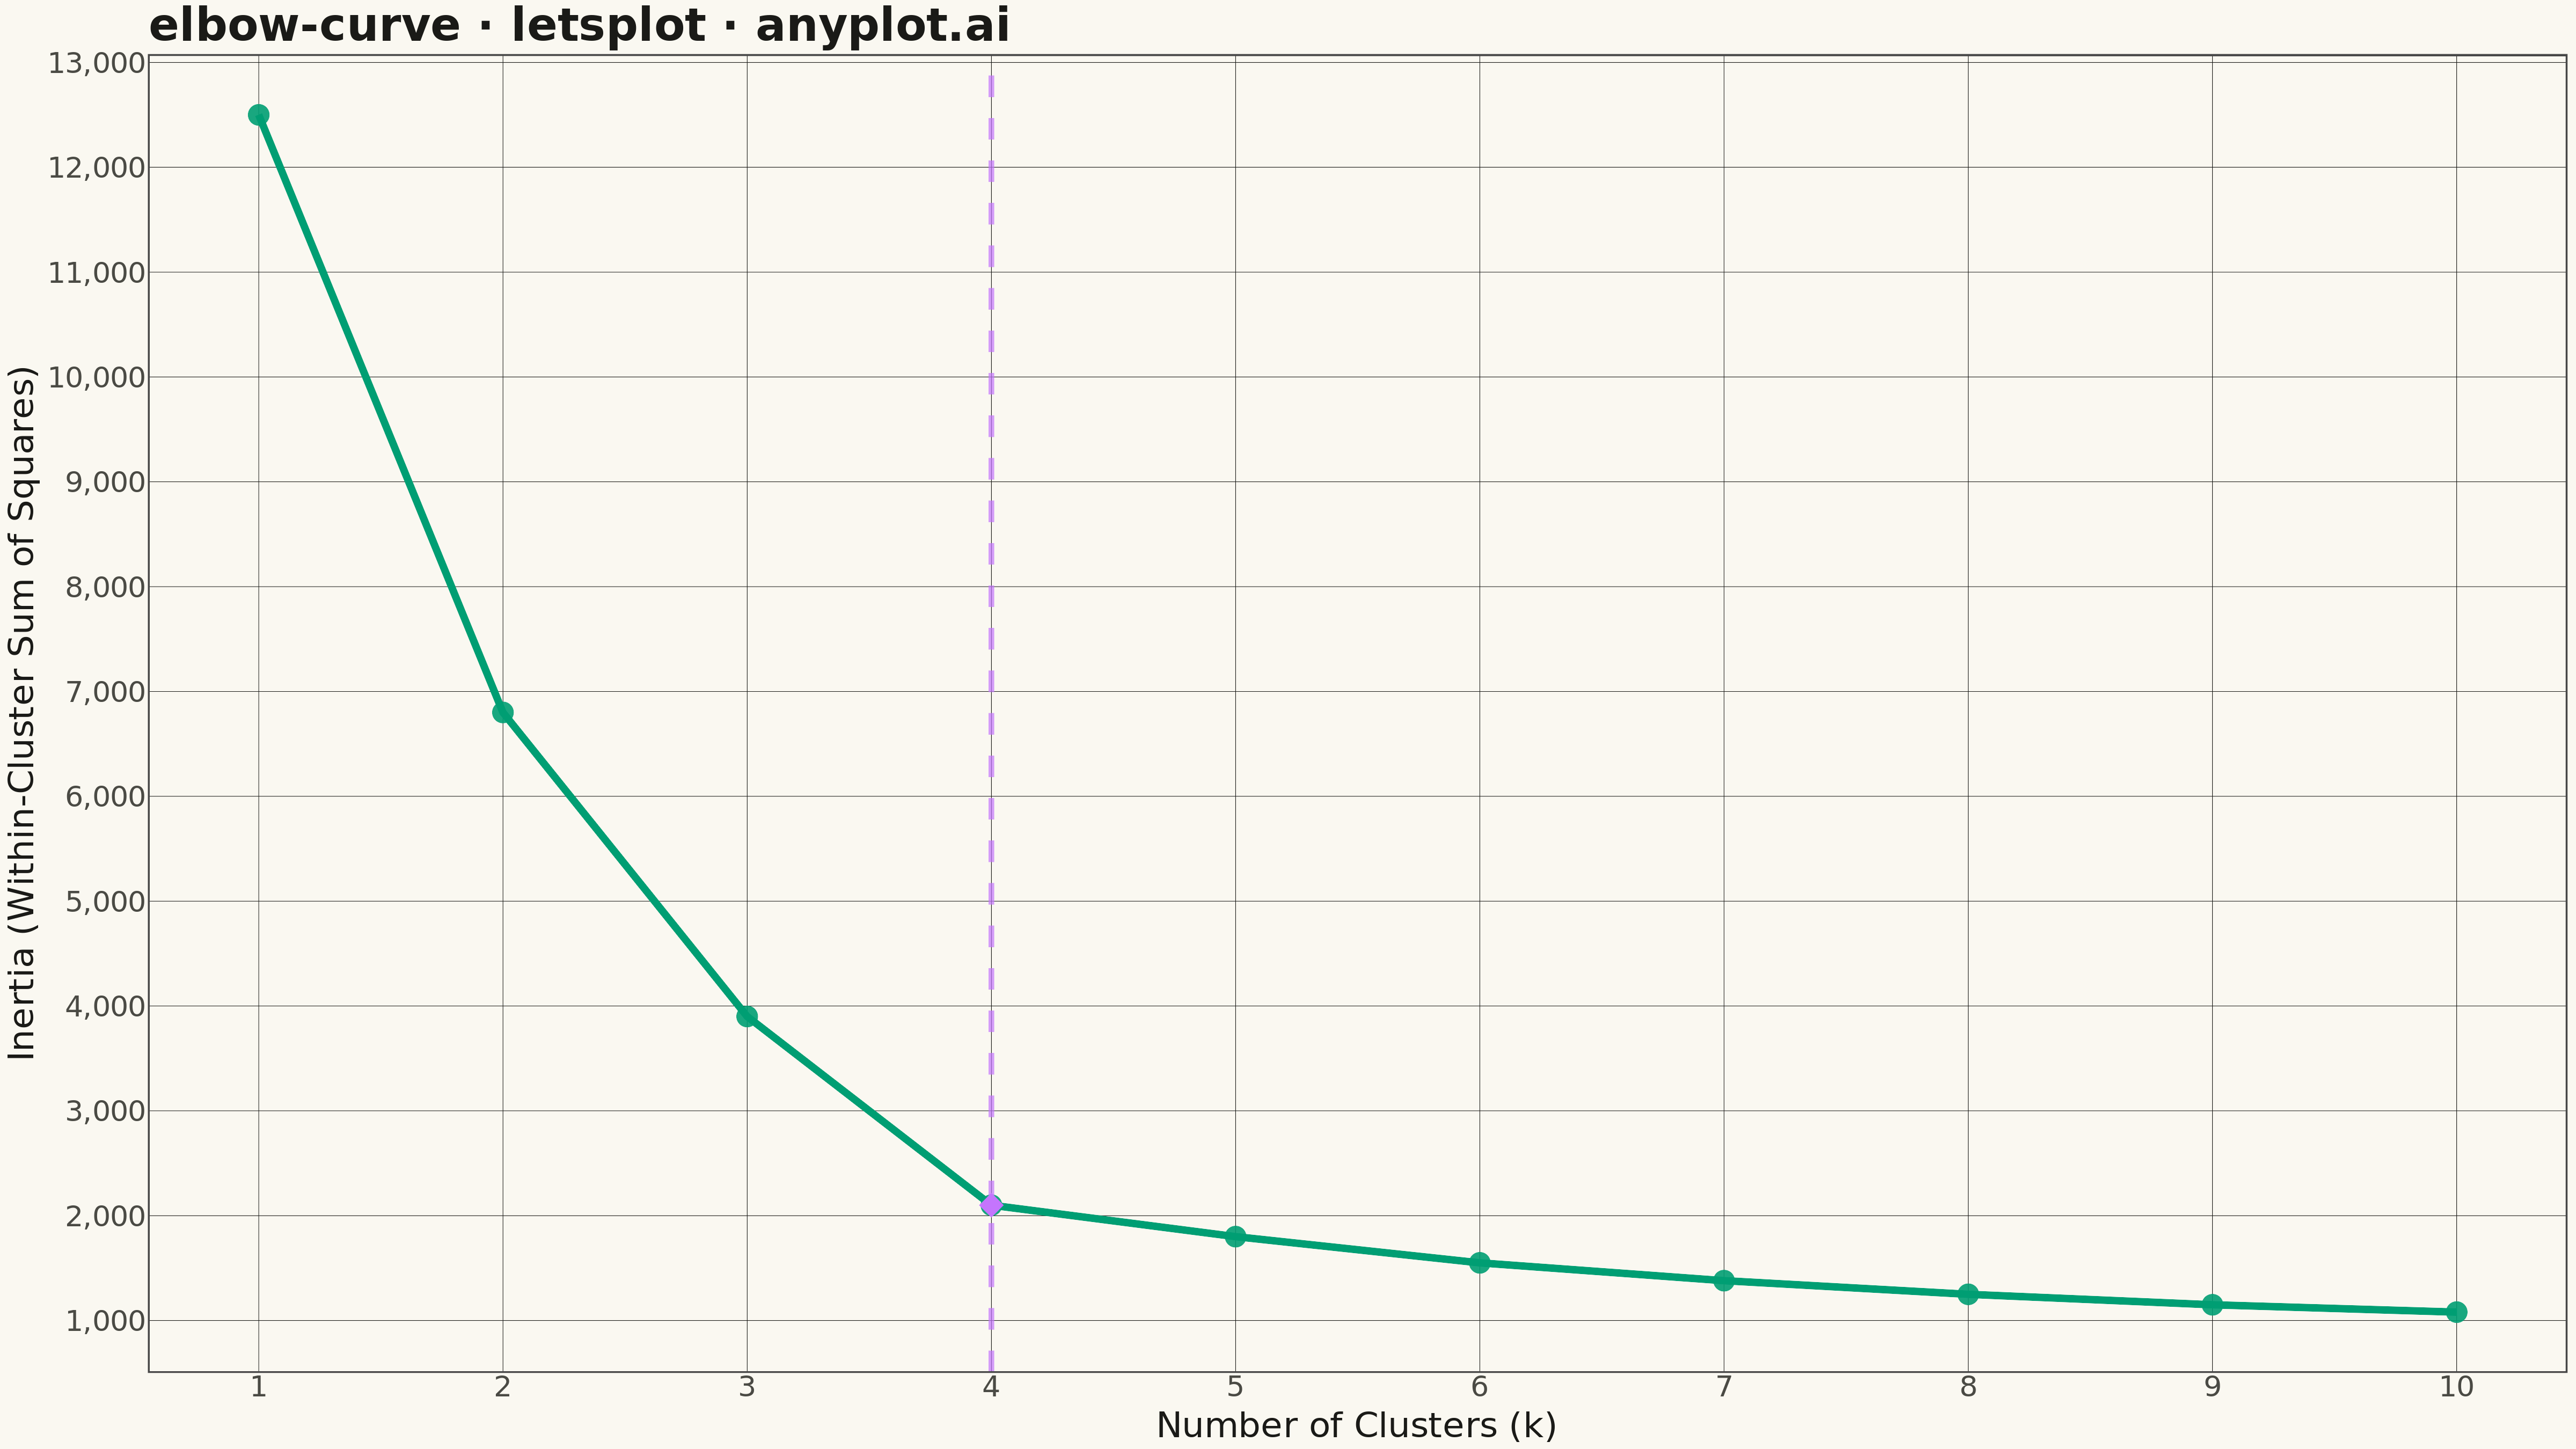
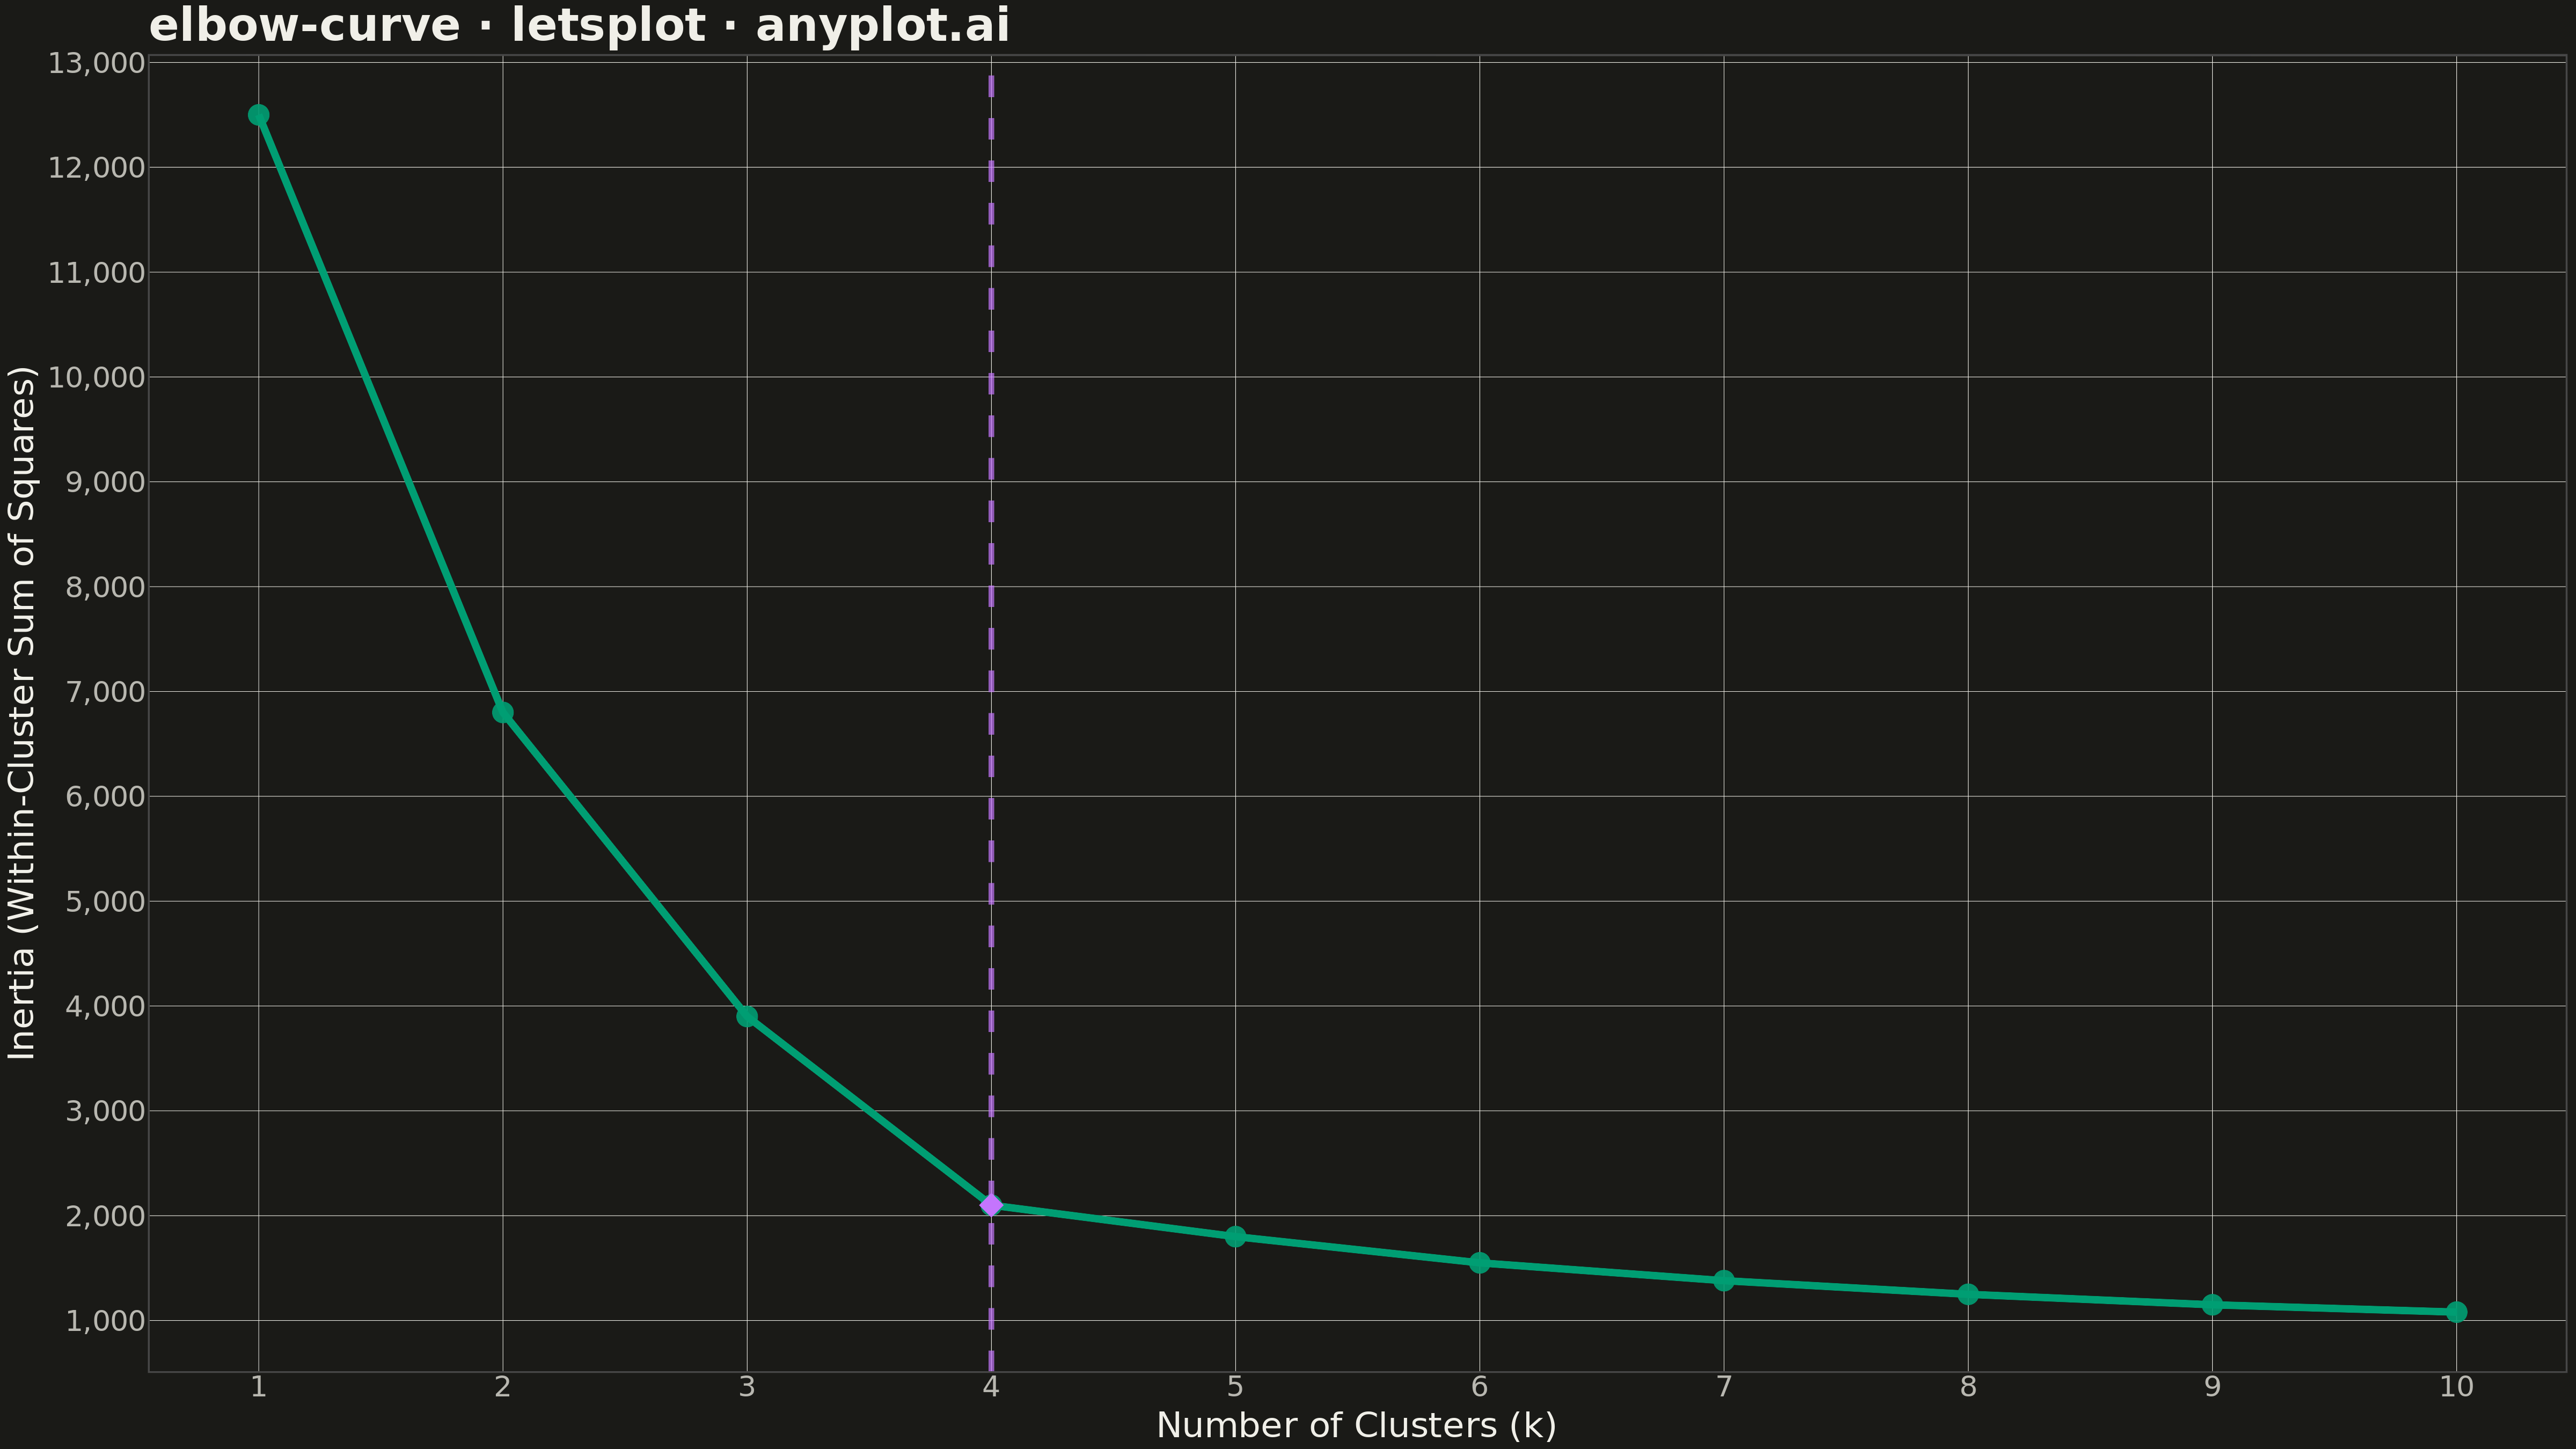
An elbow curve visualizes the relationship between the number of clusters (k) and within-cluster sum of squares (inertia/distortion) in K-means clustering. The plot helps identify the optimal number of clusters by finding the "elbow point" where adding more clusters yields diminishing returns in reducing inertia. This is a fundamental diagnostic tool for unsupervised learning parameter selection.
""" anyplot.ai
elbow-curve: Elbow Curve for K-Means Clustering
Library: letsplot 4.9.0 | Python 3.13.13
Quality: 91/100 | Updated: 2026-05-10
"""

import os

import numpy as np
import pandas as pd
from lets_plot import *


LetsPlot.setup_html()

THEME = os.getenv("ANYPLOT_THEME", "light")
PAGE_BG = "#FAF8F1" if THEME == "light" else "#1A1A17"
ELEVATED_BG = "#FFFDF6" if THEME == "light" else "#242420"
INK = "#1A1A17" if THEME == "light" else "#F0EFE8"
INK_SOFT = "#4A4A44" if THEME == "light" else "#B8B7B0"
BRAND = "#009E73"
ACCENT = "#C475FD"

# Simulated K-means inertia values showing typical elbow curve pattern
# Data represents clustering analysis on customer segmentation dataset
np.random.seed(42)

k_values = list(range(1, 11))

# Realistic inertia values that show clear elbow at k=4
# Inertia decreases sharply until k=4, then diminishing returns
inertias = [
    12500,  # k=1: all points in one cluster
    6800,  # k=2: significant drop
    3900,  # k=3: still improving
    2100,  # k=4: elbow point (optimal)
    1800,  # k=5: diminishing returns start
    1550,  # k=6
    1380,  # k=7
    1250,  # k=8
    1150,  # k=9
    1080,  # k=10
]

# Create DataFrame for plotting
df = pd.DataFrame({"k": k_values, "Inertia": inertias})

# Optimal k (elbow point)
optimal_k = 4

# Create elbow curve plot
plot = (
    ggplot(df, aes(x="k", y="Inertia"))
    + geom_line(size=2, color=BRAND)
    + geom_point(size=6, color=BRAND, alpha=0.9)
    + geom_point(data=df[df["k"] == optimal_k], mapping=aes(x="k", y="Inertia"), size=10, color=ACCENT, shape=18)
    + geom_vline(xintercept=optimal_k, linetype="dashed", color=ACCENT, size=1.5, alpha=0.7)
    + labs(
        title="elbow-curve · letsplot · anyplot.ai",
        x="Number of Clusters (k)",
        y="Inertia (Within-Cluster Sum of Squares)",
    )
    + scale_x_continuous(breaks=k_values)
    + theme_minimal()
    + theme(
        plot_background=element_rect(fill=PAGE_BG, color=PAGE_BG),
        panel_background=element_rect(fill=PAGE_BG),
        panel_grid_major=element_line(color=INK, size=0.3, linetype="solid"),
        panel_grid_minor=element_blank(),
        plot_title=element_text(size=28, face="bold", color=INK),
        axis_title=element_text(size=22, color=INK),
        axis_text=element_text(size=18, color=INK_SOFT),
        axis_line=element_line(color=INK_SOFT, size=0.5),
    )
    + ggsize(1600, 900)
)

# Save as PNG (scale 3x for 4800x2700)
ggsave(plot, f"plot-{THEME}.png", path=".", scale=3)

# Save interactive HTML
ggsave(plot, f"plot-{THEME}.html", path=".")
Runnable source as JSON, for any HTTP client: https://api.anyplot.ai/specs/elbow-curve/letsplot/code. Any spec id and library id listed in llms-full.txt fit the same URL shape; every URL below is complete and callable.
{
  "spec_id": "elbow-curve",
  "language": "python",
  "library": "letsplot",
  "page": "https://anyplot.ai/elbow-curve/python/letsplot",
  "hub": "https://anyplot.ai/elbow-curve",
  "code_json": "https://api.anyplot.ai/specs/elbow-curve/letsplot/code",
  "spec_json": "https://api.anyplot.ai/specs/elbow-curve",
  "render_light_png": "https://storage.googleapis.com/anyplot-images/plots/elbow-curve/python/letsplot/plot-light.png",
  "render_dark_png": "https://storage.googleapis.com/anyplot-images/plots/elbow-curve/python/letsplot/plot-dark.png",
  "interactive_light_html": "https://storage.googleapis.com/anyplot-images/plots/elbow-curve/python/letsplot/plot-light.html",
  "interactive_dark_html": "https://storage.googleapis.com/anyplot-images/plots/elbow-curve/python/letsplot/plot-dark.html",
  "quality_score": 91.0,
  "license": "MIT",
  "guide": "https://anyplot.ai/llms.txt"
}
Part of Elbow Curve for K-Means Clustering on anyplot.ai.