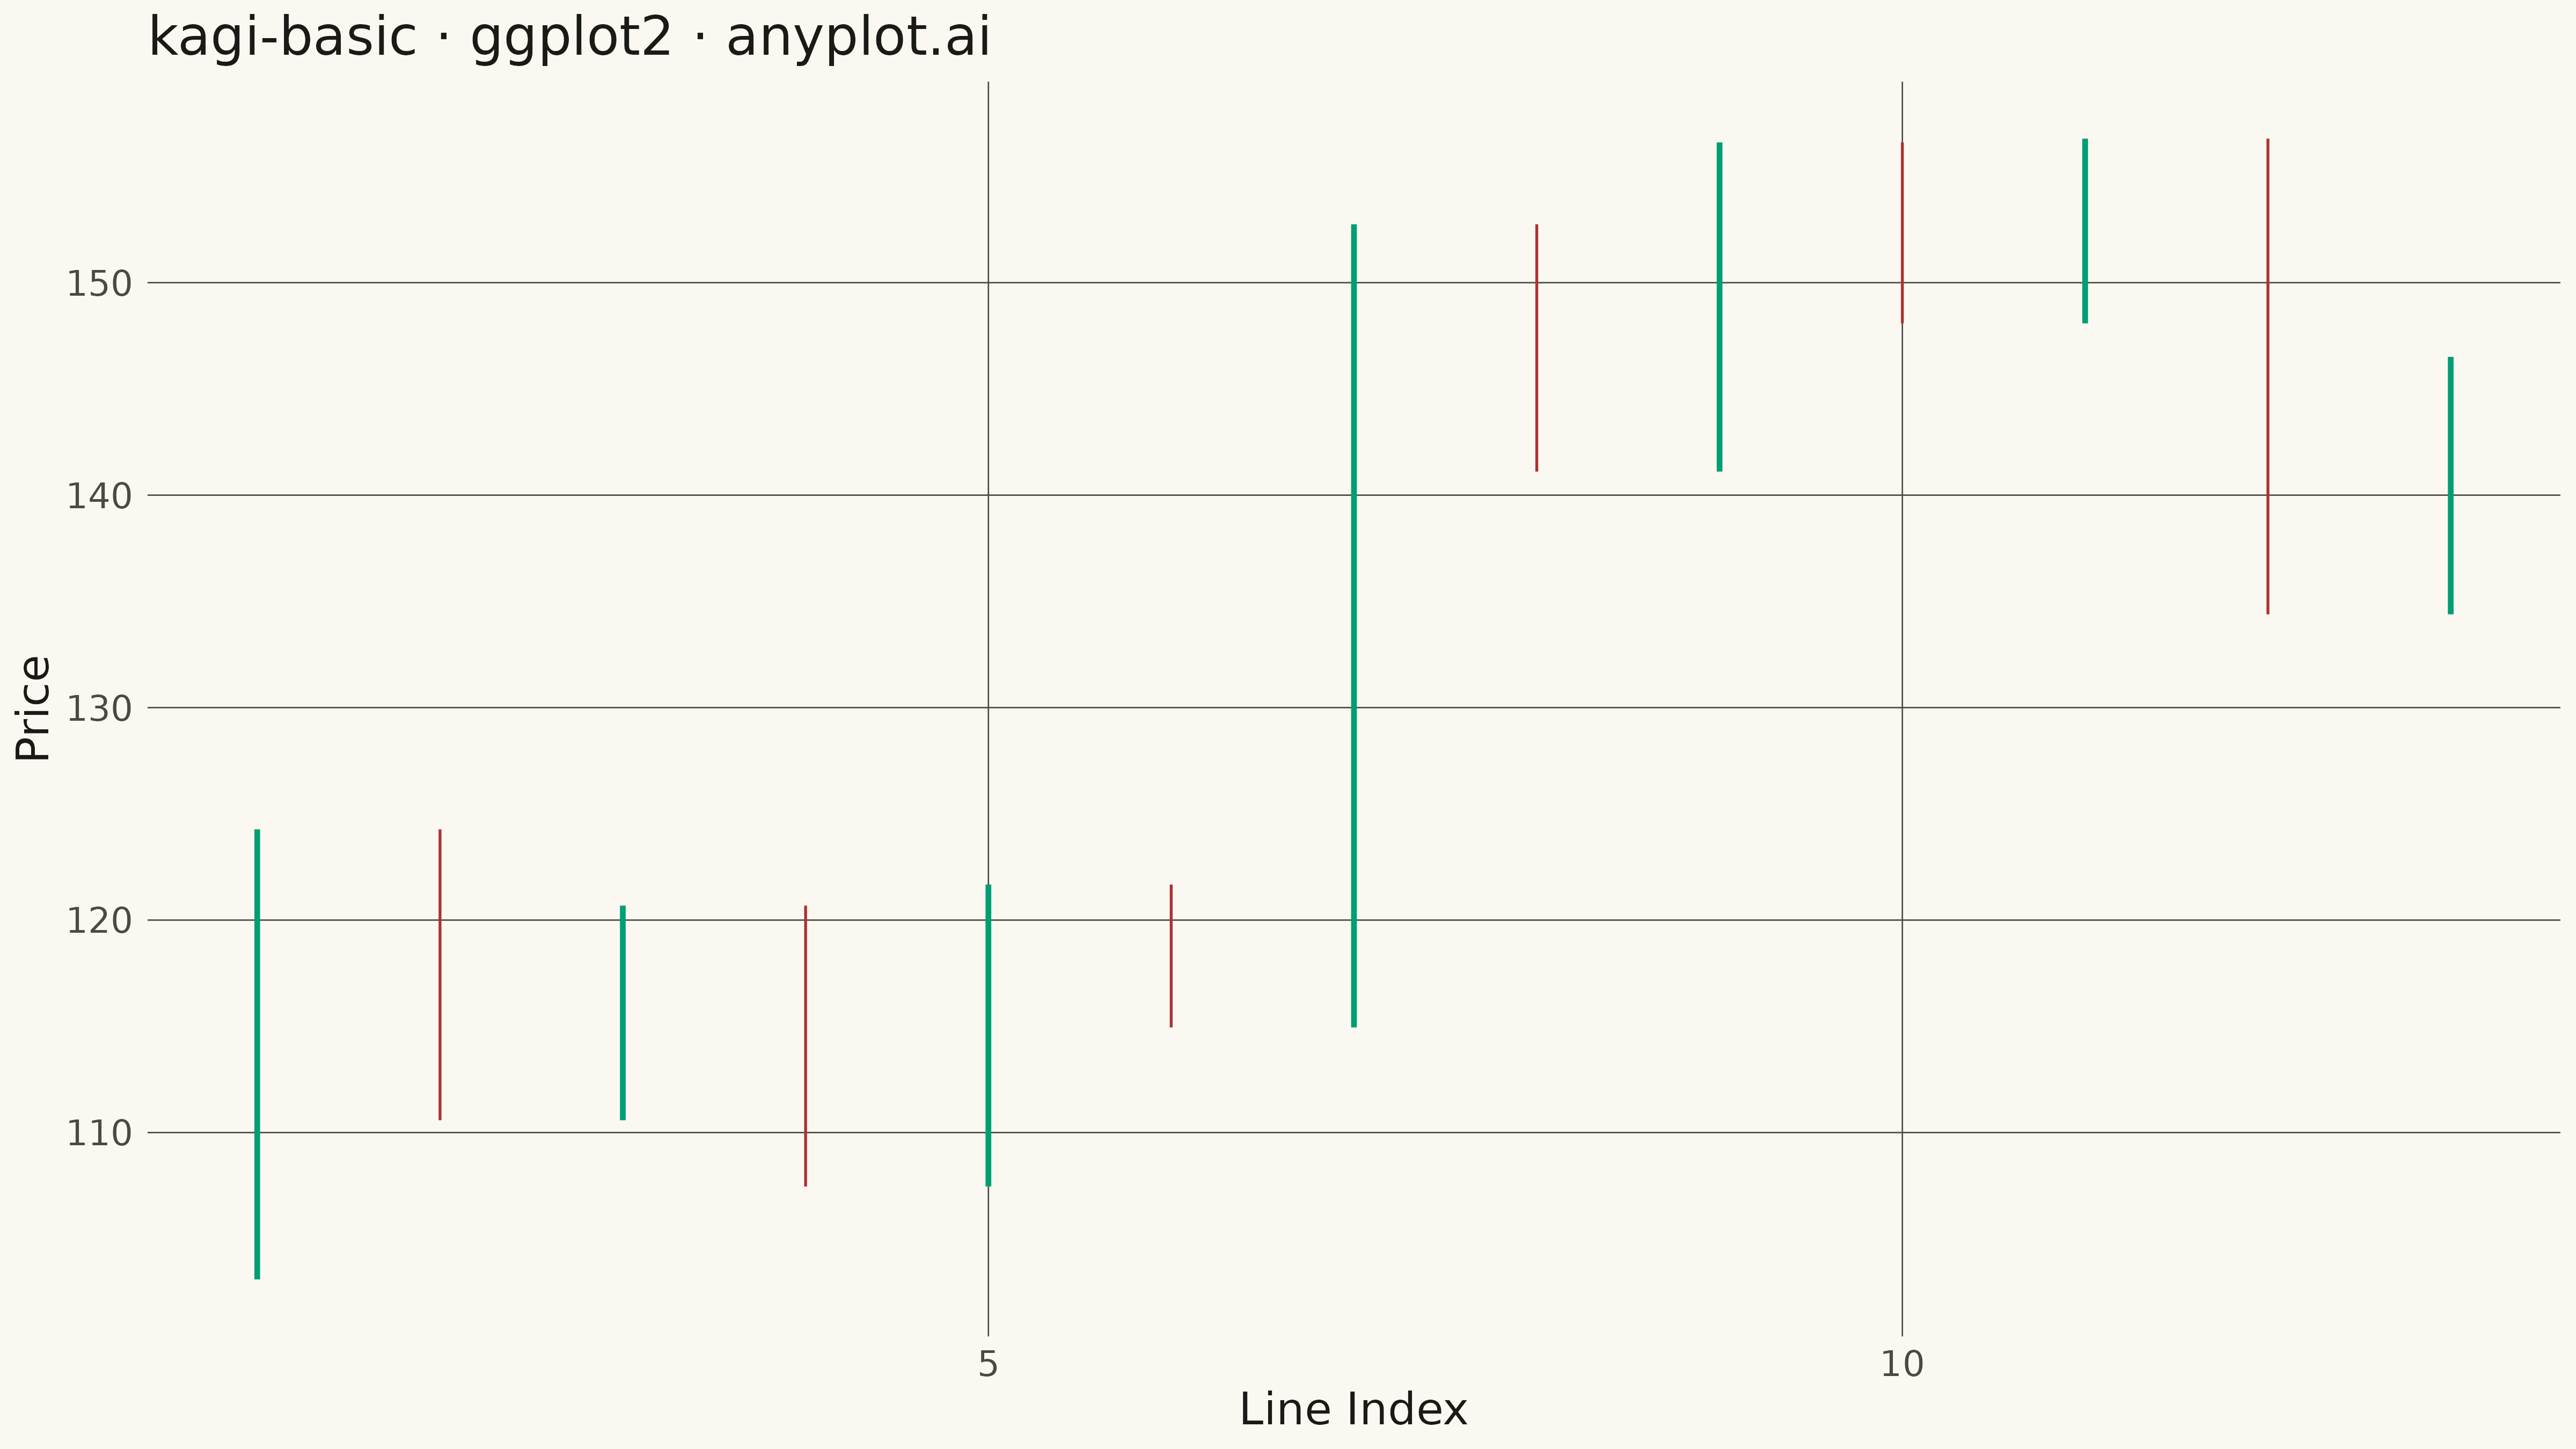
The same plot in 14 other libraries — Python: Altair, Bokeh, lets-plot, Matplotlib, Plotly, plotnine, Pygal, Seaborn; Julia: Makie.jl; JavaScript: Chart.js, D3.js, Apache ECharts, Highcharts, MUI X Charts. Compare all 15 side by side: Basic Kagi Chart in Python, R, Julia and JavaScript.
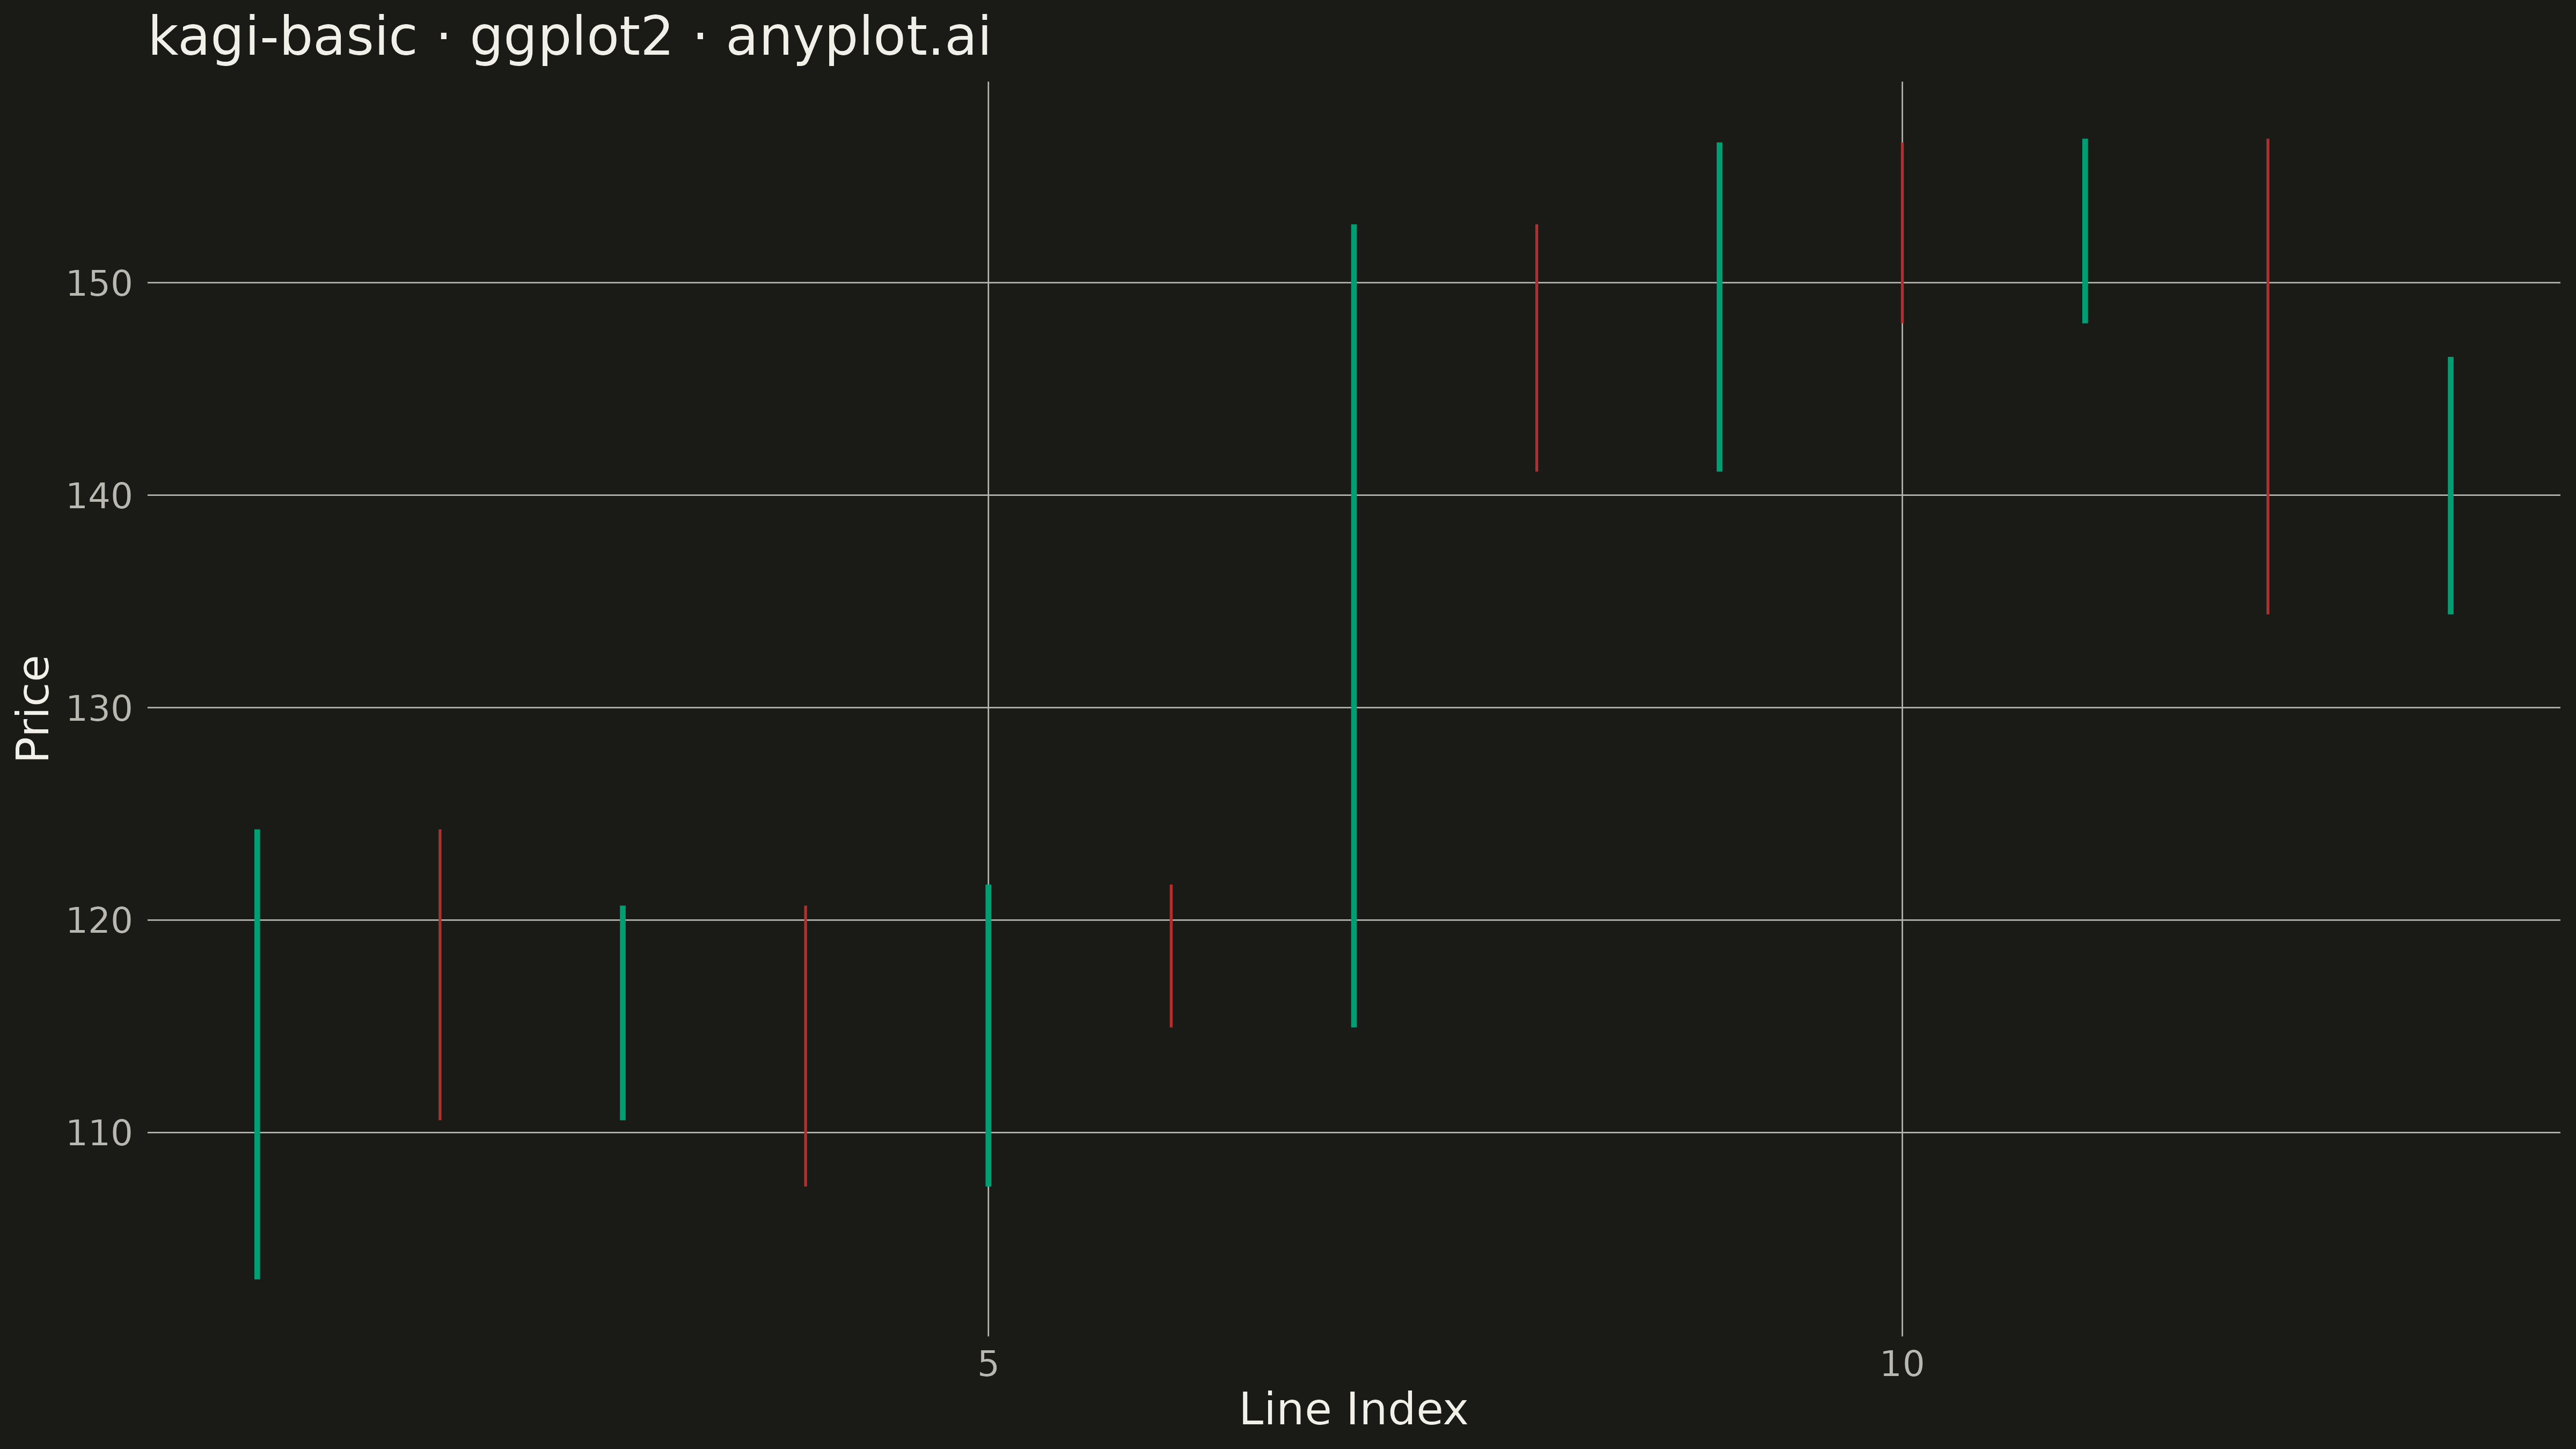
A Kagi chart is a Japanese charting technique that displays price movements using vertical lines of varying thickness. Unlike time-based charts, Kagi charts change direction only when price moves by a significant amount (the reversal threshold), effectively filtering out market noise. Thick lines (yang) indicate uptrends when price exceeds previous highs, while thin lines (yin) show downtrends when price falls below previous lows, making trend identification intuitive.
#' anyplot.ai
#' kagi-basic: Basic Kagi Chart
#' Library: ggplot2 3.5.1 | R 4.4.1
#' Quality: 95/100 | Created: 2026-05-17

library(ggplot2)
library(dplyr)
library(tibble)
library(ragg)

set.seed(42)

# --- Theme tokens -----------------------------------------------------------
THEME       <- Sys.getenv("ANYPLOT_THEME", "light")
PAGE_BG     <- if (THEME == "light") "#FAF8F1" else "#1A1A17"
INK         <- if (THEME == "light") "#1A1A17" else "#F0EFE8"
INK_SOFT    <- if (THEME == "light") "#4A4A44" else "#B8B7B0"

# Kagi-specific colors: yang (uptrend) uses brand green, yin (downtrend) uses vermillion
COLOR_YANG  <- "#009E73"  # Okabe-Ito position 1 — uptrend
COLOR_YIN   <- "#AE3030"  # imprint red — downtrend

# --- Generate price data -----------------------------------------------------
# Daily closing prices over ~6 months with realistic volatility
n_days <- 150
dates <- seq(as.Date("2025-10-01"), by = "day", length.out = n_days)

# Random walk with slight upward drift
price_changes <- rnorm(n_days, mean = 0.003, sd = 0.02)
prices <- 100 * exp(cumsum(price_changes))

df_raw <- tibble::tibble(
  date = dates,
  close = prices
)

# --- Calculate Kagi segments -------------------------------------------------
# Reversal threshold: 4% of current price
reversal_pct <- 0.04

kagi_data <- list()
line_idx <- 0
direction <- NA  # "up" or "down"
line_start_idx <- 1
line_start_price <- df_raw$close[1]
last_reversal_price <- df_raw$close[1]

for (i in 2:nrow(df_raw)) {
  price <- df_raw$close[i]

  # Determine trend direction based on reversal threshold
  if (is.na(direction)) {
    # Initial direction: assume uptrend if price goes up
    if (price > line_start_price * (1 + reversal_pct)) {
      direction <- "up"
      last_reversal_price <- line_start_price
    } else if (price < line_start_price * (1 - reversal_pct)) {
      direction <- "down"
      last_reversal_price <- line_start_price
    }
  } else if (direction == "up") {
    # In uptrend, check if price reverses down
    if (price < last_reversal_price * (1 - reversal_pct)) {
      # Reversal: end current up line, start down line
      line_idx <- line_idx + 1
      kagi_data[[line_idx]] <- tibble::tibble(
        line_id = line_idx,
        line_num = line_idx,
        price_start = line_start_price,
        price_end = last_reversal_price,
        idx_start = line_start_idx,
        idx_end = i - 1,
        trend = "up"
      )

      direction <- "down"
      line_start_price <- last_reversal_price
      line_start_idx <- i - 1
      last_reversal_price <- price
    } else if (price > last_reversal_price) {
      # Continue up, update high
      last_reversal_price <- price
    }
  } else {  # direction == "down"
    # In downtrend, check if price reverses up
    if (price > last_reversal_price * (1 + reversal_pct)) {
      # Reversal: end current down line, start up line
      line_idx <- line_idx + 1
      kagi_data[[line_idx]] <- tibble::tibble(
        line_id = line_idx,
        line_num = line_idx,
        price_start = line_start_price,
        price_end = last_reversal_price,
        idx_start = line_start_idx,
        idx_end = i - 1,
        trend = "down"
      )

      direction <- "up"
      line_start_price <- last_reversal_price
      line_start_idx <- i - 1
      last_reversal_price <- price
    } else if (price < last_reversal_price) {
      # Continue down, update low
      last_reversal_price <- price
    }
  }
}

# Add final segment
if (!is.na(direction)) {
  line_idx <- line_idx + 1
  kagi_data[[line_idx]] <- tibble::tibble(
    line_id = line_idx,
    line_num = line_idx,
    price_start = line_start_price,
    price_end = last_reversal_price,
    idx_start = line_start_idx,
    idx_end = nrow(df_raw),
    trend = direction
  )
}

kagi_df <- bind_rows(kagi_data)

# --- Create line segments for plotting ----------------------------------------
segments <- list()
seg_idx <- 1

for (i in 1:nrow(kagi_df)) {
  segment <- kagi_df[i, ]

  # Create vertical line segment
  segments[[seg_idx]] <- tibble::tibble(
    x = segment$line_num,
    y_start = segment$price_start,
    y_end = segment$price_end,
    trend = segment$trend,
    color = if_else(segment$trend == "up", COLOR_YANG, COLOR_YIN),
    width = if_else(segment$trend == "up", 1.2, 0.6)
  )

  seg_idx <- seg_idx + 1

  # Add horizontal segment (shoulder/waist) connecting to next line
  if (i < nrow(kagi_df)) {
    next_start <- kagi_df$price_start[i + 1]
    segments[[seg_idx]] <- tibble::tibble(
      x = c(segment$line_num, segment$line_num + 0.5),
      y_start = c(segment$price_end, segment$price_end),
      y_end = c(segment$price_end, segment$price_end),
      trend = NA,
      color = INK_SOFT,
      width = 0.3
    )
    seg_idx <- seg_idx + 1
  }
}

# --- Plot -------------------------------------------------------------------
# Build base data for geom_segment calls
plot_lines <- list()

# Draw vertical lines
for (i in 1:nrow(kagi_df)) {
  segment <- kagi_df[i, ]
  color <- if_else(segment$trend == "up", COLOR_YANG, COLOR_YIN)
  width <- if_else(segment$trend == "up", 1.2, 0.6)

  plot_lines[[i]] <- tibble::tibble(
    x = segment$line_num,
    xend = segment$line_num,
    y = segment$price_start,
    yend = segment$price_end,
    trend = segment$trend,
    color = color,
    linewidth = width
  )
}

plot_data <- bind_rows(plot_lines)

p <- ggplot() +
  geom_segment(
    data = plot_data,
    aes(x = x, xend = xend, y = y, yend = yend, color = trend, linewidth = trend),
    show.legend = FALSE
  ) +
  scale_color_manual(values = c("up" = COLOR_YANG, "down" = COLOR_YIN)) +
  scale_linewidth_manual(values = c("up" = 1.2, "down" = 0.6)) +
  labs(
    title = "kagi-basic · ggplot2 · anyplot.ai",
    x = "Line Index",
    y = "Price"
  ) +
  theme_minimal(base_size = 14) +
  theme(
    plot.background = element_rect(fill = PAGE_BG, color = PAGE_BG),
    panel.background = element_rect(fill = PAGE_BG, color = NA),
    panel.grid.major = element_line(color = INK_SOFT, linewidth = 0.3),
    panel.grid.minor = element_blank(),
    axis.title = element_text(color = INK, size = 20),
    axis.text = element_text(color = INK_SOFT, size = 16),
    plot.title = element_text(color = INK, size = 24, face = "plain")
  )

# --- Save -------------------------------------------------------------------
ggsave(
  filename = sprintf("plot-%s.png", THEME),
  plot = p,
  device = ragg::agg_png,
  width = 16,
  height = 9,
  units = "in",
  dpi = 300
)
Runnable source as JSON, for any HTTP client: https://api.anyplot.ai/specs/kagi-basic/ggplot2/code. Any spec id and library id listed in llms-full.txt fit the same URL shape; every URL below is complete and callable.
{
  "spec_id": "kagi-basic",
  "language": "r",
  "library": "ggplot2",
  "page": "https://anyplot.ai/kagi-basic/r/ggplot2",
  "hub": "https://anyplot.ai/kagi-basic",
  "code_json": "https://api.anyplot.ai/specs/kagi-basic/ggplot2/code",
  "spec_json": "https://api.anyplot.ai/specs/kagi-basic",
  "render_light_png": "https://storage.googleapis.com/anyplot-images/plots/kagi-basic/r/ggplot2/plot-light.png",
  "render_dark_png": "https://storage.googleapis.com/anyplot-images/plots/kagi-basic/r/ggplot2/plot-dark.png",
  "quality_score": 95.0,
  "license": "MIT",
  "guide": "https://anyplot.ai/llms.txt"
}
Part of Basic Kagi Chart on anyplot.ai.