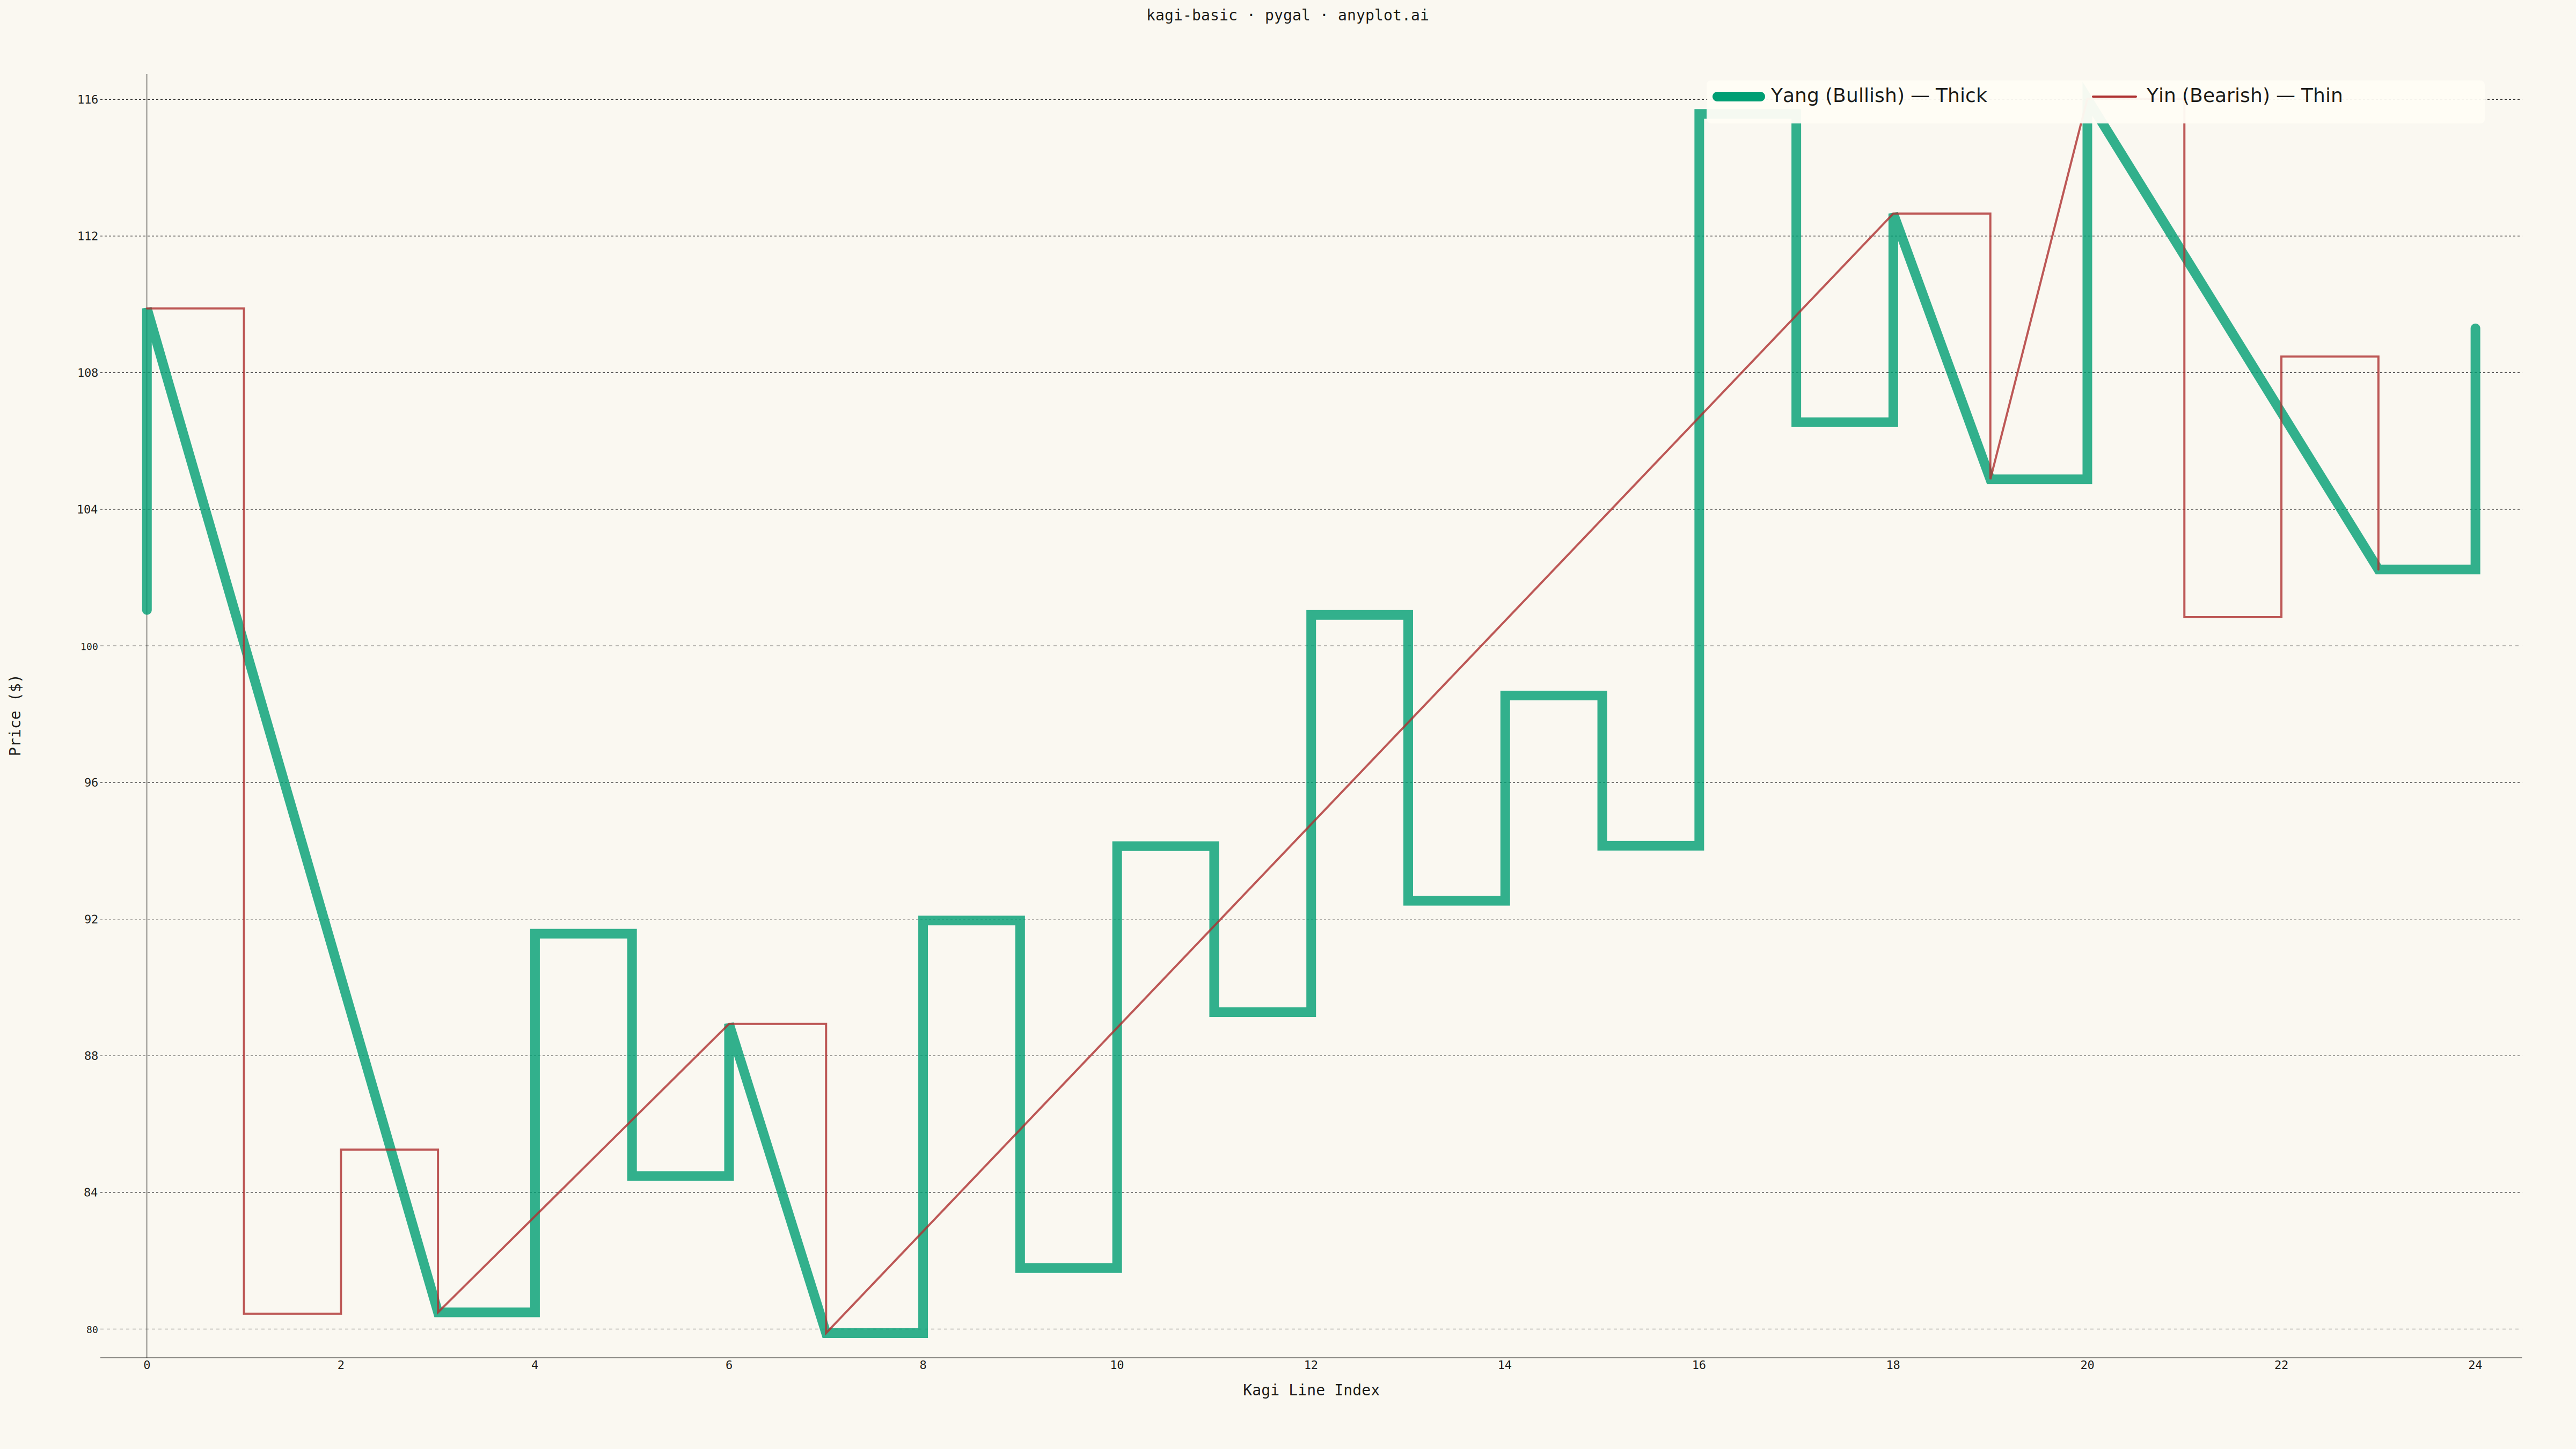
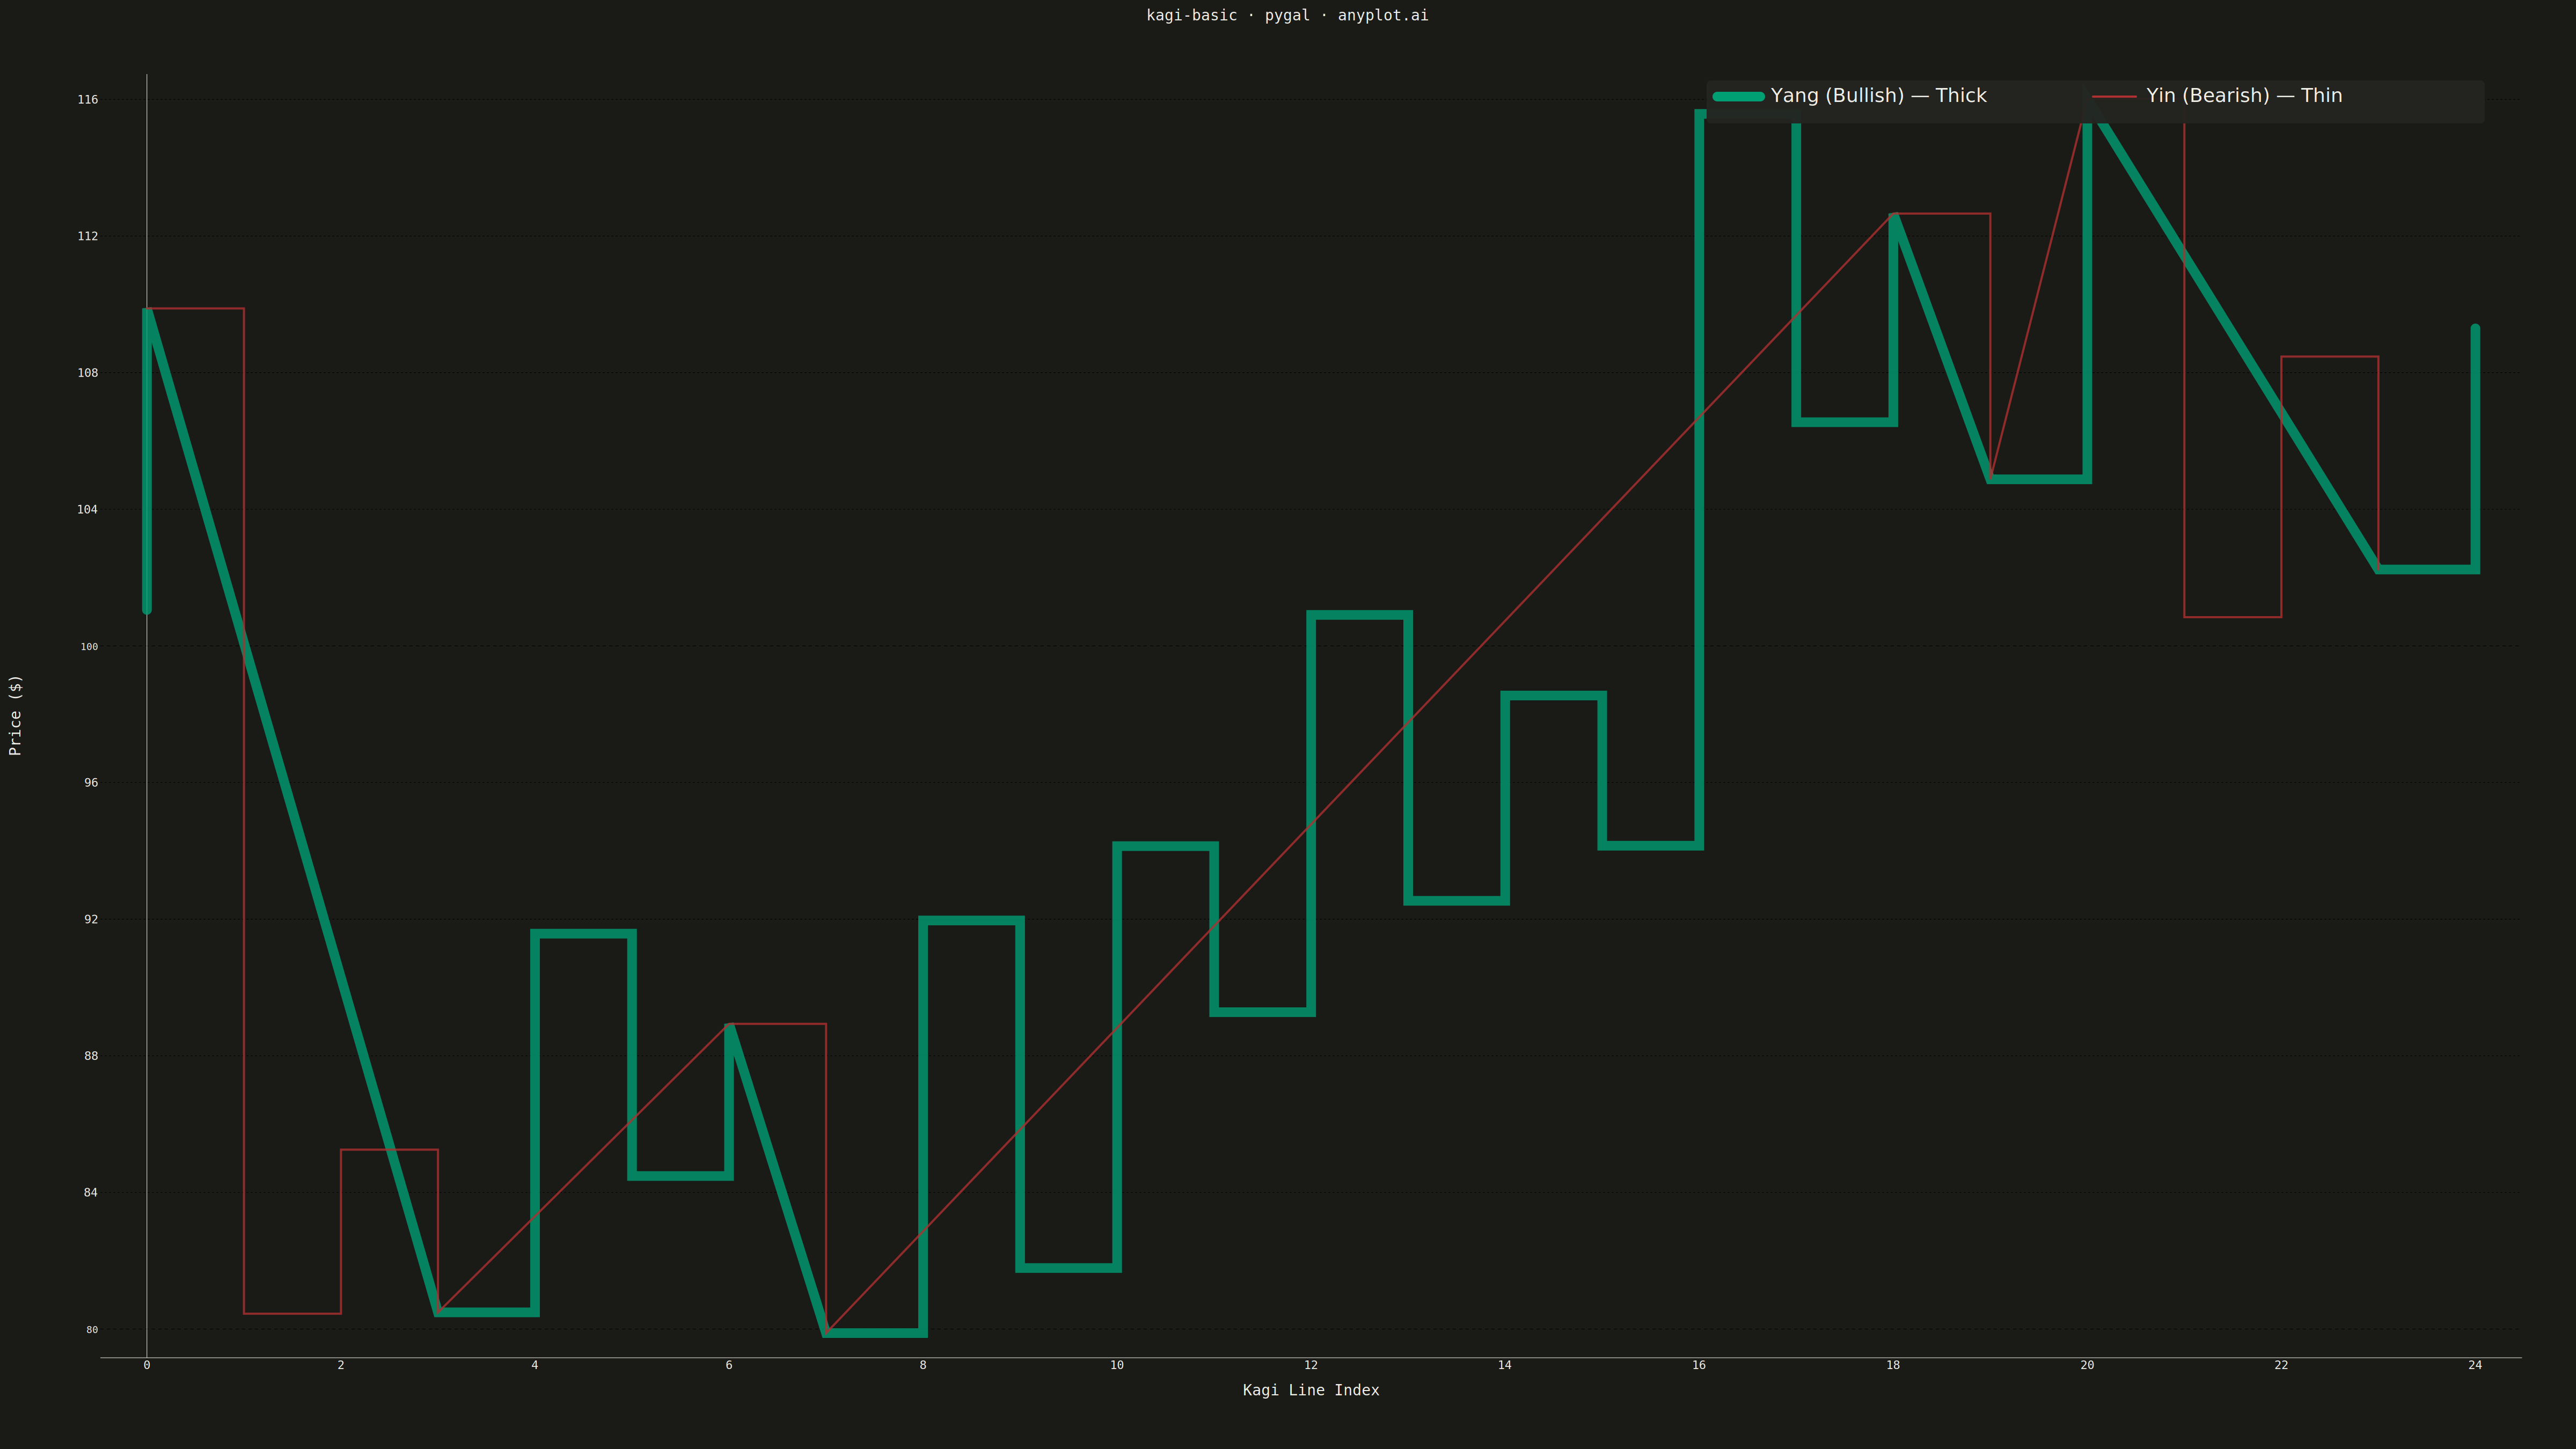
A Kagi chart is a Japanese charting technique that displays price movements using vertical lines of varying thickness. Unlike time-based charts, Kagi charts change direction only when price moves by a significant amount (the reversal threshold), effectively filtering out market noise. Thick lines (yang) indicate uptrends when price exceeds previous highs, while thin lines (yin) show downtrends when price falls below previous lows, making trend identification intuitive.
""" anyplot.ai
kagi-basic: Basic Kagi Chart
Library: pygal 3.1.0 | Python 3.13.13
Quality: 93/100 | Updated: 2026-05-17
"""

from __future__ import absolute_import

import os
import sys


# Ensure we import the pygal library, not the local script
script_dir = os.path.dirname(os.path.abspath(__file__))
sys.path = [p for p in sys.path if p != script_dir and p != ""]

import cairosvg
import numpy as np
import pygal
from pygal.style import Style


# Theme tokens
THEME = os.getenv("ANYPLOT_THEME", "light")
PAGE_BG = "#FAF8F1" if THEME == "light" else "#1A1A17"
INK = "#1A1A17" if THEME == "light" else "#F0EFE8"
INK_SOFT = "#4A4A44" if THEME == "light" else "#B8B7B0"
INK_MUTED = "#6B6A63" if THEME == "light" else "#A8A79F"

# Okabe-Ito palette - yang (bullish) uses brand green, yin (bearish) uses vermillion
YANG_COLOR = "#009E73"  # Okabe-Ito position 1 - brand green
YIN_COLOR = "#AE3030"  # imprint red — bearish
YANG_WIDTH = 18  # Thick for yang
YIN_WIDTH = 4  # Thin for yin

# Data - Generate synthetic stock price data
np.random.seed(42)
n_days = 300  # More days for richer Kagi pattern
returns = np.random.normal(0.0006, 0.02, n_days)
prices = 100 * np.cumprod(1 + returns)

# Kagi chart calculation with 4% reversal threshold
reversal_pct = 0.04

# Build Kagi chart columns
columns = []
current_direction = "up"
last_high = prices[0]
last_low = prices[0]
prev_swing_high = prices[0]
prev_swing_low = prices[0]
col_idx = 0

current_col = {"x": col_idx, "start": prices[0], "end": prices[0], "type": "yang"}

for price in prices[1:]:
    if current_direction == "up":
        if price > last_high:
            last_high = price
            current_col["end"] = price
            if price > prev_swing_high:
                current_col["type"] = "yang"
        elif price < last_high * (1 - reversal_pct):
            columns.append(current_col)
            prev_swing_high = last_high
            col_idx += 1
            is_yin = price < prev_swing_low
            current_col = {
                "x": col_idx,
                "start": columns[-1]["end"],
                "end": price,
                "type": "yin" if is_yin else columns[-1]["type"],
            }
            current_direction = "down"
            last_low = price
    else:
        if price < last_low:
            last_low = price
            current_col["end"] = price
            if price < prev_swing_low:
                current_col["type"] = "yin"
        elif price > last_low * (1 + reversal_pct):
            columns.append(current_col)
            prev_swing_low = last_low
            col_idx += 1
            is_yang = price > prev_swing_high
            current_col = {
                "x": col_idx,
                "start": columns[-1]["end"],
                "end": price,
                "type": "yang" if is_yang else columns[-1]["type"],
            }
            current_direction = "up"
            last_high = price

columns.append(current_col)

# Build individual line segments for proper Kagi rendering
yang_segments = []  # List of [(x1,y1), (x2,y2)] for yang
yin_segments = []  # List of [(x1,y1), (x2,y2)] for yin

prev_x = None
prev_y = None

for col in columns:
    x = col["x"]
    y_start = col["start"]
    y_end = col["end"]
    seg_type = col["type"]

    # Horizontal connector (shoulder/waist) from previous column
    if prev_x is not None and prev_x != x:
        h_segment = [(prev_x, prev_y), (x, prev_y)]
        if seg_type == "yang":
            yang_segments.append(h_segment)
        else:
            yin_segments.append(h_segment)

    # Vertical line segment
    v_segment = [(x, y_start), (x, y_end)]
    if seg_type == "yang":
        yang_segments.append(v_segment)
    else:
        yin_segments.append(v_segment)

    prev_x = x
    prev_y = y_end

# Custom style with theme-adaptive colors
custom_style = Style(
    background=PAGE_BG,
    plot_background=PAGE_BG,
    foreground=INK,
    foreground_strong=INK,
    foreground_subtle=INK_MUTED,
    colors=(YANG_COLOR, YIN_COLOR),
    title_font_size=28,
    label_font_size=22,
    major_label_font_size=18,
    legend_font_size=16,
    value_font_size=14,
    guide_stroke_dasharray="4,4",
    opacity=1.0,
    opacity_hover=1.0,
)

# Create XY chart
chart = pygal.XY(
    width=4800,
    height=2700,
    style=custom_style,
    title="kagi-basic · pygal · anyplot.ai",
    x_title="Kagi Line Index",
    y_title="Price ($)",
    show_dots=False,
    show_x_guides=False,
    show_y_guides=True,
    show_legend=False,
    stroke=True,
    fill=False,
    margin=100,
)

# Combine all yang segments into one series
yang_points = []
for seg in yang_segments:
    yang_points.extend(seg)
    yang_points.append((None, None))  # Break between segments

# Combine all yin segments into one series
yin_points = []
for seg in yin_segments:
    yin_points.extend(seg)
    yin_points.append((None, None))  # Break between segments

# Add as two series
chart.add("Yang (Bullish)", yang_points, stroke_style={"width": YANG_WIDTH, "linecap": "round"})
chart.add("Yin (Bearish)", yin_points, stroke_style={"width": YIN_WIDTH, "linecap": "round"})

# Render to SVG and customize
svg_data = chart.render()
svg_str = svg_data.decode("utf-8")

# CSS override to enforce stroke widths
css_override = f"""
.serie-0 .line {{ stroke-width: {YANG_WIDTH}px !important; stroke: {YANG_COLOR} !important; }}
.serie-1 .line {{ stroke-width: {YIN_WIDTH}px !important; stroke: {YIN_COLOR} !important; }}
"""
svg_str = svg_str.replace("</style>", css_override + "</style>")

# Manual legend showing line styles
legend_bg = "#FFFDF6" if THEME == "light" else "#242420"
legend_svg = f"""
<g class="manual-legend" transform="translate(3200, 180)">
  <rect x="-20" y="-30" width="1450" height="80" fill="{legend_bg}" fill-opacity="0.95" rx="8"/>
  <line x1="0" y1="0" x2="80" y2="0" stroke="{YANG_COLOR}" stroke-width="{YANG_WIDTH}" stroke-linecap="round"/>
  <text x="100" y="10" font-size="36" fill="{INK}" font-family="Verdana, sans-serif">Yang (Bullish) — Thick</text>
  <line x1="700" y1="0" x2="780" y2="0" stroke="{YIN_COLOR}" stroke-width="{YIN_WIDTH}" stroke-linecap="round"/>
  <text x="800" y="10" font-size="36" fill="{INK}" font-family="Verdana, sans-serif">Yin (Bearish) — Thin</text>
</g>
"""

svg_str = svg_str.replace("</svg>", legend_svg + "</svg>")

# Save to script directory
script_dir = os.path.dirname(os.path.abspath(__file__))

# Convert to PNG with theme-suffixed filename
png_path = os.path.join(script_dir, f"plot-{THEME}.png")
cairosvg.svg2png(bytestring=svg_str.encode("utf-8"), write_to=png_path)

# Save HTML version with theme-suffixed filename
html_path = os.path.join(script_dir, f"plot-{THEME}.html")
chart.render_to_file(html_path)
Runnable source as JSON, for any HTTP client: https://api.anyplot.ai/specs/kagi-basic/pygal/code. Any spec id and library id listed in llms-full.txt fit the same URL shape; every URL below is complete and callable.
{
  "spec_id": "kagi-basic",
  "language": "python",
  "library": "pygal",
  "page": "https://anyplot.ai/kagi-basic/python/pygal",
  "hub": "https://anyplot.ai/kagi-basic",
  "code_json": "https://api.anyplot.ai/specs/kagi-basic/pygal/code",
  "spec_json": "https://api.anyplot.ai/specs/kagi-basic",
  "render_light_png": "https://storage.googleapis.com/anyplot-images/plots/kagi-basic/python/pygal/plot-light.png",
  "render_dark_png": "https://storage.googleapis.com/anyplot-images/plots/kagi-basic/python/pygal/plot-dark.png",
  "interactive_light_html": "https://storage.googleapis.com/anyplot-images/plots/kagi-basic/python/pygal/plot-light.html",
  "interactive_dark_html": "https://storage.googleapis.com/anyplot-images/plots/kagi-basic/python/pygal/plot-dark.html",
  "quality_score": 93.0,
  "license": "MIT",
  "guide": "https://anyplot.ai/llms.txt"
}
Part of Basic Kagi Chart on anyplot.ai.