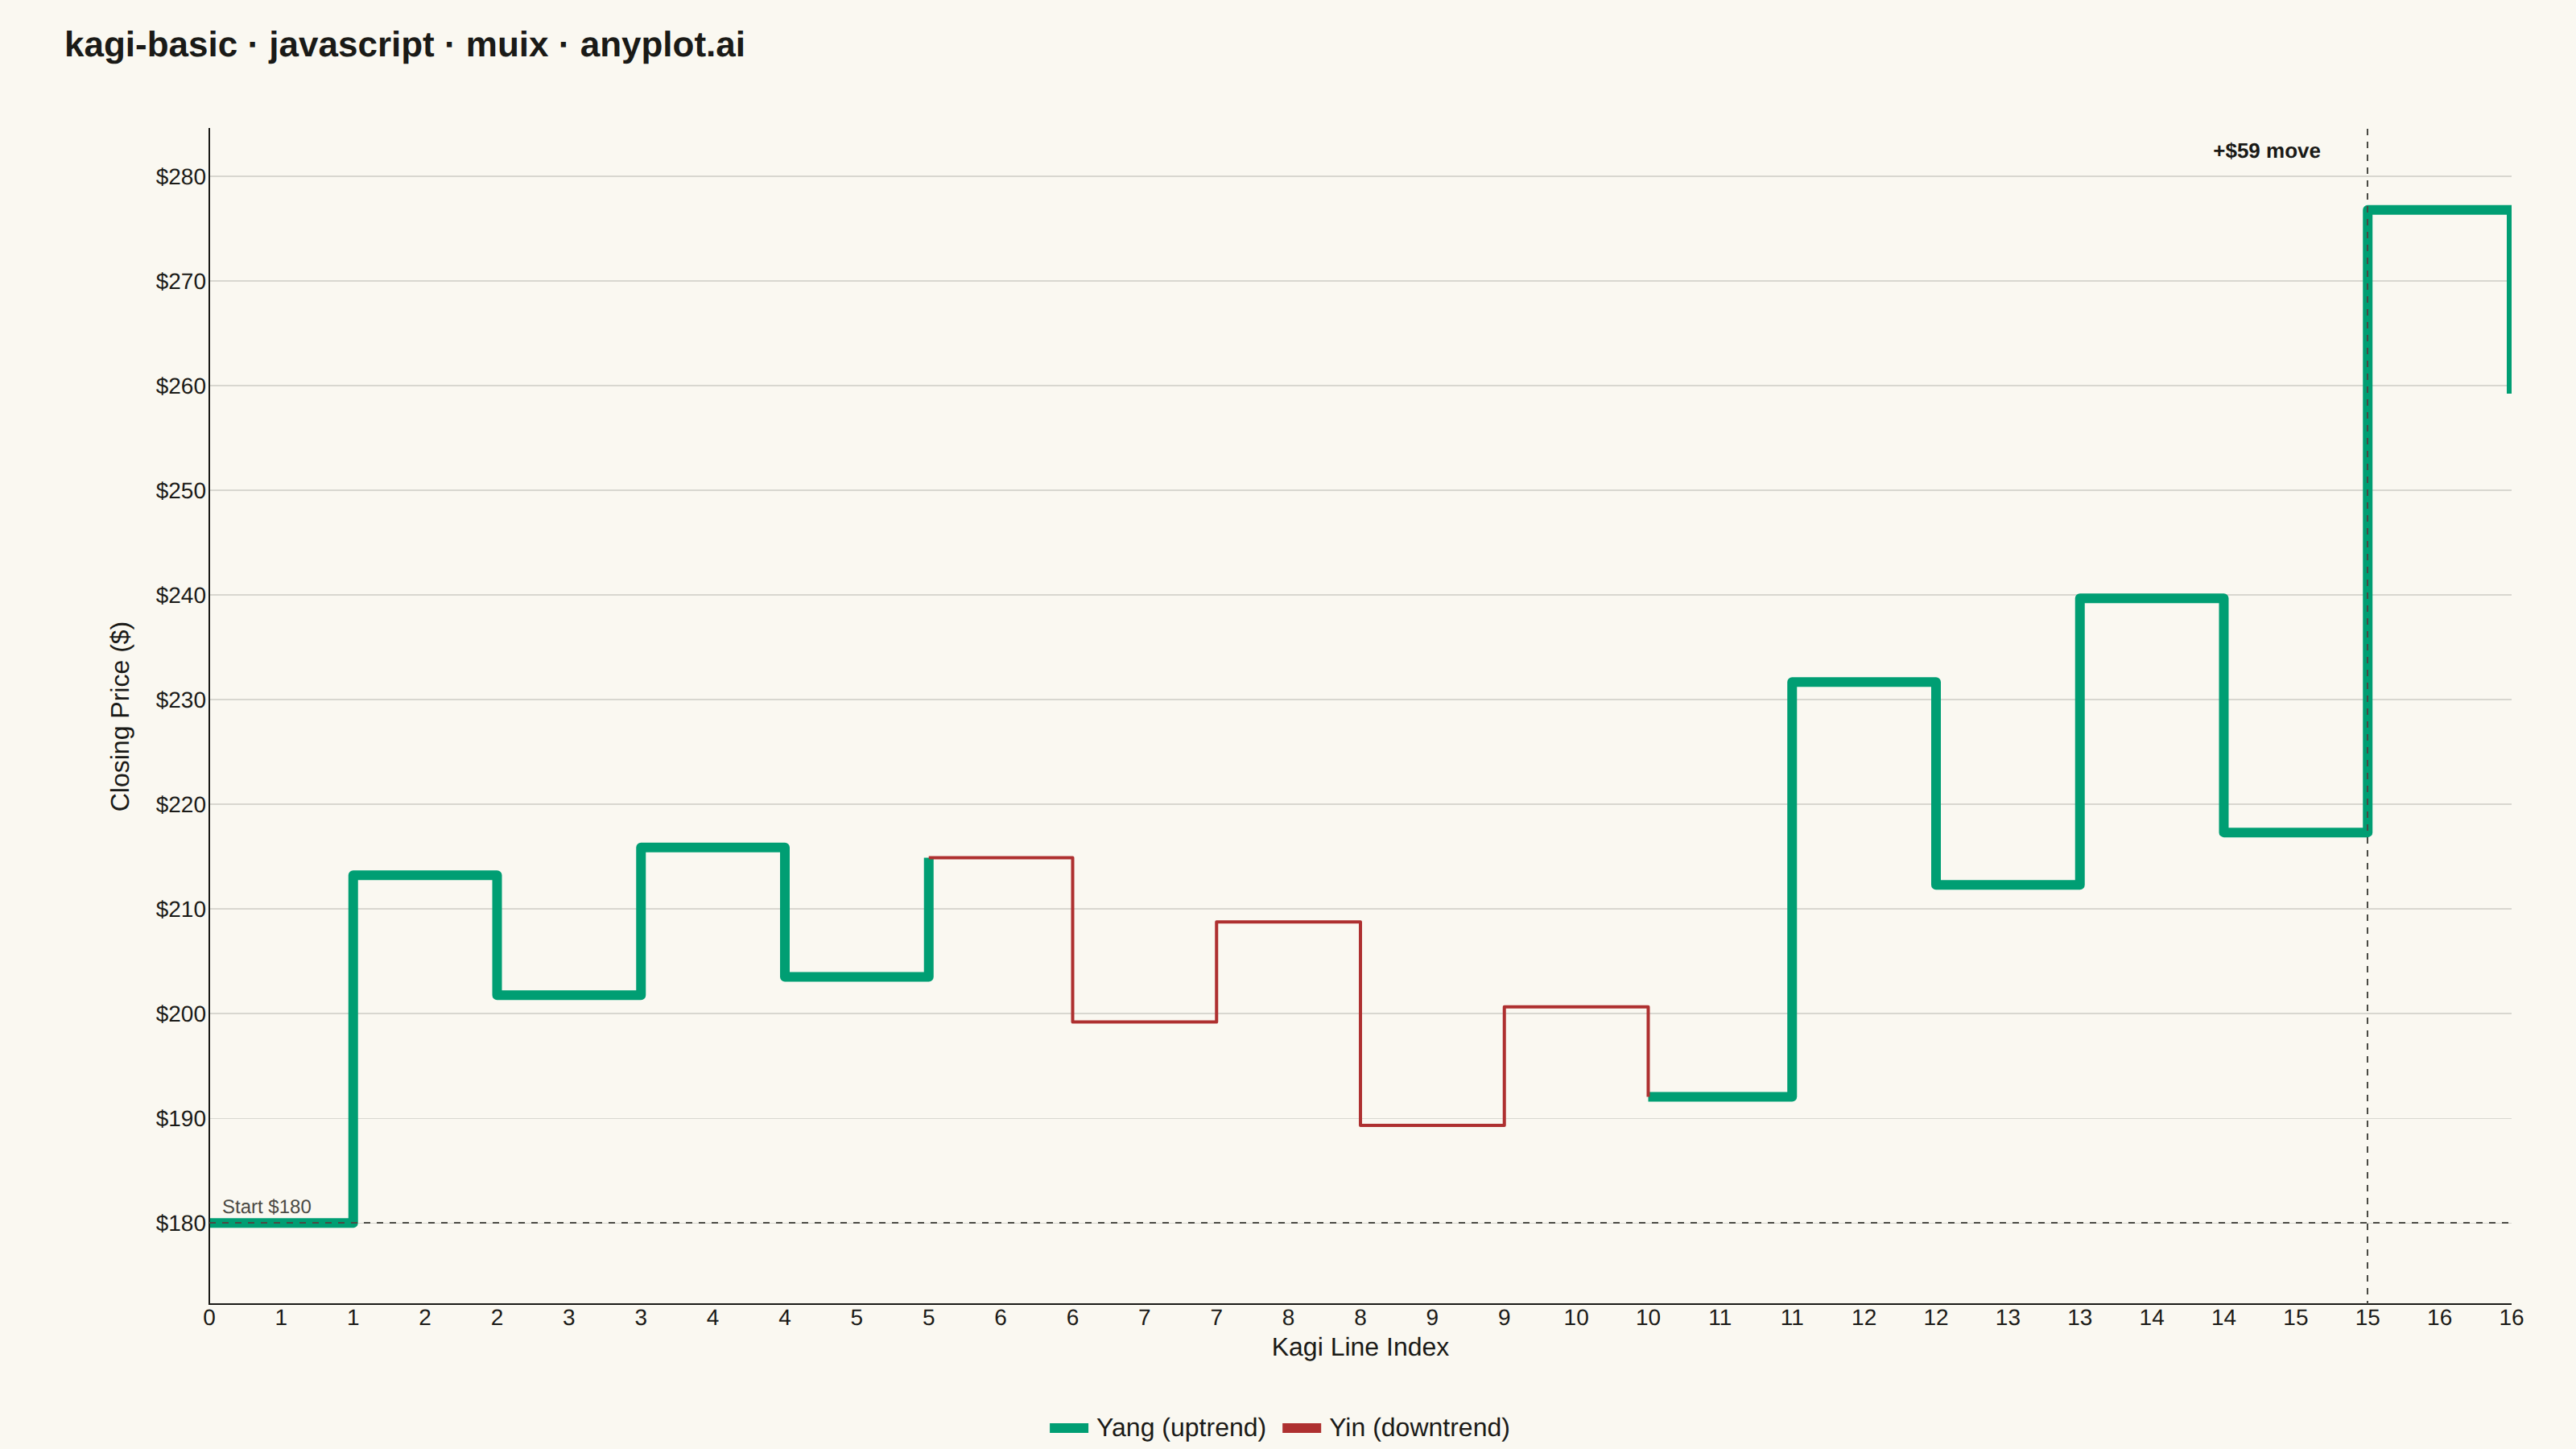
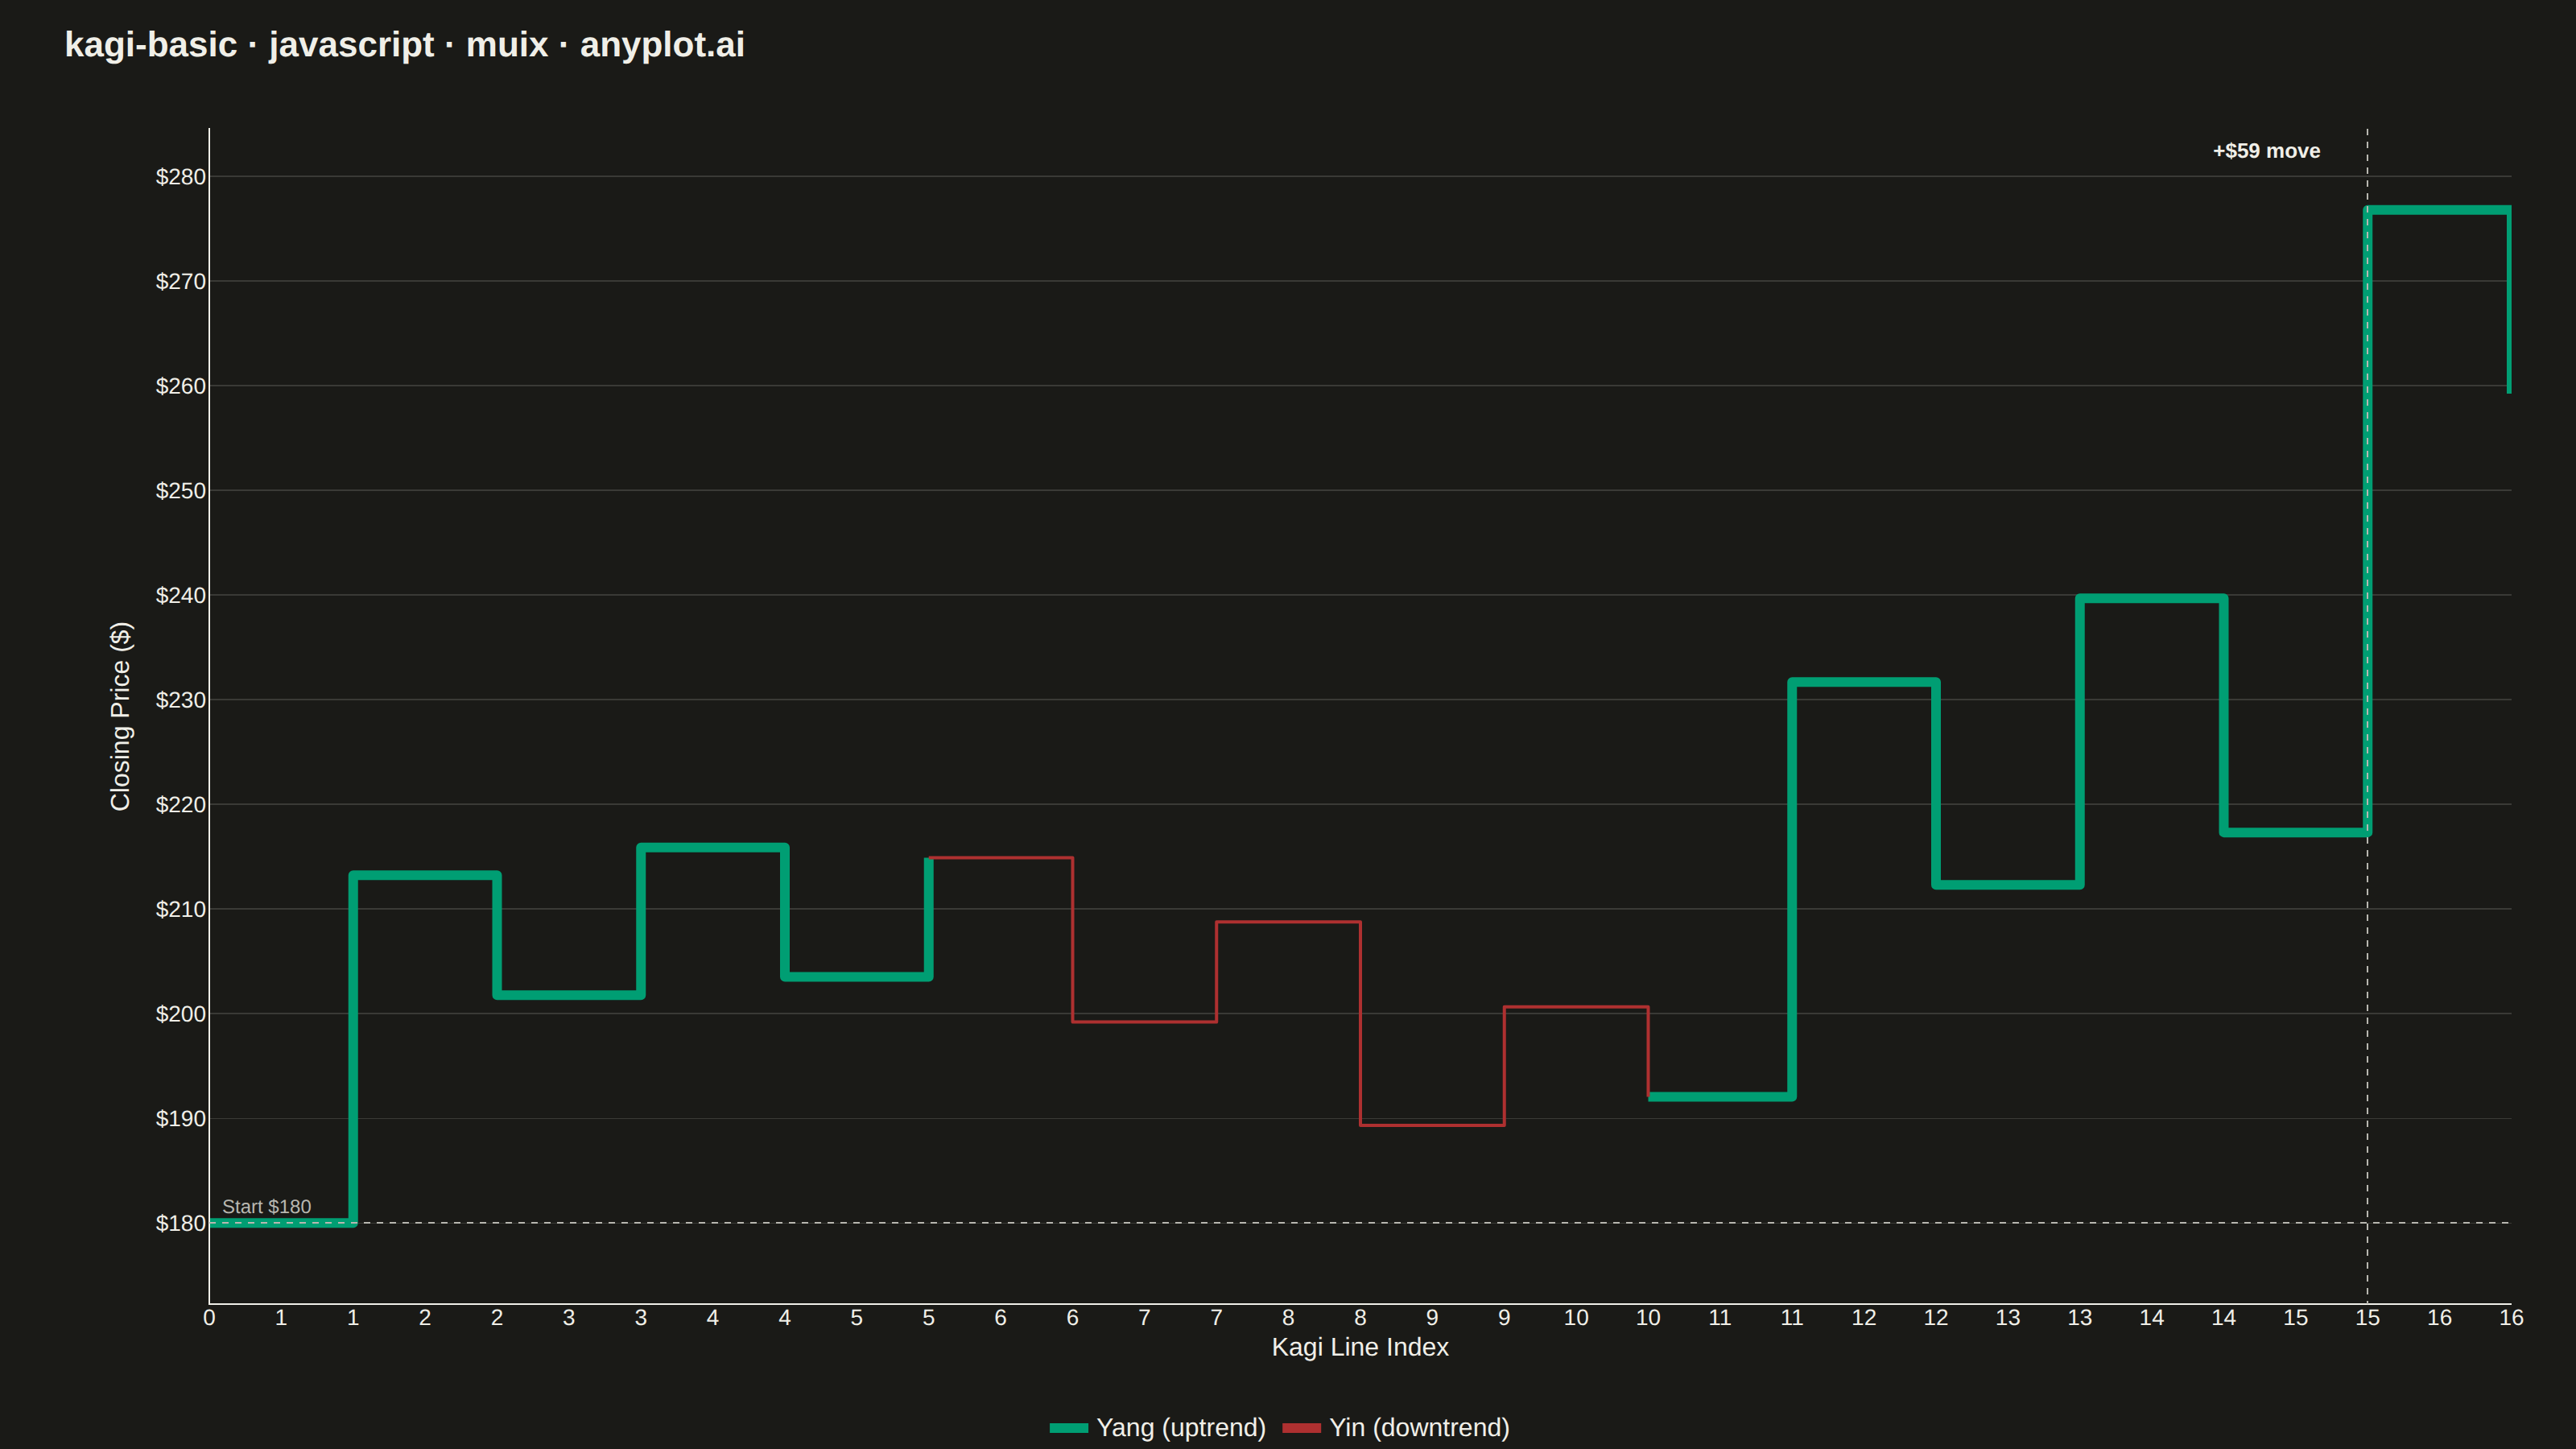
The same plot in 14 other libraries — JavaScript: Chart.js, D3.js, Apache ECharts, Highcharts; Python: Altair, Bokeh, lets-plot, Matplotlib, Plotly, plotnine, Pygal, Seaborn; R: ggplot2; Julia: Makie.jl. Compare all 15 side by side: Basic Kagi Chart in Python, R, Julia and JavaScript.
A Kagi chart is a Japanese charting technique that displays price movements using vertical lines of varying thickness. Unlike time-based charts, Kagi charts change direction only when price moves by a significant amount (the reversal threshold), effectively filtering out market noise. Thick lines (yang) indicate uptrends when price exceeds previous highs, while thin lines (yin) show downtrends when price falls below previous lows, making trend identification intuitive.
// anyplot.ai
// kagi-basic: Basic Kagi Chart
// Library: muix 7.29.1 | JavaScript 22.23.2
// Quality: 94/100 | Created: 2026-09-02
import { LineChart } from "@mui/x-charts/LineChart";
import { ChartsReferenceLine } from "@mui/x-charts/ChartsReferenceLine";
import Box from "@mui/material/Box";
import Typography from "@mui/material/Typography";

const t = window.ANYPLOT_TOKENS;
const TITLE = "kagi-basic · javascript · muix · anyplot.ai";
const TITLE_HEIGHT = 56;

// --- Data (in-memory, deterministic LCG — no seeded RNG in the browser) -----
function lcg(seed) {
  let state = seed;
  return () => {
    state = (state * 1664525 + 1013904223) % 4294967296;
    return state / 4294967296;
  };
}

function randomNormal(rand, mean, stdDev) {
  const u1 = Math.max(rand(), 1e-9);
  const u2 = rand();
  const z = Math.sqrt(-2 * Math.log(u1)) * Math.cos(2 * Math.PI * u2);
  return mean + z * stdDev;
}

// Daily closing prices for a mid-cap stock over ~1 trading year, generated as
// a log-return random walk (mild upward drift, realistic daily volatility).
const OBSERVATIONS = 240;
const rand = lcg(42);
let price = 180;
const closingPrices = [price];
for (let i = 1; i < OBSERVATIONS; i++) {
  const dailyReturn = randomNormal(rand, 0.0006, 0.016);
  price *= 1 + dailyReturn;
  closingPrices.push(price);
}

// Kagi construction: track a running extreme in the current direction and
// only flip once price reverses by the threshold — this is what filters
// time-based noise and keeps only the meaningful swings as turning points.
const REVERSAL_PCT = 0.04;

function buildKagiTurningPoints(prices, reversalPct) {
  const turningPoints = [prices[0]];
  let direction = null;
  let extreme = prices[0];
  for (let i = 1; i < prices.length; i++) {
    const priceNow = prices[i];
    if (direction === null) {
      const change = (priceNow - extreme) / extreme;
      if (change >= reversalPct) {
        direction = "up";
        extreme = priceNow;
        turningPoints.push(extreme);
      } else if (change <= -reversalPct) {
        direction = "down";
        extreme = priceNow;
        turningPoints.push(extreme);
      }
    } else if (direction === "up") {
      if (priceNow > extreme) {
        extreme = priceNow;
        turningPoints[turningPoints.length - 1] = extreme;
      } else if ((extreme - priceNow) / extreme >= reversalPct) {
        direction = "down";
        extreme = priceNow;
        turningPoints.push(extreme);
      }
    } else {
      if (priceNow < extreme) {
        extreme = priceNow;
        turningPoints[turningPoints.length - 1] = extreme;
      } else if ((priceNow - extreme) / extreme >= reversalPct) {
        direction = "up";
        extreme = priceNow;
        turningPoints.push(extreme);
      }
    }
  }
  return turningPoints;
}

const turningPoints = buildKagiTurningPoints(closingPrices, REVERSAL_PCT);

// Kagi thickness rule: a segment turns yang (thick) once price breaks above
// the PREVIOUS shoulder (an earlier peak) and yin (thin) once it breaks below
// the previous waist (an earlier trough) — thickness only flips on those
// breakouts, not on every reversal. That's what lets a sustained trend render
// as several consecutive same-thickness columns even while the path itself
// keeps zig-zagging shoulder/waist to shoulder/waist.
function classifyKagiThickness(points) {
  const thickness = [];
  let priorPeak = null;
  let priorTrough = null;
  let current = points[1] > points[0] ? "yang" : "yin";
  for (let k = 1; k < points.length; k++) {
    const isPeak = points[k] > points[k - 1];
    if (isPeak) {
      if (priorPeak !== null && points[k] > priorPeak) current = "yang";
      priorPeak = points[k];
    } else {
      if (priorTrough !== null && points[k] < priorTrough) current = "yin";
      priorTrough = points[k];
    }
    thickness.push(current);
  }
  return thickness;
}

const segmentThickness = classifyKagiThickness(turningPoints);

// The single largest turning-point move, called out with a reference-line
// annotation so the chart's standout swing doesn't go unlabeled.
let breakoutIndex = 1;
let breakoutMove = turningPoints[1] - turningPoints[0];
for (let k = 2; k < turningPoints.length; k++) {
  const move = turningPoints[k] - turningPoints[k - 1];
  if (Math.abs(move) > Math.abs(breakoutMove)) {
    breakoutMove = move;
    breakoutIndex = k;
  }
}
const breakoutLabel = `${breakoutMove >= 0 ? "+" : "-"}$${Math.round(Math.abs(breakoutMove))} move`;
const startPrice = Math.round(closingPrices[0]);

// Rectilinear Kagi path: each turn contributes a horizontal shoulder/waist
// (connecting the previous column to the new one) followed by the vertical
// line itself — the right-angle geometry a Kagi chart is drawn with. The
// x-axis is the line index, not time, per the spec.
const vertices = [{ x: 0, y: turningPoints[0] }];
for (let k = 1; k < turningPoints.length; k++) {
  vertices.push({ x: k, y: turningPoints[k - 1] });
  vertices.push({ x: k, y: turningPoints[k] });
}
const lineIndex = vertices.map((v) => v.x);
const priceMin = Math.min(...turningPoints);
const priceMax = Math.max(...turningPoints);
const pricePadding = (priceMax - priceMin) * 0.08;

// Split the rectilinear path into two series by Kagi thickness so each can
// carry its own line width (thick yang / thin yin). Null gaps keep unrelated
// segments apart, while shared boundary vertices let a segment's series
// also carry the turning point it starts or ends on, so the two colors
// visually meet exactly at each reversal.
const yangPrice = new Array(vertices.length).fill(null);
const yinPrice = new Array(vertices.length).fill(null);
for (let k = 1; k < turningPoints.length; k++) {
  const startIdx = 2 * (k - 1);
  const midIdx = 2 * k - 1;
  const endIdx = 2 * k;
  const target = segmentThickness[k - 1] === "yang" ? yangPrice : yinPrice;
  target[startIdx] = vertices[startIdx].y;
  target[midIdx] = vertices[midIdx].y;
  target[endIdx] = vertices[endIdx].y;
}

// --- Chart (default-exported component — the harness mounts it) -------------
export default function Chart() {
  const { width, height } = window.ANYPLOT_SIZE;
  const chartHeight = height - TITLE_HEIGHT;

  return (
    <Box sx={{ width, height, bgcolor: t.pageBg }}>
      <Box sx={{ height: TITLE_HEIGHT, display: "flex", alignItems: "center", px: "40px" }}>
        <Typography sx={{ color: t.ink, fontSize: "22px", fontWeight: 600, lineHeight: 1 }}>
          {TITLE}
        </Typography>
      </Box>
      <LineChart
        width={width}
        height={chartHeight}
        skipAnimation
        colors={[t.palette[0], t.palette[4]]}
        grid={{ horizontal: true }}
        xAxis={[
          {
            data: lineIndex,
            scaleType: "linear",
            label: "Kagi Line Index",
            valueFormatter: (v) => Math.round(v).toString(),
            tickLabelStyle: { fontSize: 14 },
            labelStyle: { fontSize: 16 },
            tickSize: 0,
          },
        ]}
        yAxis={[
          {
            label: "Closing Price ($)",
            min: priceMin - pricePadding,
            max: priceMax + pricePadding,
            valueFormatter: (v) => `$${Math.round(v)}`,
            // ChartsYAxis: labelRefPoint.x = -(tickFontSize + tickSize + 10).
            // Set it wide enough to clear the "$277"-style tick text, while
            // tickLabelStyle.fontSize keeps the rendered tick size correct.
            tickFontSize: 40,
            tickLabelStyle: { fontSize: 14 },
            labelStyle: { fontSize: 16 },
            tickSize: 0,
          },
        ]}
        series={[
          {
            id: "yang",
            data: yangPrice,
            label: "Yang (uptrend)",
            curve: "linear",
            showMark: false,
          },
          {
            id: "yin",
            data: yinPrice,
            label: "Yin (downtrend)",
            curve: "linear",
            showMark: false,
          },
        ]}
        margin={{ top: 24, bottom: 90, left: 130, right: 40 }}
        sx={{
          "& .MuiLineElement-series-yang": { strokeWidth: 6 },
          "& .MuiLineElement-series-yin": { strokeWidth: 2 },
          "& .MuiChartsAxis-line": { stroke: t.grid },
          "& .MuiChartsAxis-tick": { stroke: t.grid },
          "& .MuiChartsGrid-line": { stroke: t.grid, strokeWidth: 0.75 },
          "& .MuiChartsLegend-label": { fontSize: "15px" },
        }}
        slotProps={{
          legend: {
            position: { vertical: "bottom", horizontal: "middle" },
            itemMarkWidth: 24,
            itemMarkHeight: 6,
            padding: { top: 16 },
          },
        }}
      >
        <ChartsReferenceLine
          y={startPrice}
          label={`Start $${startPrice}`}
          labelAlign="start"
          spacing={{ x: 8, y: 6 }}
          lineStyle={{ stroke: t.inkSoft, strokeDasharray: "4 4", strokeWidth: 1 }}
          labelStyle={{ fontSize: 12, fill: t.inkSoft }}
        />
        <ChartsReferenceLine
          x={breakoutIndex}
          label={breakoutLabel}
          labelAlign="start"
          spacing={{ x: -96, y: 8 }}
          lineStyle={{ stroke: t.inkSoft, strokeDasharray: "4 4", strokeWidth: 1 }}
          labelStyle={{ fontSize: 13, fontWeight: 600, fill: t.ink }}
        />
      </LineChart>
    </Box>
  );
}
Runnable source as JSON, for any HTTP client: https://api.anyplot.ai/specs/kagi-basic/muix/code. Any spec id and library id listed in llms-full.txt fit the same URL shape; every URL below is complete and callable.
{
  "spec_id": "kagi-basic",
  "language": "javascript",
  "library": "muix",
  "page": "https://anyplot.ai/kagi-basic/javascript/muix",
  "hub": "https://anyplot.ai/kagi-basic",
  "code_json": "https://api.anyplot.ai/specs/kagi-basic/muix/code",
  "spec_json": "https://api.anyplot.ai/specs/kagi-basic",
  "render_light_png": "https://storage.googleapis.com/anyplot-images/plots/kagi-basic/javascript/muix/plot-light.png",
  "render_dark_png": "https://storage.googleapis.com/anyplot-images/plots/kagi-basic/javascript/muix/plot-dark.png",
  "interactive_light_html": "https://storage.googleapis.com/anyplot-images/plots/kagi-basic/javascript/muix/plot-light.html",
  "interactive_dark_html": "https://storage.googleapis.com/anyplot-images/plots/kagi-basic/javascript/muix/plot-dark.html",
  "quality_score": 94.0,
  "license": "MIT",
  "guide": "https://anyplot.ai/llms.txt"
}
Part of Basic Kagi Chart on anyplot.ai.