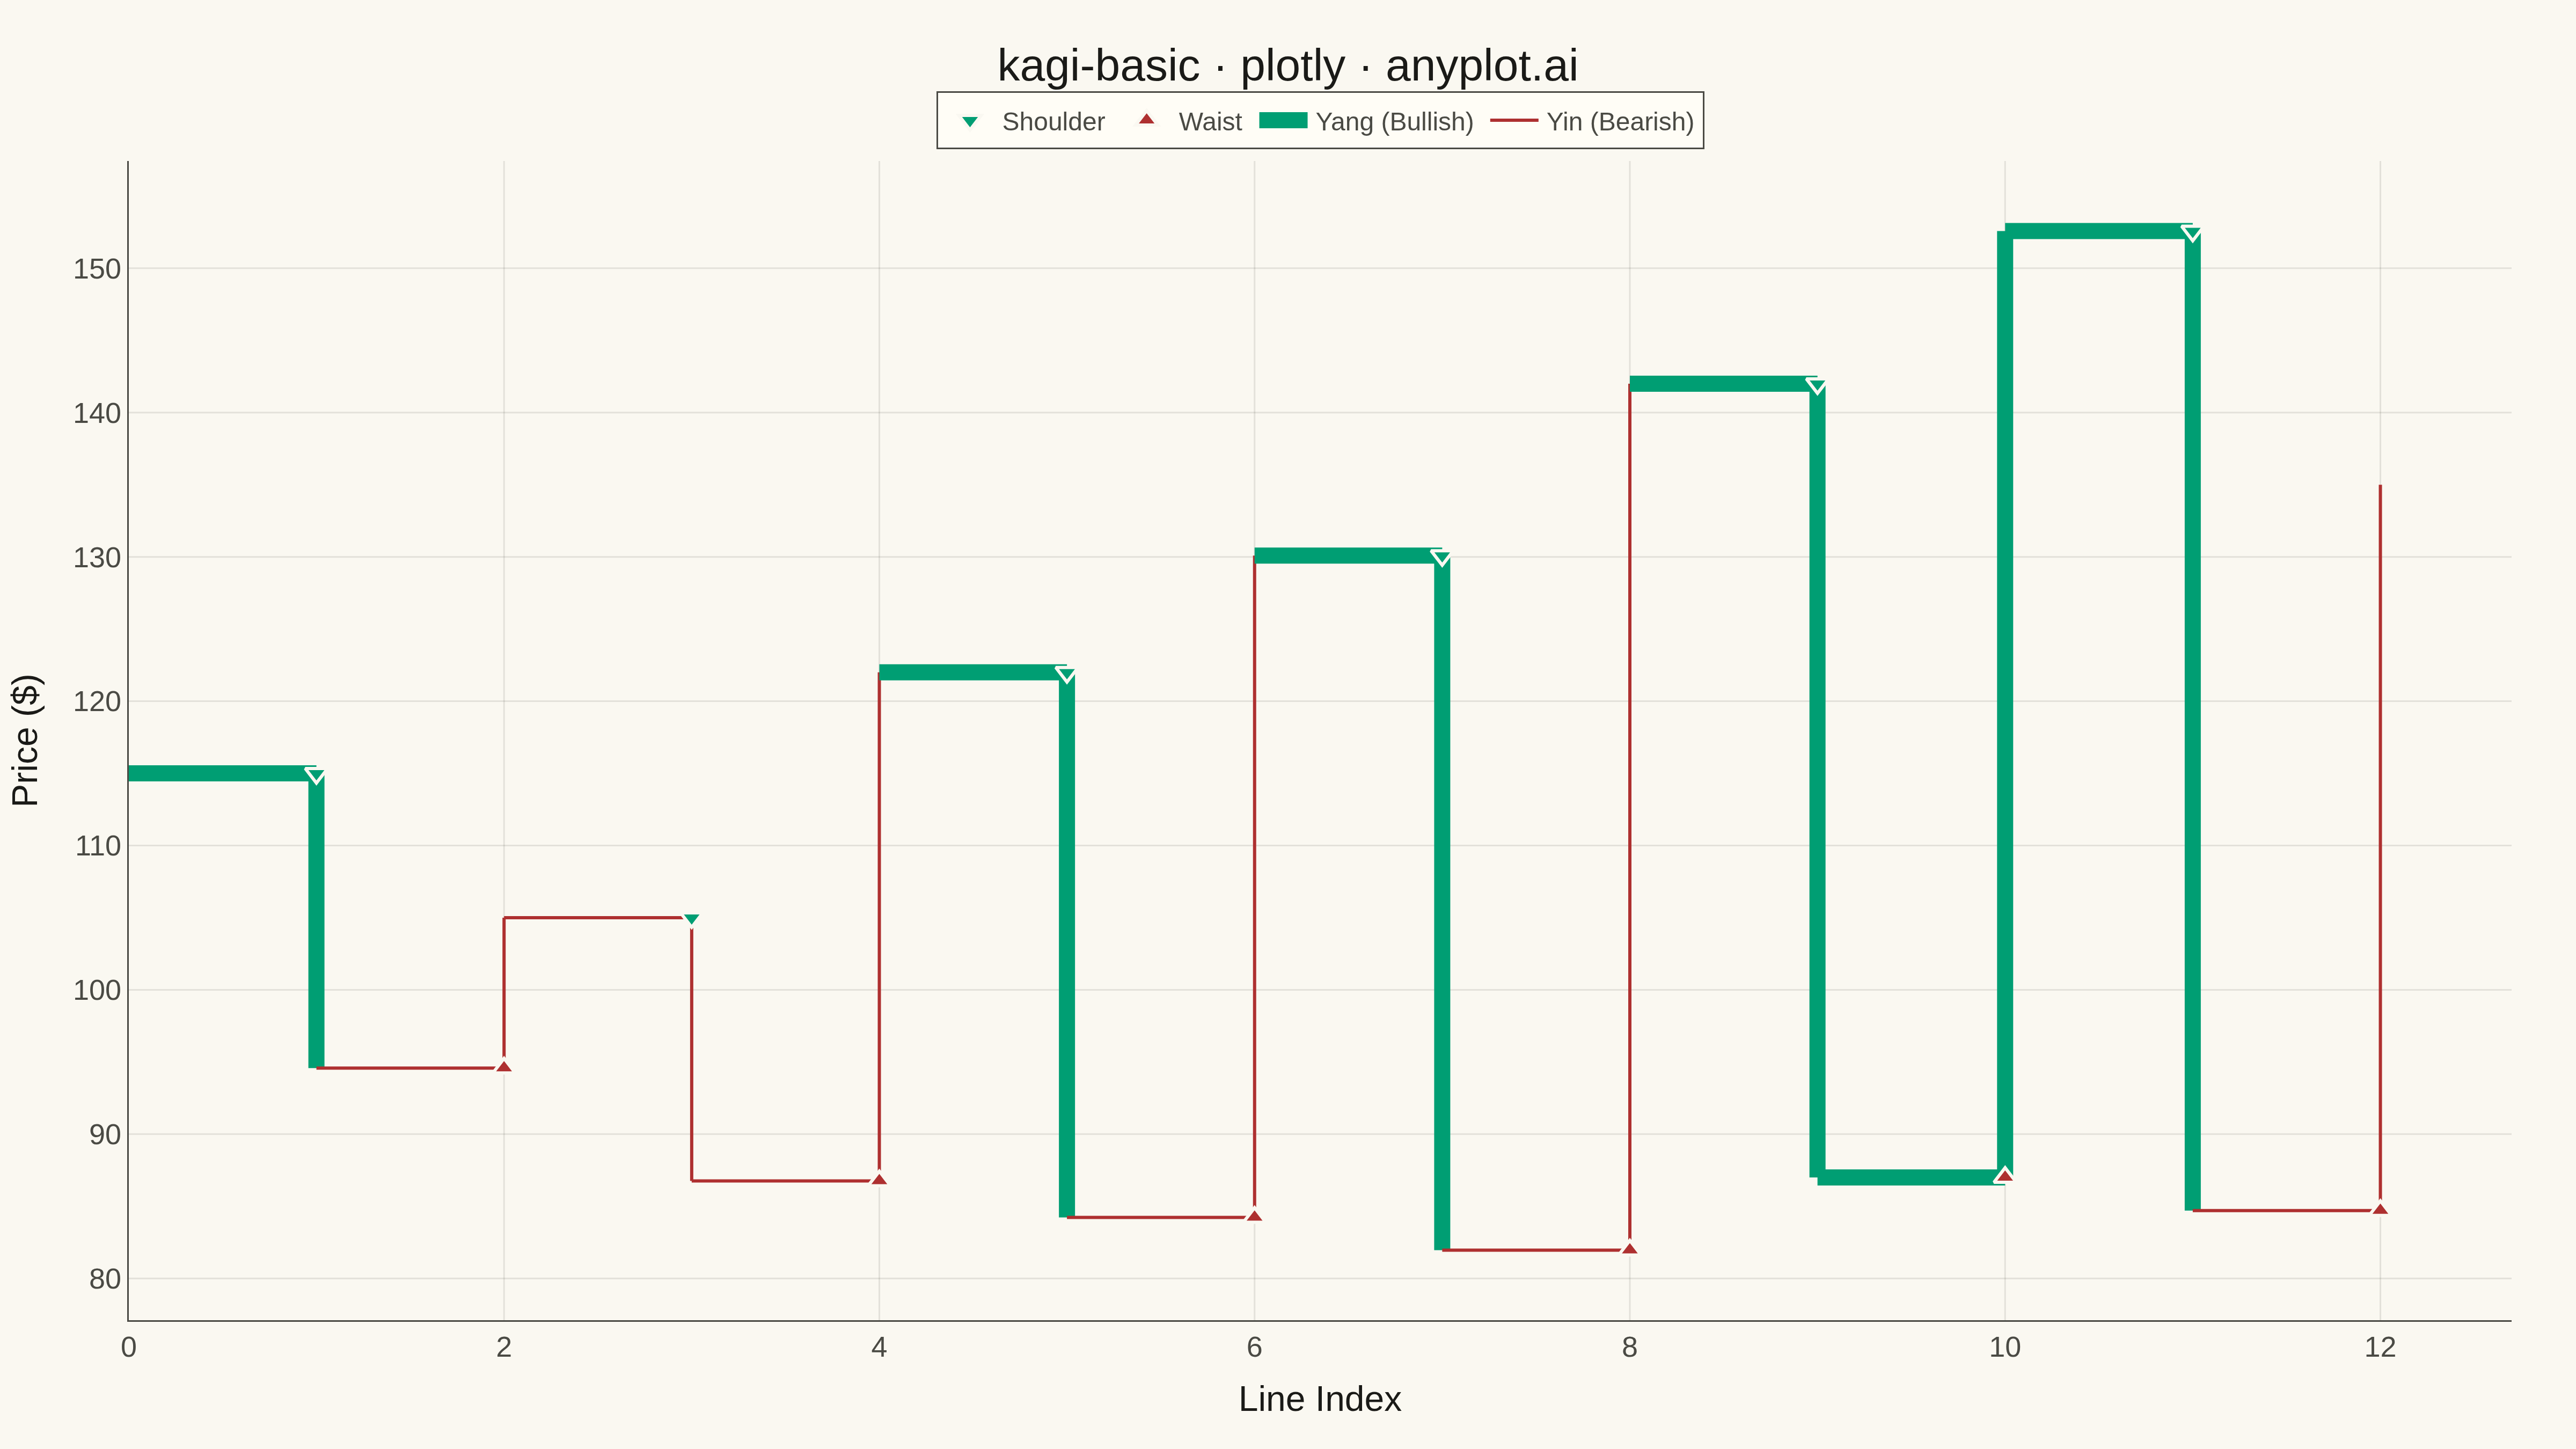
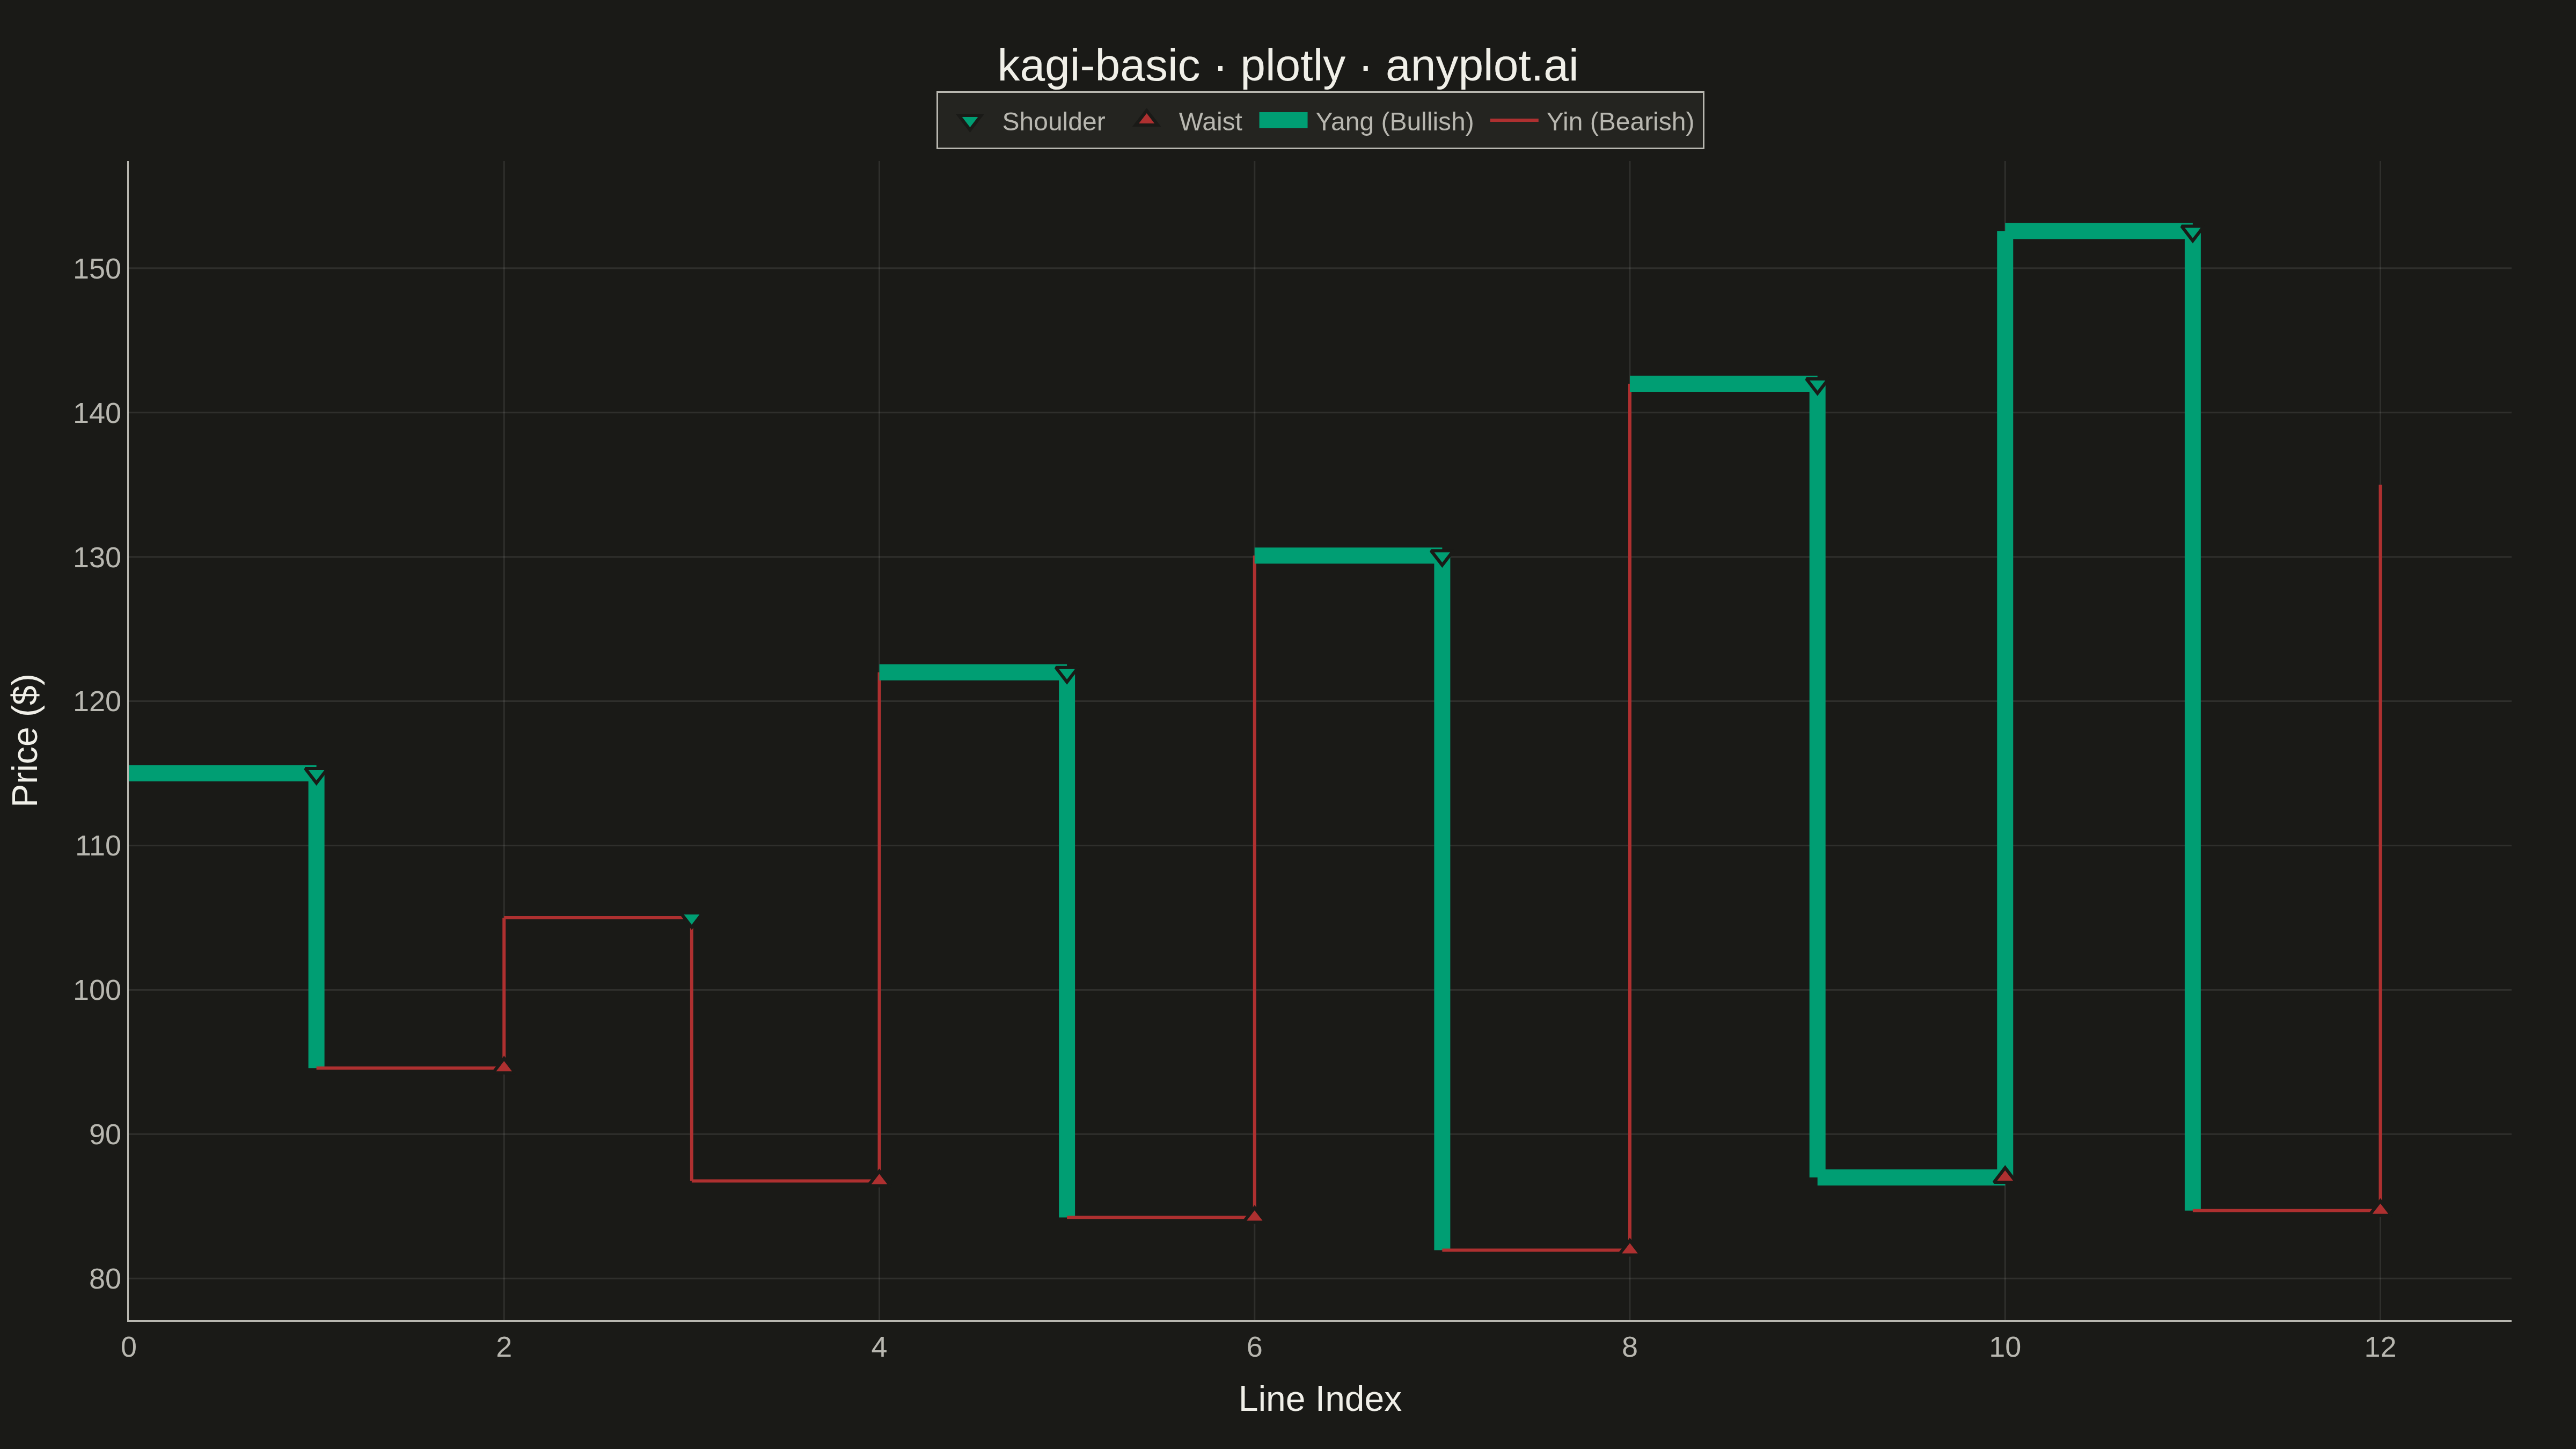
A Kagi chart is a Japanese charting technique that displays price movements using vertical lines of varying thickness. Unlike time-based charts, Kagi charts change direction only when price moves by a significant amount (the reversal threshold), effectively filtering out market noise. Thick lines (yang) indicate uptrends when price exceeds previous highs, while thin lines (yin) show downtrends when price falls below previous lows, making trend identification intuitive.
Preview render from the Plotly implementation.