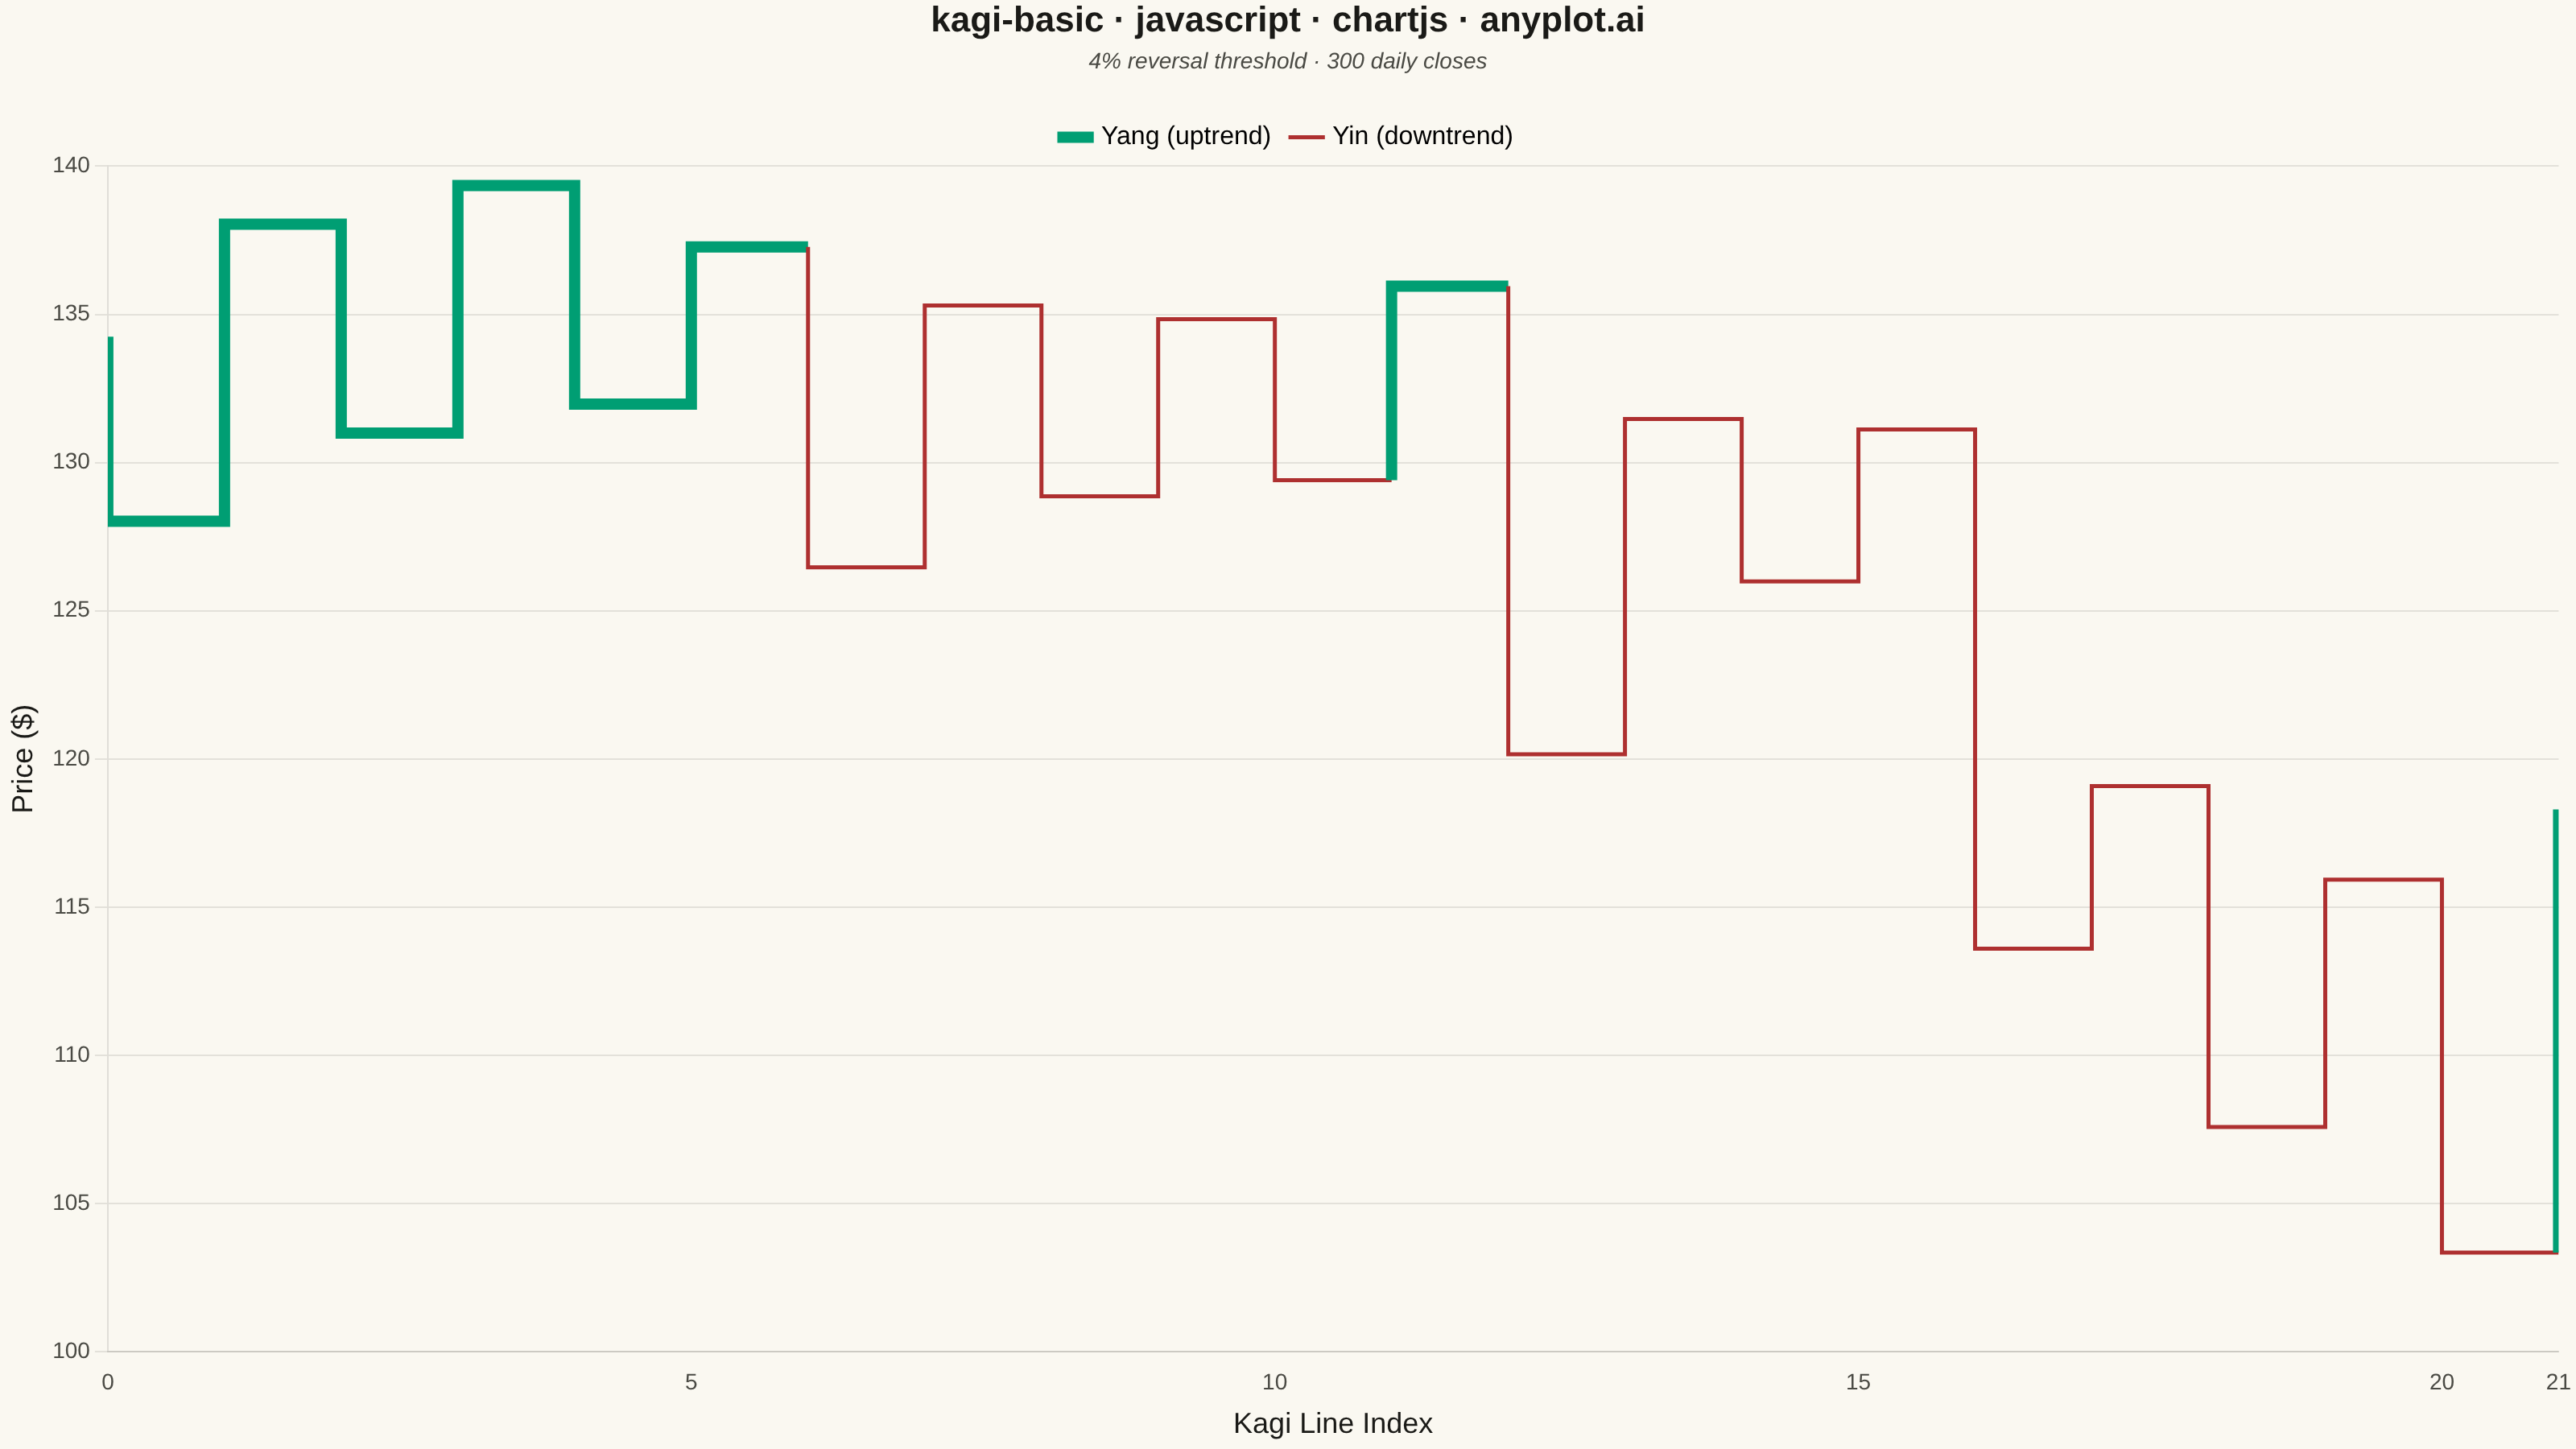
The same plot in 14 other libraries — JavaScript: D3.js, Apache ECharts, Highcharts, MUI X Charts; Python: Altair, Bokeh, lets-plot, Matplotlib, Plotly, plotnine, Pygal, Seaborn; R: ggplot2; Julia: Makie.jl. Compare all 15 side by side: Basic Kagi Chart in Python, R, Julia and JavaScript.
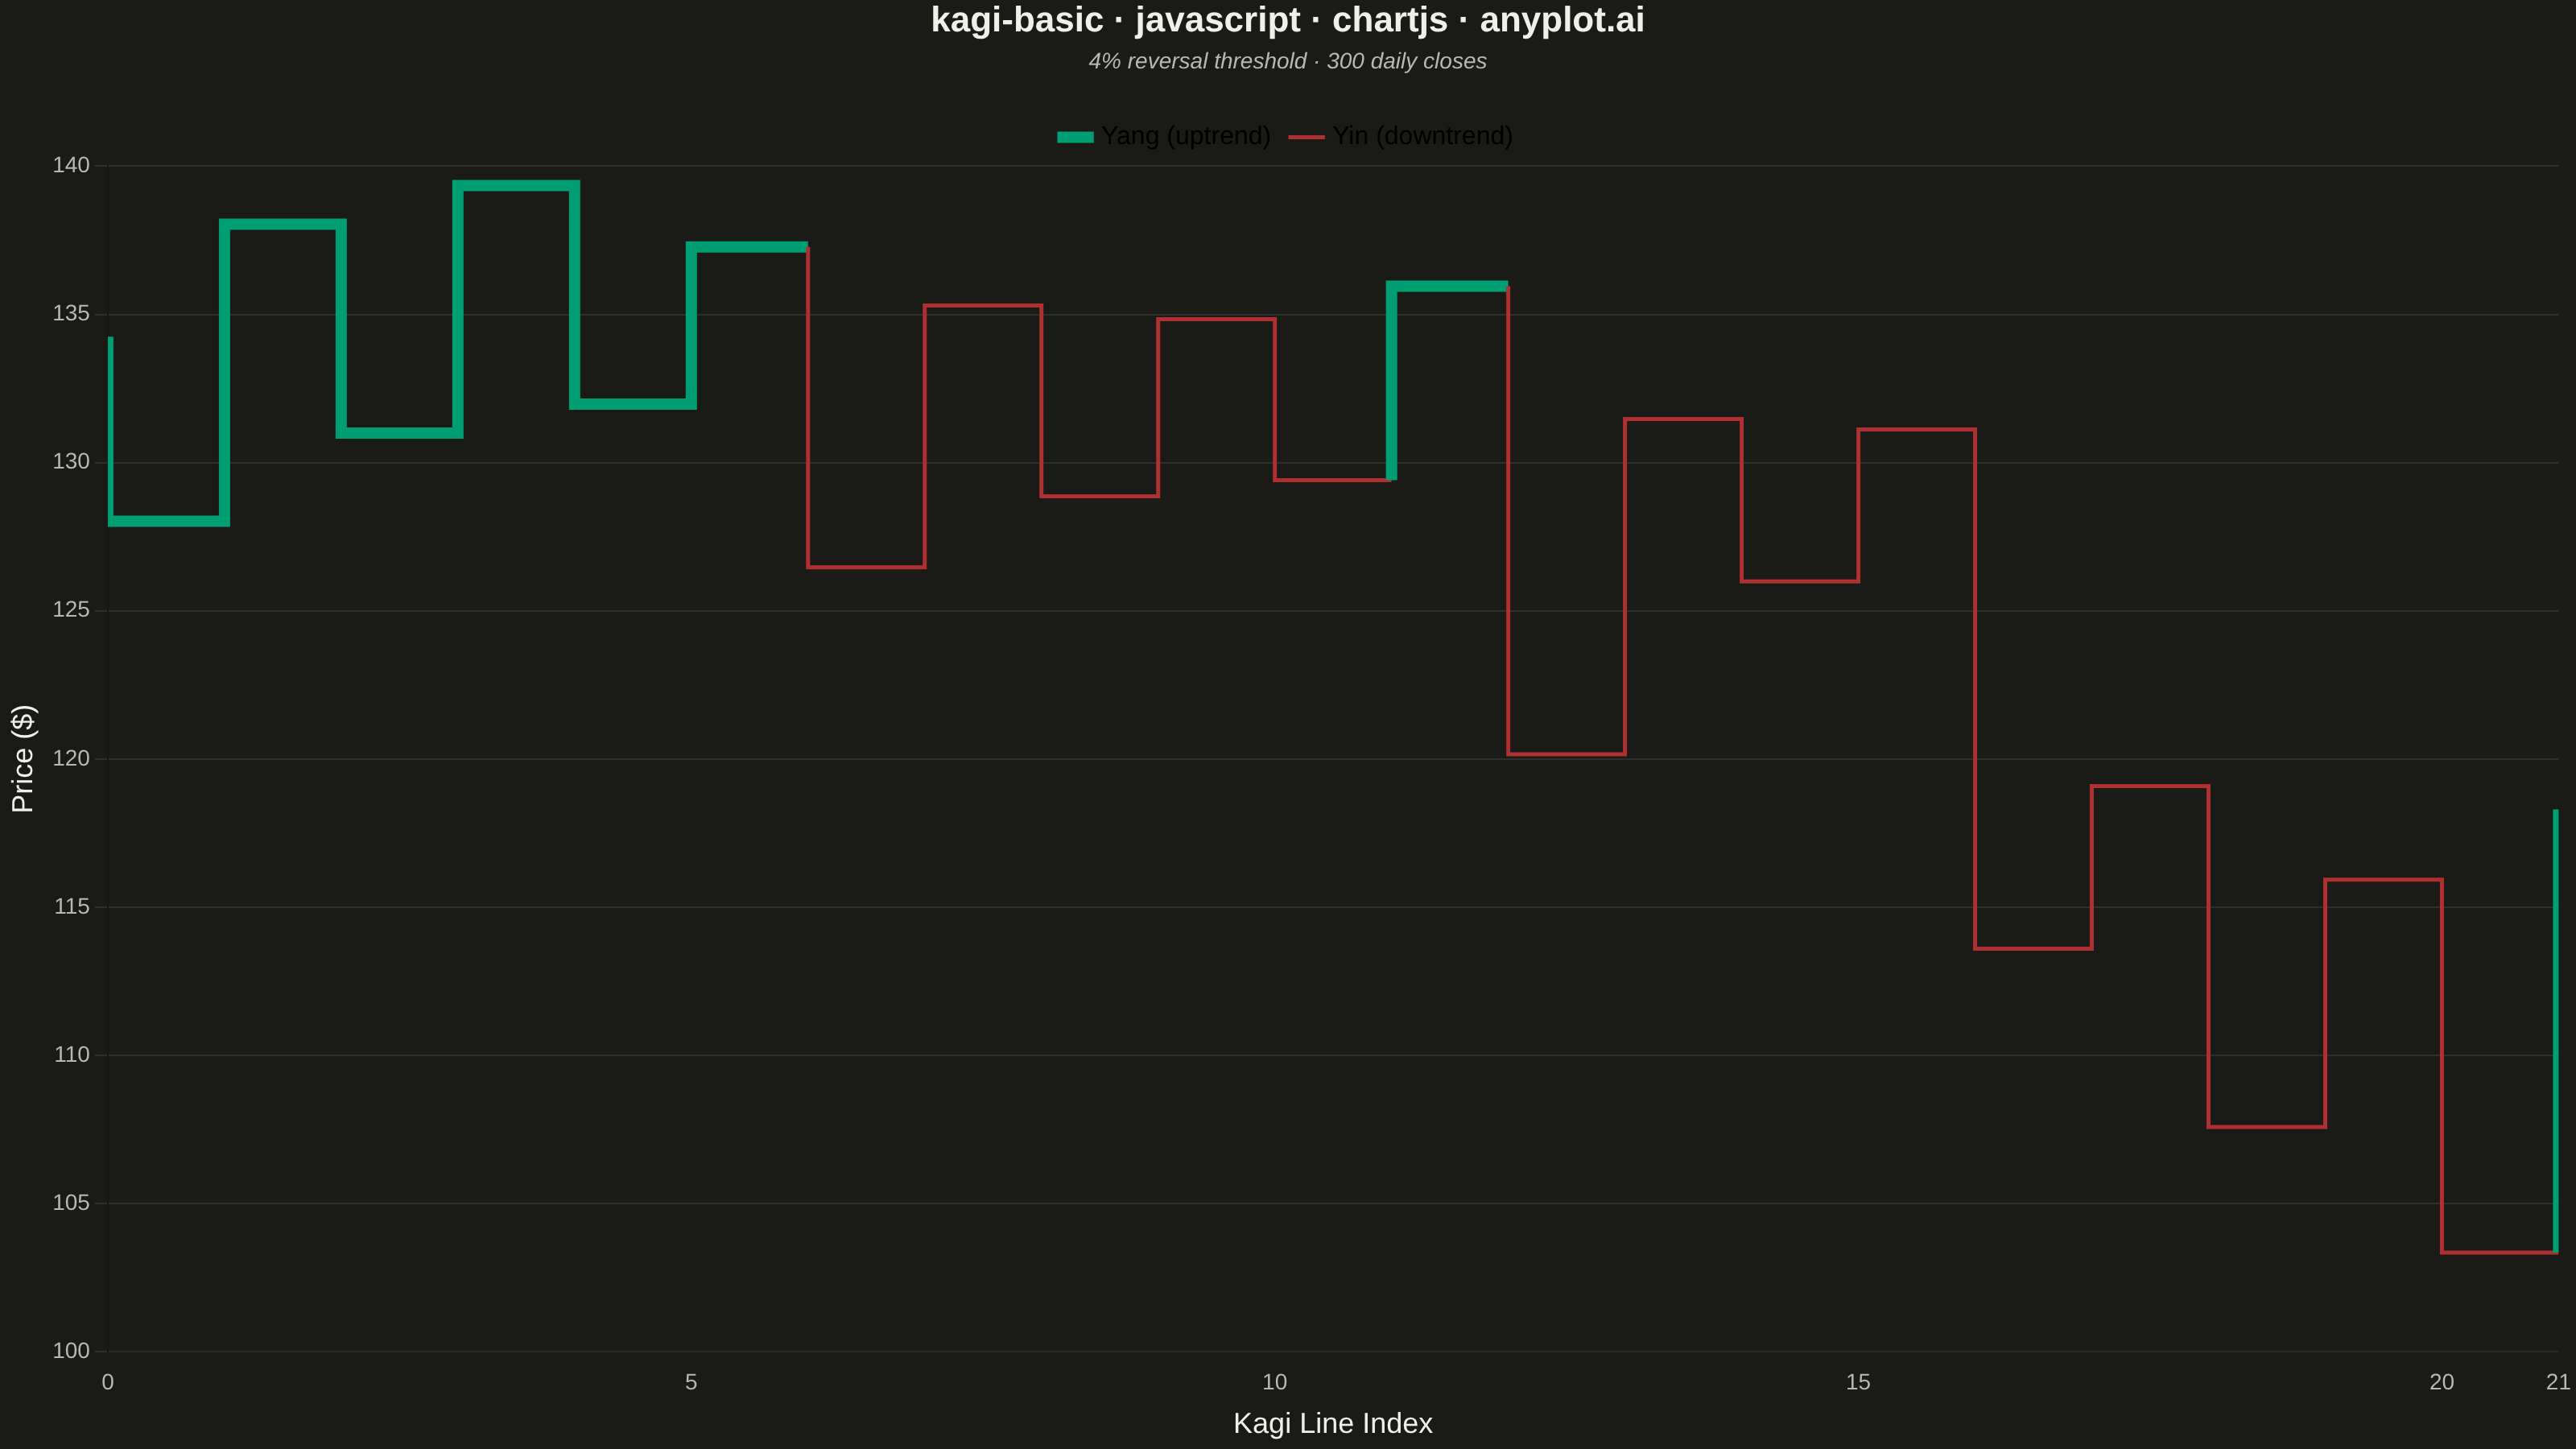
A Kagi chart is a Japanese charting technique that displays price movements using vertical lines of varying thickness. Unlike time-based charts, Kagi charts change direction only when price moves by a significant amount (the reversal threshold), effectively filtering out market noise. Thick lines (yang) indicate uptrends when price exceeds previous highs, while thin lines (yin) show downtrends when price falls below previous lows, making trend identification intuitive.
// anyplot.ai
// kagi-basic: Basic Kagi Chart
// Library: chartjs 4.4.7 | JavaScript 22.23.2
// Quality: 91/100 | Created: 2026-09-02

const t = window.ANYPLOT_TOKENS;
const YANG = t.palette[0]; // #009E73 brand green — up/gain (semantic exception)
const YIN = t.palette[4]; // #AE3030 matte red — down/loss (semantic exception)

// --- Data: synthetic daily closing prices (deterministic LCG) --------------
function lcg(seed) {
  let state = seed;
  return () => {
    state = (state * 1103515245 + 12345) & 0x7fffffff;
    return state / 0x7fffffff;
  };
}
const rand = lcg(42);

const nDays = 300;
const closes = [128];
for (let i = 1; i < nDays; i++) {
  const drift = 0.05;
  const shock = (rand() - 0.5) * 5;
  closes.push(Math.max(20, closes[i - 1] + drift + shock));
}

// --- Kagi construction: zigzag pivots at the reversal threshold ------------
const reversalPct = 0.04;
let direction = null; // null | "up" | "down"
let extreme = closes[0];
let extremeIdx = 0;
const pivots = [];

for (let i = 1; i < closes.length; i++) {
  const price = closes[i];
  if (direction === null) {
    if (price - extreme >= extreme * reversalPct) {
      pivots.push({ idx: extremeIdx, price: extreme });
      direction = "up";
      extreme = price;
      extremeIdx = i;
    } else if (extreme - price >= extreme * reversalPct) {
      pivots.push({ idx: extremeIdx, price: extreme });
      direction = "down";
      extreme = price;
      extremeIdx = i;
    } else if (price > extreme) {
      extreme = price;
      extremeIdx = i;
    }
  } else if (direction === "up") {
    if (price > extreme) {
      extreme = price;
      extremeIdx = i;
    } else if (extreme - price >= extreme * reversalPct) {
      pivots.push({ idx: extremeIdx, price: extreme });
      direction = "down";
      extreme = price;
      extremeIdx = i;
    }
  } else {
    if (price < extreme) {
      extreme = price;
      extremeIdx = i;
    } else if (price - extreme >= extreme * reversalPct) {
      pivots.push({ idx: extremeIdx, price: extreme });
      direction = "up";
      extreme = price;
      extremeIdx = i;
    }
  }
}
pivots.push({ idx: extremeIdx, price: extreme });

// Yang/yin: a column thickens on breaking the prior same-type pivot (shoulder
// for up columns, waist for down columns) and thins on the opposite break.
// The first column has no prior pivot to compare against, so it starts thick
// (yang) by convention — harmless here since the series' first move is up.
let thick = true;
const columns = [];
for (let k = 0; k < pivots.length - 1; k++) {
  const from = pivots[k];
  const to = pivots[k + 1];
  const up = to.price > from.price;
  const prevSamePivot = k - 1 >= 0 ? pivots[k - 1] : null;
  if (prevSamePivot) {
    if (up && to.price > prevSamePivot.price) thick = true;
    if (!up && to.price < prevSamePivot.price) thick = false;
  }
  columns.push({ up, thick });
}

// Explicit vertical (price move) + horizontal (column shift) points, since a
// Kagi chart's x-axis is the line index, not time.
const kagiPoints = [{ x: 0, y: pivots[0].price }];
for (let k = 0; k < columns.length; k++) {
  const col = columns[k];
  kagiPoints.push({ x: k, y: pivots[k + 1].price, thick: col.thick });
  if (k < columns.length - 1) {
    kagiPoints.push({ x: k + 1, y: pivots[k + 1].price, thick: col.thick });
  }
}

// --- Mount -------------------------------------------------------------
const canvas = document.createElement("canvas");
document.getElementById("container").appendChild(canvas);

// --- Chart -------------------------------------------------------------
new Chart(canvas, {
  type: "line",
  data: {
    datasets: [
      {
        label: "Price",
        data: kagiPoints,
        borderColor: YANG,
        pointRadius: 0,
        tension: 0,
        segment: {
          borderColor: (ctx) => (kagiPoints[ctx.p1DataIndex].thick ? YANG : YIN),
          borderWidth: (ctx) => (kagiPoints[ctx.p1DataIndex].thick ? 7 : 2.5),
        },
      },
    ],
  },
  options: {
    responsive: true,
    maintainAspectRatio: false,
    animation: false,
    plugins: {
      title: {
        display: true,
        text: "kagi-basic · javascript · chartjs · anyplot.ai",
        color: t.ink,
        font: { size: 22 },
        padding: { bottom: 4 },
      },
      subtitle: {
        display: true,
        text: `${reversalPct * 100}% reversal threshold · ${nDays} daily closes`,
        color: t.inkSoft,
        font: { size: 14, style: "italic" },
        padding: { bottom: 16 },
      },
      legend: {
        labels: {
          color: t.ink,
          font: { size: 16 },
          usePointStyle: true,
          boxPadding: 6,
          padding: 14,
          generateLabels: () => [
            { text: "Yang (uptrend)", fillStyle: YANG, strokeStyle: YANG, lineWidth: 7, pointStyle: "line" },
            { text: "Yin (downtrend)", fillStyle: YIN, strokeStyle: YIN, lineWidth: 2.5, pointStyle: "line" },
          ],
        },
      },
    },
    scales: {
      x: {
        type: "linear",
        min: 0,
        max: columns.length - 1,
        bounds: "data",
        ticks: { color: t.inkSoft, font: { size: 14 }, stepSize: 5 },
        grid: { display: false },
        title: { display: true, text: "Kagi Line Index", color: t.ink, font: { size: 18 } },
      },
      y: {
        ticks: { color: t.inkSoft, font: { size: 14 } },
        grid: { color: t.grid.replace("0.15", "0.1") },
        title: { display: true, text: "Price ($)", color: t.ink, font: { size: 18 } },
      },
    },
  },
});
Runnable source as JSON, for any HTTP client: https://api.anyplot.ai/specs/kagi-basic/chartjs/code. Any spec id and library id listed in llms-full.txt fit the same URL shape; every URL below is complete and callable.
{
  "spec_id": "kagi-basic",
  "language": "javascript",
  "library": "chartjs",
  "page": "https://anyplot.ai/kagi-basic/javascript/chartjs",
  "hub": "https://anyplot.ai/kagi-basic",
  "code_json": "https://api.anyplot.ai/specs/kagi-basic/chartjs/code",
  "spec_json": "https://api.anyplot.ai/specs/kagi-basic",
  "render_light_png": "https://storage.googleapis.com/anyplot-images/plots/kagi-basic/javascript/chartjs/plot-light.png",
  "render_dark_png": "https://storage.googleapis.com/anyplot-images/plots/kagi-basic/javascript/chartjs/plot-dark.png",
  "interactive_light_html": "https://storage.googleapis.com/anyplot-images/plots/kagi-basic/javascript/chartjs/plot-light.html",
  "interactive_dark_html": "https://storage.googleapis.com/anyplot-images/plots/kagi-basic/javascript/chartjs/plot-dark.html",
  "quality_score": 91.0,
  "license": "MIT",
  "guide": "https://anyplot.ai/llms.txt"
}
Part of Basic Kagi Chart on anyplot.ai.