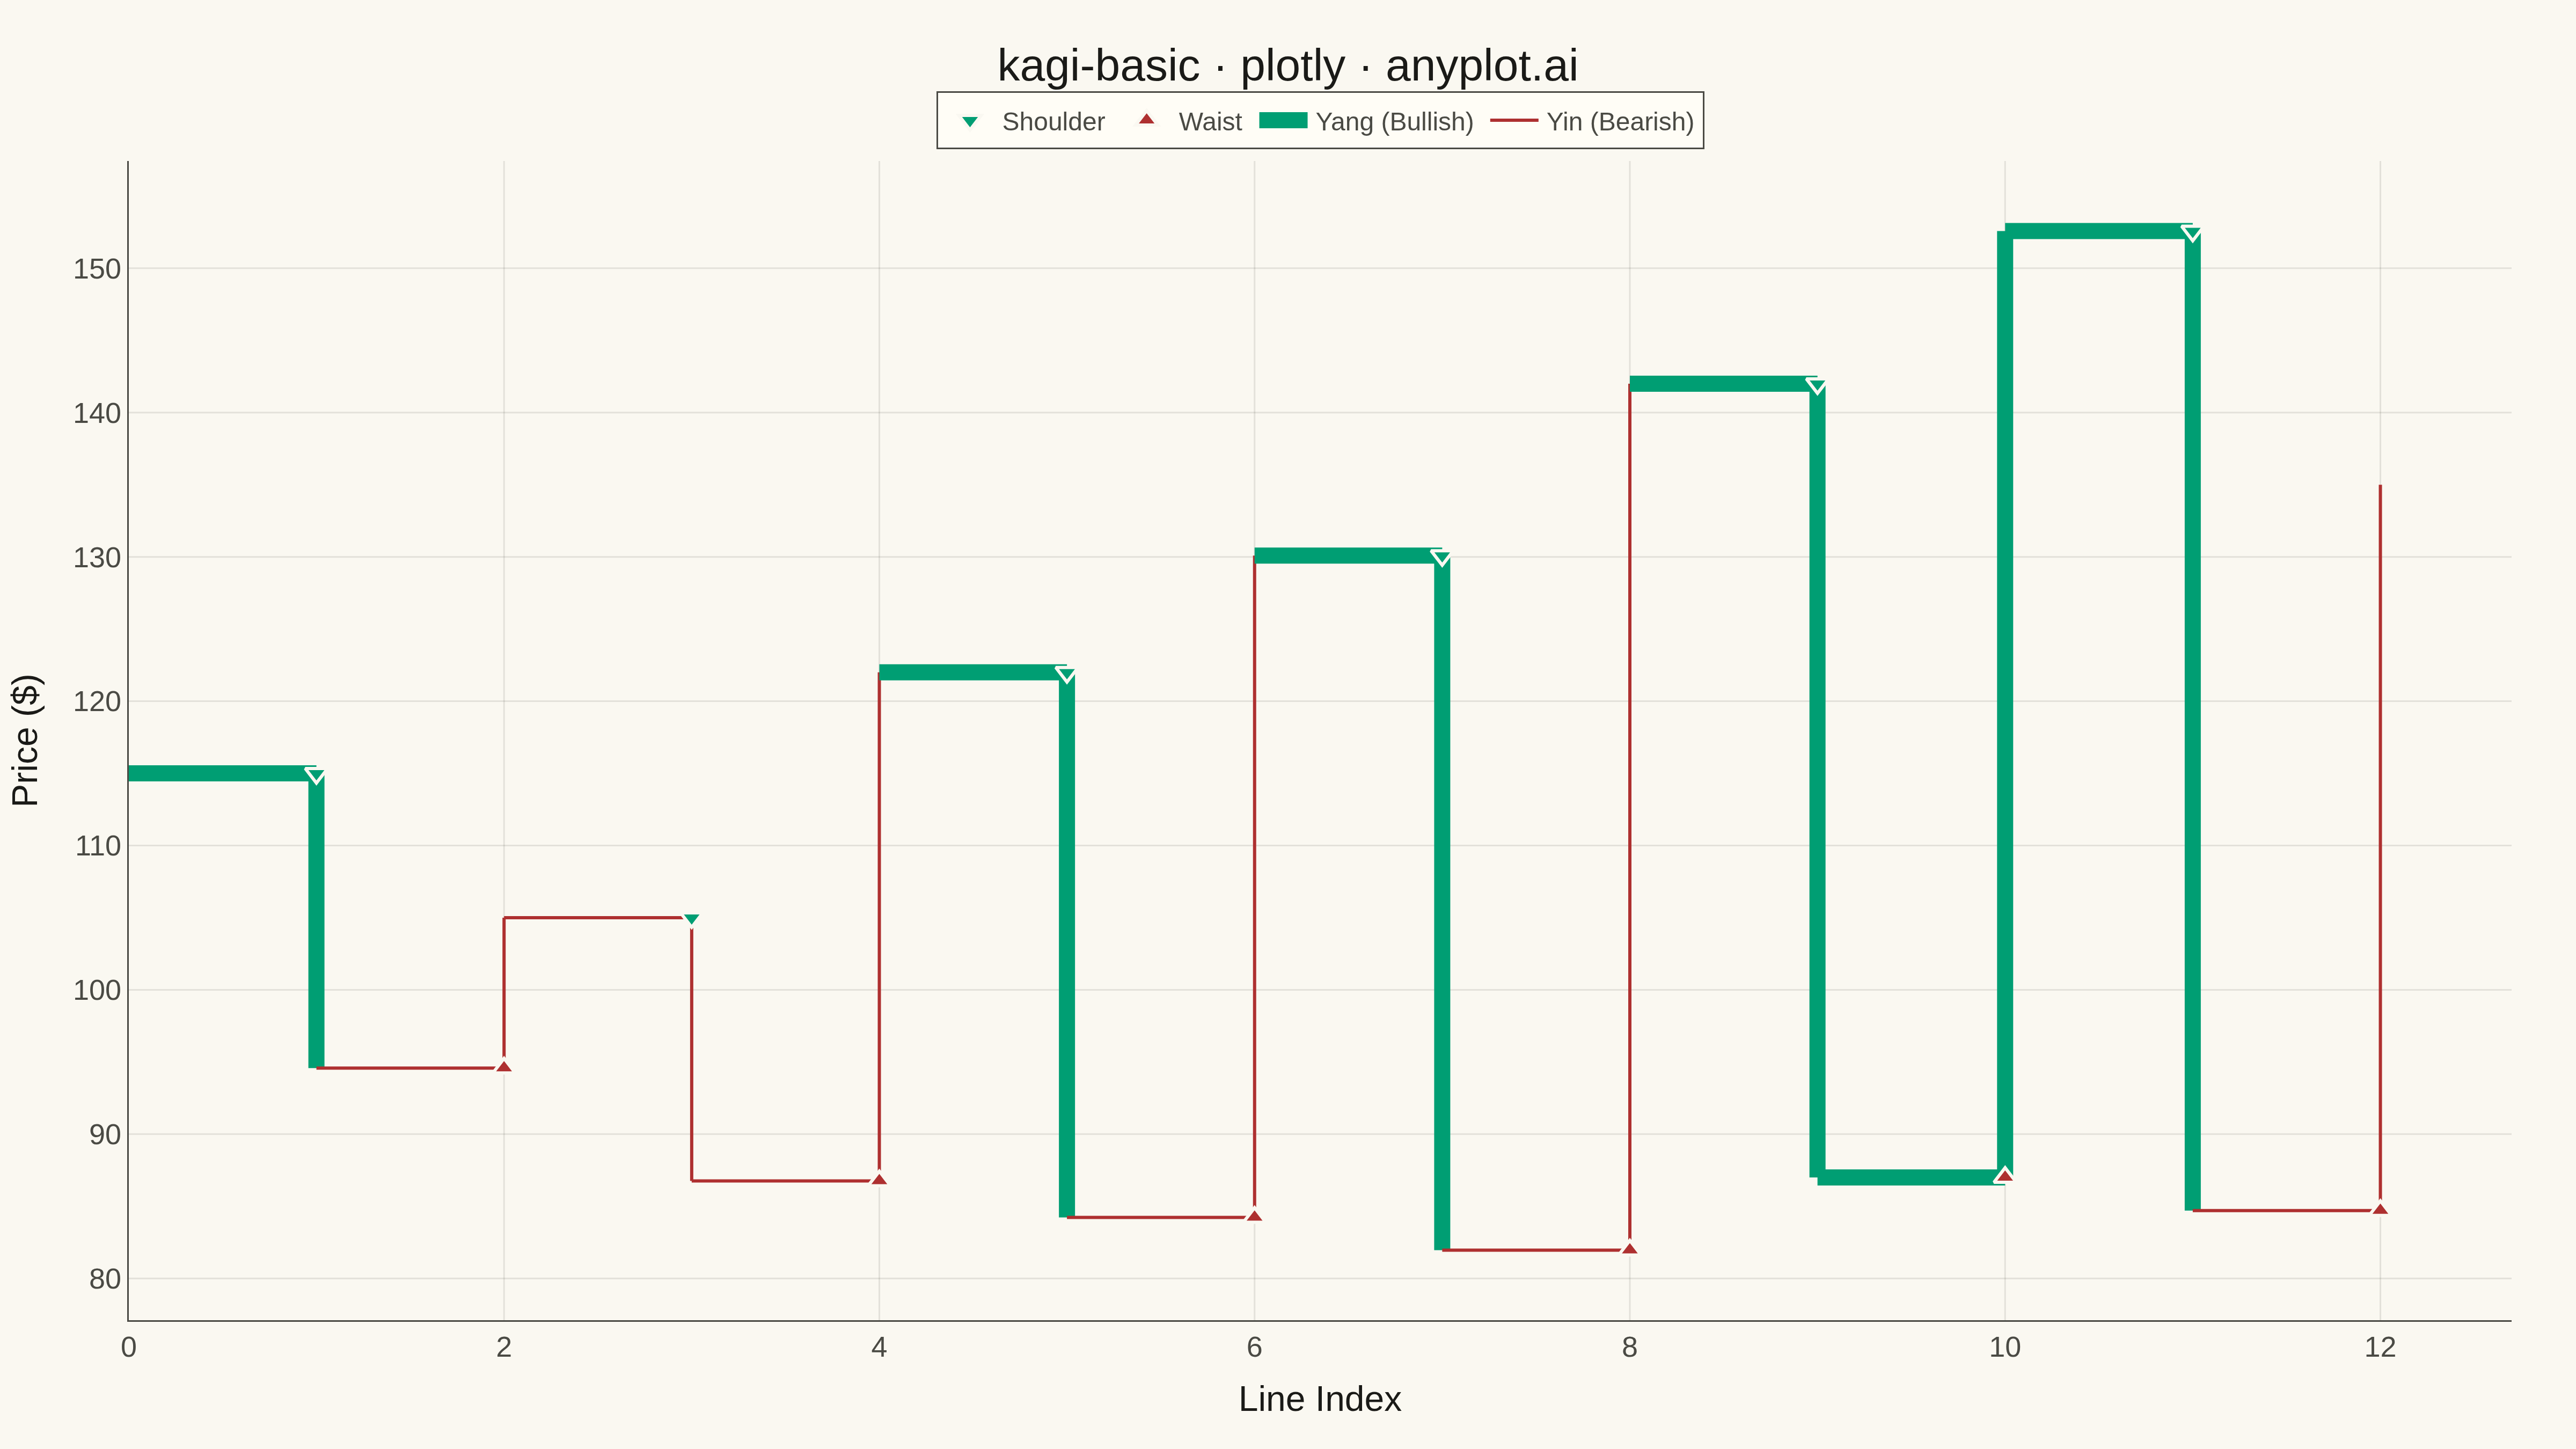
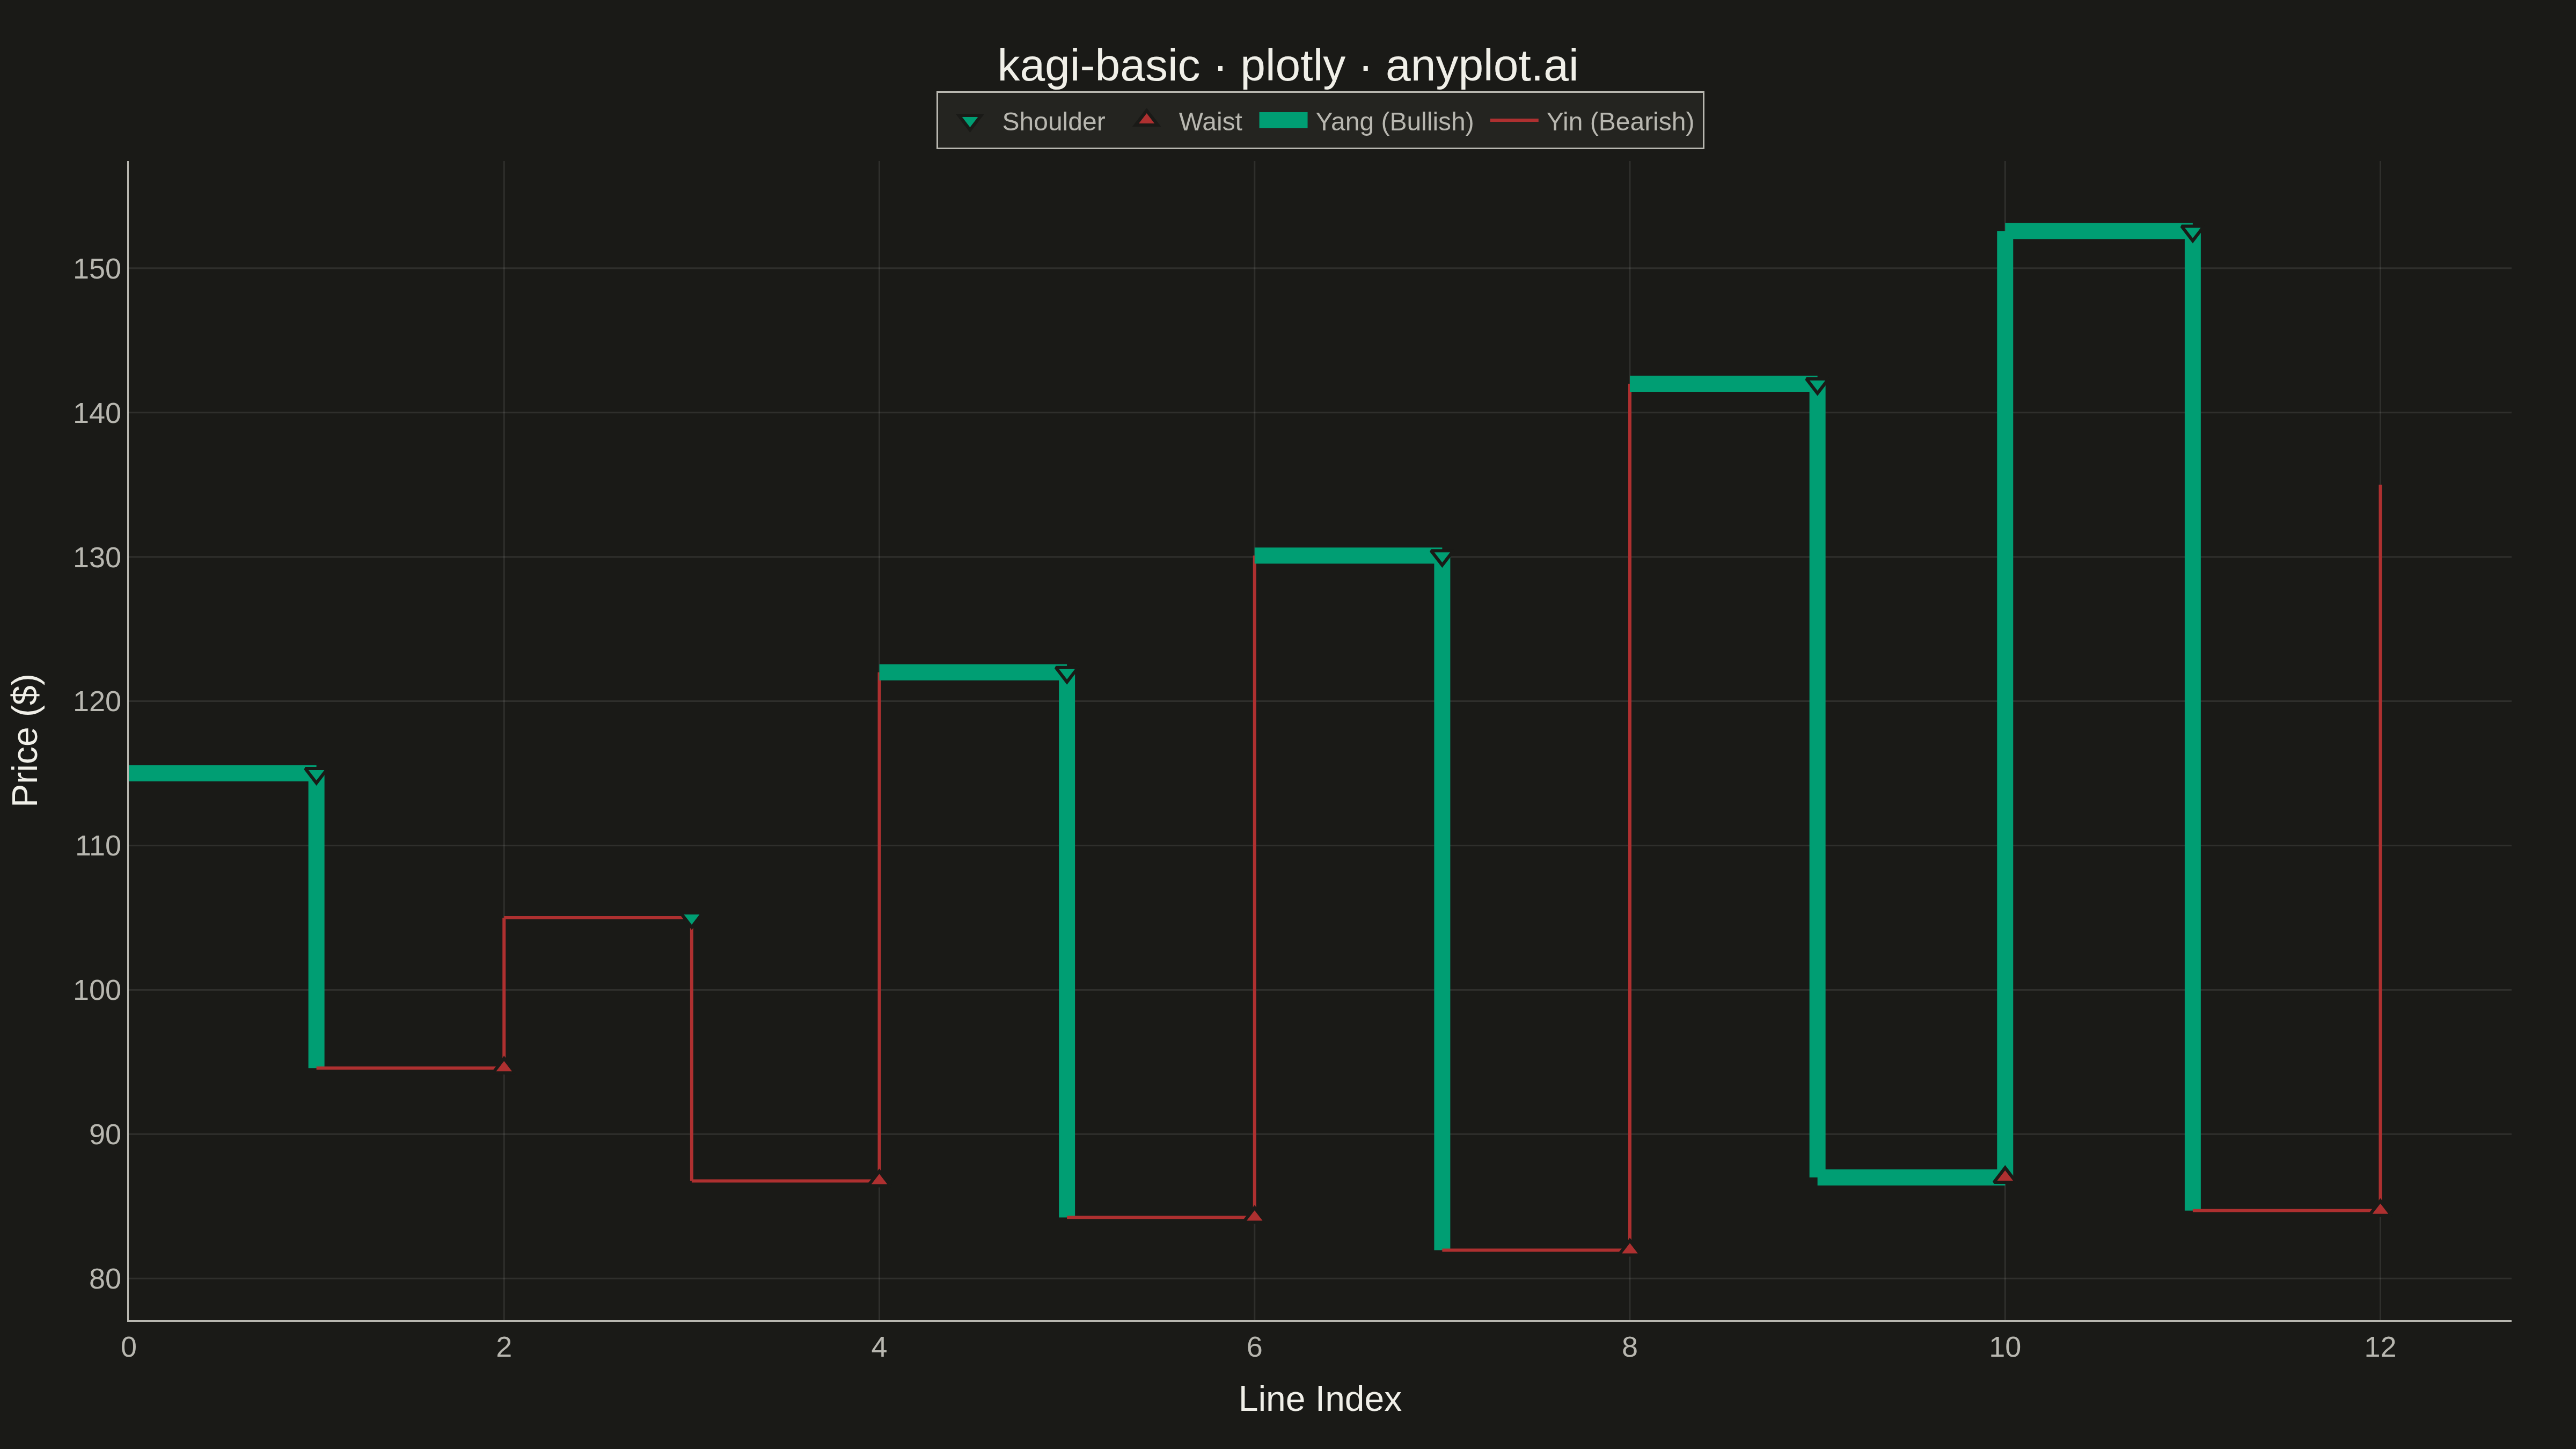
A Kagi chart is a Japanese charting technique that displays price movements using vertical lines of varying thickness. Unlike time-based charts, Kagi charts change direction only when price moves by a significant amount (the reversal threshold), effectively filtering out market noise. Thick lines (yang) indicate uptrends when price exceeds previous highs, while thin lines (yin) show downtrends when price falls below previous lows, making trend identification intuitive.
""" anyplot.ai
kagi-basic: Basic Kagi Chart
Library: plotly 6.7.0 | Python 3.13.13
Quality: 97/100 | Updated: 2026-05-17
"""

import os

import numpy as np
import plotly.graph_objects as go


# Theme tokens (see prompts/default-style-guide.md "Background" + "Theme-adaptive Chrome")
THEME = os.getenv("ANYPLOT_THEME", "light")
PAGE_BG = "#FAF8F1" if THEME == "light" else "#1A1A17"
ELEVATED_BG = "#FFFDF6" if THEME == "light" else "#242420"
INK = "#1A1A17" if THEME == "light" else "#F0EFE8"
INK_SOFT = "#4A4A44" if THEME == "light" else "#B8B7B0"
GRID = "rgba(26,26,23,0.10)" if THEME == "light" else "rgba(240,239,232,0.10)"

# Okabe-Ito palette: green for yang (bullish), vermillion for yin (bearish)
YANG_COLOR = "#009E73"  # Okabe-Ito position 1 - green
YIN_COLOR = "#AE3030"  # imprint red — bearish

# Generate sample price data designed to demonstrate multiple yang/yin transitions
np.random.seed(42)

# Create price series with clear swings that will break through shoulders and waists
prices_list = [100.0]

# Generate data with deliberate swings to create yang/yin transitions
# Key: Price must break above previous shoulder for yang, below previous waist for yin
segments = [
    # (target_price, volatility, n_steps) - target relative to previous end
    (15, 0.4, 15),  # Up to ~115
    (-20, 0.5, 18),  # Down to ~95 (below 100 waist -> YIN)
    (10, 0.4, 12),  # Up to ~105
    (-18, 0.5, 15),  # Down to ~87 (below 95 waist -> still YIN)
    (35, 0.5, 20),  # Up to ~122 (above 115 shoulder -> YANG!)
    (-15, 0.4, 12),  # Down to ~107
    (-22, 0.5, 18),  # Down to ~85 (below 87 waist -> YIN!)
    (25, 0.4, 15),  # Up to ~110
    (20, 0.5, 15),  # Up to ~130 (above 122 shoulder -> YANG!)
    (-18, 0.4, 12),  # Down to ~112
    (-30, 0.5, 20),  # Down to ~82 (below 85 waist -> YIN!)
    (35, 0.5, 18),  # Up to ~117
    (25, 0.5, 15),  # Up to ~142 (above 130 shoulder -> YANG!)
    (-20, 0.4, 12),  # Down to ~122
    (-35, 0.5, 20),  # Down to ~87 (below 82 waist -> YIN!)
    (40, 0.5, 18),  # Up to ~127
    (25, 0.5, 15),  # Up to ~152 (above 142 shoulder -> YANG!)
    (-22, 0.4, 15),  # Down to ~130
    (-45, 0.5, 22),  # Down to ~85 (below 87 waist -> YIN!)
    (30, 0.5, 15),  # Up to ~115
    (20, 0.5, 12),  # Up to ~135
]

for target_move, vol, n_steps in segments:
    start = prices_list[-1]
    # Generate smooth movement with noise
    base_trend = np.linspace(0, target_move, n_steps)
    noise = np.cumsum(np.random.normal(0, vol, n_steps))
    noise = noise - noise[-1] * np.linspace(0, 1, n_steps)  # Trend back to target
    segment_prices = start + base_trend + noise
    prices_list.extend(segment_prices.tolist())

prices = np.array(prices_list)

# Kagi chart parameters - 3% reversal threshold
reversal_pct = 0.03

# Build Kagi chart data with yang/yin tracking at reversal points
kagi_points = []  # List of (x, y, is_yang) tuples
current_direction = 1  # 1 = up, -1 = down
current_high = prices[0]
current_low = prices[0]
line_index = 0
is_yang = True

# Track shoulders (local highs) and waists (local lows) for yang/yin transitions
prev_shoulder = prices[0]  # Previous local high (reversal point from up to down)
prev_waist = prices[0]  # Previous local low (reversal point from down to up)

# Start with initial point
kagi_points.append((0, prices[0], is_yang))

for price in prices[1:]:
    if current_direction == 1:  # Currently moving up
        if price > current_high:
            # Continue uptrend - extend the line
            current_high = price
            # Check if we break above previous shoulder -> become yang
            if price > prev_shoulder and not is_yang:
                is_yang = True
            # Update last point
            kagi_points[-1] = (kagi_points[-1][0], price, is_yang)
        elif price <= current_high * (1 - reversal_pct):
            # Reversal down - record shoulder and add new descending line
            prev_shoulder = current_high  # This becomes a shoulder
            line_index += 1
            # Add horizontal connector at same y (shoulder)
            kagi_points.append((line_index, kagi_points[-1][1], is_yang))
            # Add new descending point
            kagi_points.append((line_index, price, is_yang))
            current_direction = -1
            current_low = price
    else:  # Currently moving down
        if price < current_low:
            # Continue downtrend - extend the line
            current_low = price
            # Check if we break below previous waist -> become yin
            if price < prev_waist and is_yang:
                is_yang = False
            # Update last point
            kagi_points[-1] = (kagi_points[-1][0], price, is_yang)
        elif price >= current_low * (1 + reversal_pct):
            # Reversal up - record waist and add new ascending line
            prev_waist = current_low  # This becomes a waist
            line_index += 1
            # Add horizontal connector at same y (waist)
            kagi_points.append((line_index, kagi_points[-1][1], is_yang))
            # Add new ascending point
            kagi_points.append((line_index, price, is_yang))
            current_direction = 1
            current_high = price

# Extract x, y coordinates and yang/yin states
kagi_x = [p[0] for p in kagi_points]
kagi_y = [p[1] for p in kagi_points]
yang_yin = [p[2] for p in kagi_points]

# Create figure
fig = go.Figure()

# Draw Kagi lines segment by segment
i = 0
while i < len(kagi_x) - 1:
    x_seg = [kagi_x[i], kagi_x[i + 1]]
    y_seg = [kagi_y[i], kagi_y[i + 1]]

    # Determine if this segment is yang or yin
    is_yang_seg = yang_yin[i]

    # Color and width based on yang/yin (per spec: green for yang, red for yin)
    # Using 10/2 width ratio for strong visual differentiation
    if is_yang_seg:
        color = YANG_COLOR  # Green for yang (bullish)
        width = 10
    else:
        color = YIN_COLOR  # Vermillion for yin (bearish)
        width = 2

    # Add line segment with hover information
    trend_type = "Yang (Bullish)" if is_yang_seg else "Yin (Bearish)"
    fig.add_trace(
        go.Scatter(
            x=x_seg,
            y=y_seg,
            mode="lines",
            line={"color": color, "width": width},
            showlegend=False,
            hovertemplate=f"<b>{trend_type}</b><br>Price: ${'{y:.2f}'}<extra></extra>",
        )
    )
    i += 1

# Mark reversal points (shoulders and waists) with small markers for clarity
# Find horizontal segments (where x changes but y stays same)
shoulder_x, shoulder_y = [], []
waist_x, waist_y = [], []

for i in range(len(kagi_x) - 2):
    # Horizontal segment: x changes, y stays same
    if kagi_x[i] != kagi_x[i + 1] and abs(kagi_y[i] - kagi_y[i + 1]) < 0.01:
        # Look at next segment to determine if shoulder or waist
        if i + 2 < len(kagi_y) and kagi_y[i + 2] < kagi_y[i + 1]:
            # Price going down = shoulder (local high)
            shoulder_x.append(kagi_x[i + 1])
            shoulder_y.append(kagi_y[i + 1])
        elif i + 2 < len(kagi_y) and kagi_y[i + 2] > kagi_y[i + 1]:
            # Price going up = waist (local low)
            waist_x.append(kagi_x[i + 1])
            waist_y.append(kagi_y[i + 1])

# Add shoulder markers (local highs where trend reverses down)
if shoulder_x:
    fig.add_trace(
        go.Scatter(
            x=shoulder_x,
            y=shoulder_y,
            mode="markers",
            marker={"symbol": "triangle-down", "size": 12, "color": YANG_COLOR, "line": {"width": 2, "color": PAGE_BG}},
            name="Shoulder",
            hovertemplate="<b>Shoulder</b><br>Price: ${y:.2f}<extra></extra>",
        )
    )

# Add waist markers (local lows where trend reverses up)
if waist_x:
    fig.add_trace(
        go.Scatter(
            x=waist_x,
            y=waist_y,
            mode="markers",
            marker={"symbol": "triangle-up", "size": 12, "color": YIN_COLOR, "line": {"width": 2, "color": PAGE_BG}},
            name="Waist",
            hovertemplate="<b>Waist</b><br>Price: ${y:.2f}<extra></extra>",
        )
    )

# Add legend entries with Okabe-Ito colors (matching widths)
fig.add_trace(
    go.Scatter(x=[None], y=[None], mode="lines", line={"color": YANG_COLOR, "width": 10}, name="Yang (Bullish)")
)
fig.add_trace(go.Scatter(x=[None], y=[None], mode="lines", line={"color": YIN_COLOR, "width": 2}, name="Yin (Bearish)"))

# Layout with theme-adaptive styling
fig.update_layout(
    title={
        "text": "kagi-basic · plotly · anyplot.ai",
        "font": {"size": 28, "color": INK},
        "x": 0.5,
        "xanchor": "center",
    },
    xaxis={
        "title": {"text": "Line Index", "font": {"size": 22, "color": INK}},
        "tickfont": {"size": 18, "color": INK_SOFT},
        "showgrid": True,
        "gridwidth": 1,
        "gridcolor": GRID,
        "linecolor": INK_SOFT,
        "zerolinecolor": INK_SOFT,
    },
    yaxis={
        "title": {"text": "Price ($)", "font": {"size": 22, "color": INK}},
        "tickfont": {"size": 18, "color": INK_SOFT},
        "showgrid": True,
        "gridwidth": 1,
        "gridcolor": GRID,
        "linecolor": INK_SOFT,
        "zerolinecolor": INK_SOFT,
    },
    paper_bgcolor=PAGE_BG,
    plot_bgcolor=PAGE_BG,
    legend={
        "font": {"size": 16, "color": INK_SOFT},
        "bgcolor": ELEVATED_BG,
        "bordercolor": INK_SOFT,
        "borderwidth": 1,
        "orientation": "h",
        "yanchor": "bottom",
        "y": 1.01,
        "xanchor": "center",
        "x": 0.5,
    },
    margin={"l": 80, "r": 40, "t": 100, "b": 80},
    hovermode="x unified",
)

# Save as PNG (4800x2700 px) and HTML
fig.write_image(f"plot-{THEME}.png", width=1600, height=900, scale=3)
fig.write_html(f"plot-{THEME}.html", include_plotlyjs="cdn")
Runnable source as JSON, for any HTTP client: https://api.anyplot.ai/specs/kagi-basic/plotly/code. Any spec id and library id listed in llms-full.txt fit the same URL shape; every URL below is complete and callable.
{
  "spec_id": "kagi-basic",
  "language": "python",
  "library": "plotly",
  "page": "https://anyplot.ai/kagi-basic/python/plotly",
  "hub": "https://anyplot.ai/kagi-basic",
  "code_json": "https://api.anyplot.ai/specs/kagi-basic/plotly/code",
  "spec_json": "https://api.anyplot.ai/specs/kagi-basic",
  "render_light_png": "https://storage.googleapis.com/anyplot-images/plots/kagi-basic/python/plotly/plot-light.png",
  "render_dark_png": "https://storage.googleapis.com/anyplot-images/plots/kagi-basic/python/plotly/plot-dark.png",
  "interactive_light_html": "https://storage.googleapis.com/anyplot-images/plots/kagi-basic/python/plotly/plot-light.html",
  "interactive_dark_html": "https://storage.googleapis.com/anyplot-images/plots/kagi-basic/python/plotly/plot-dark.html",
  "quality_score": 97.0,
  "license": "MIT",
  "guide": "https://anyplot.ai/llms.txt"
}
Part of Basic Kagi Chart on anyplot.ai.