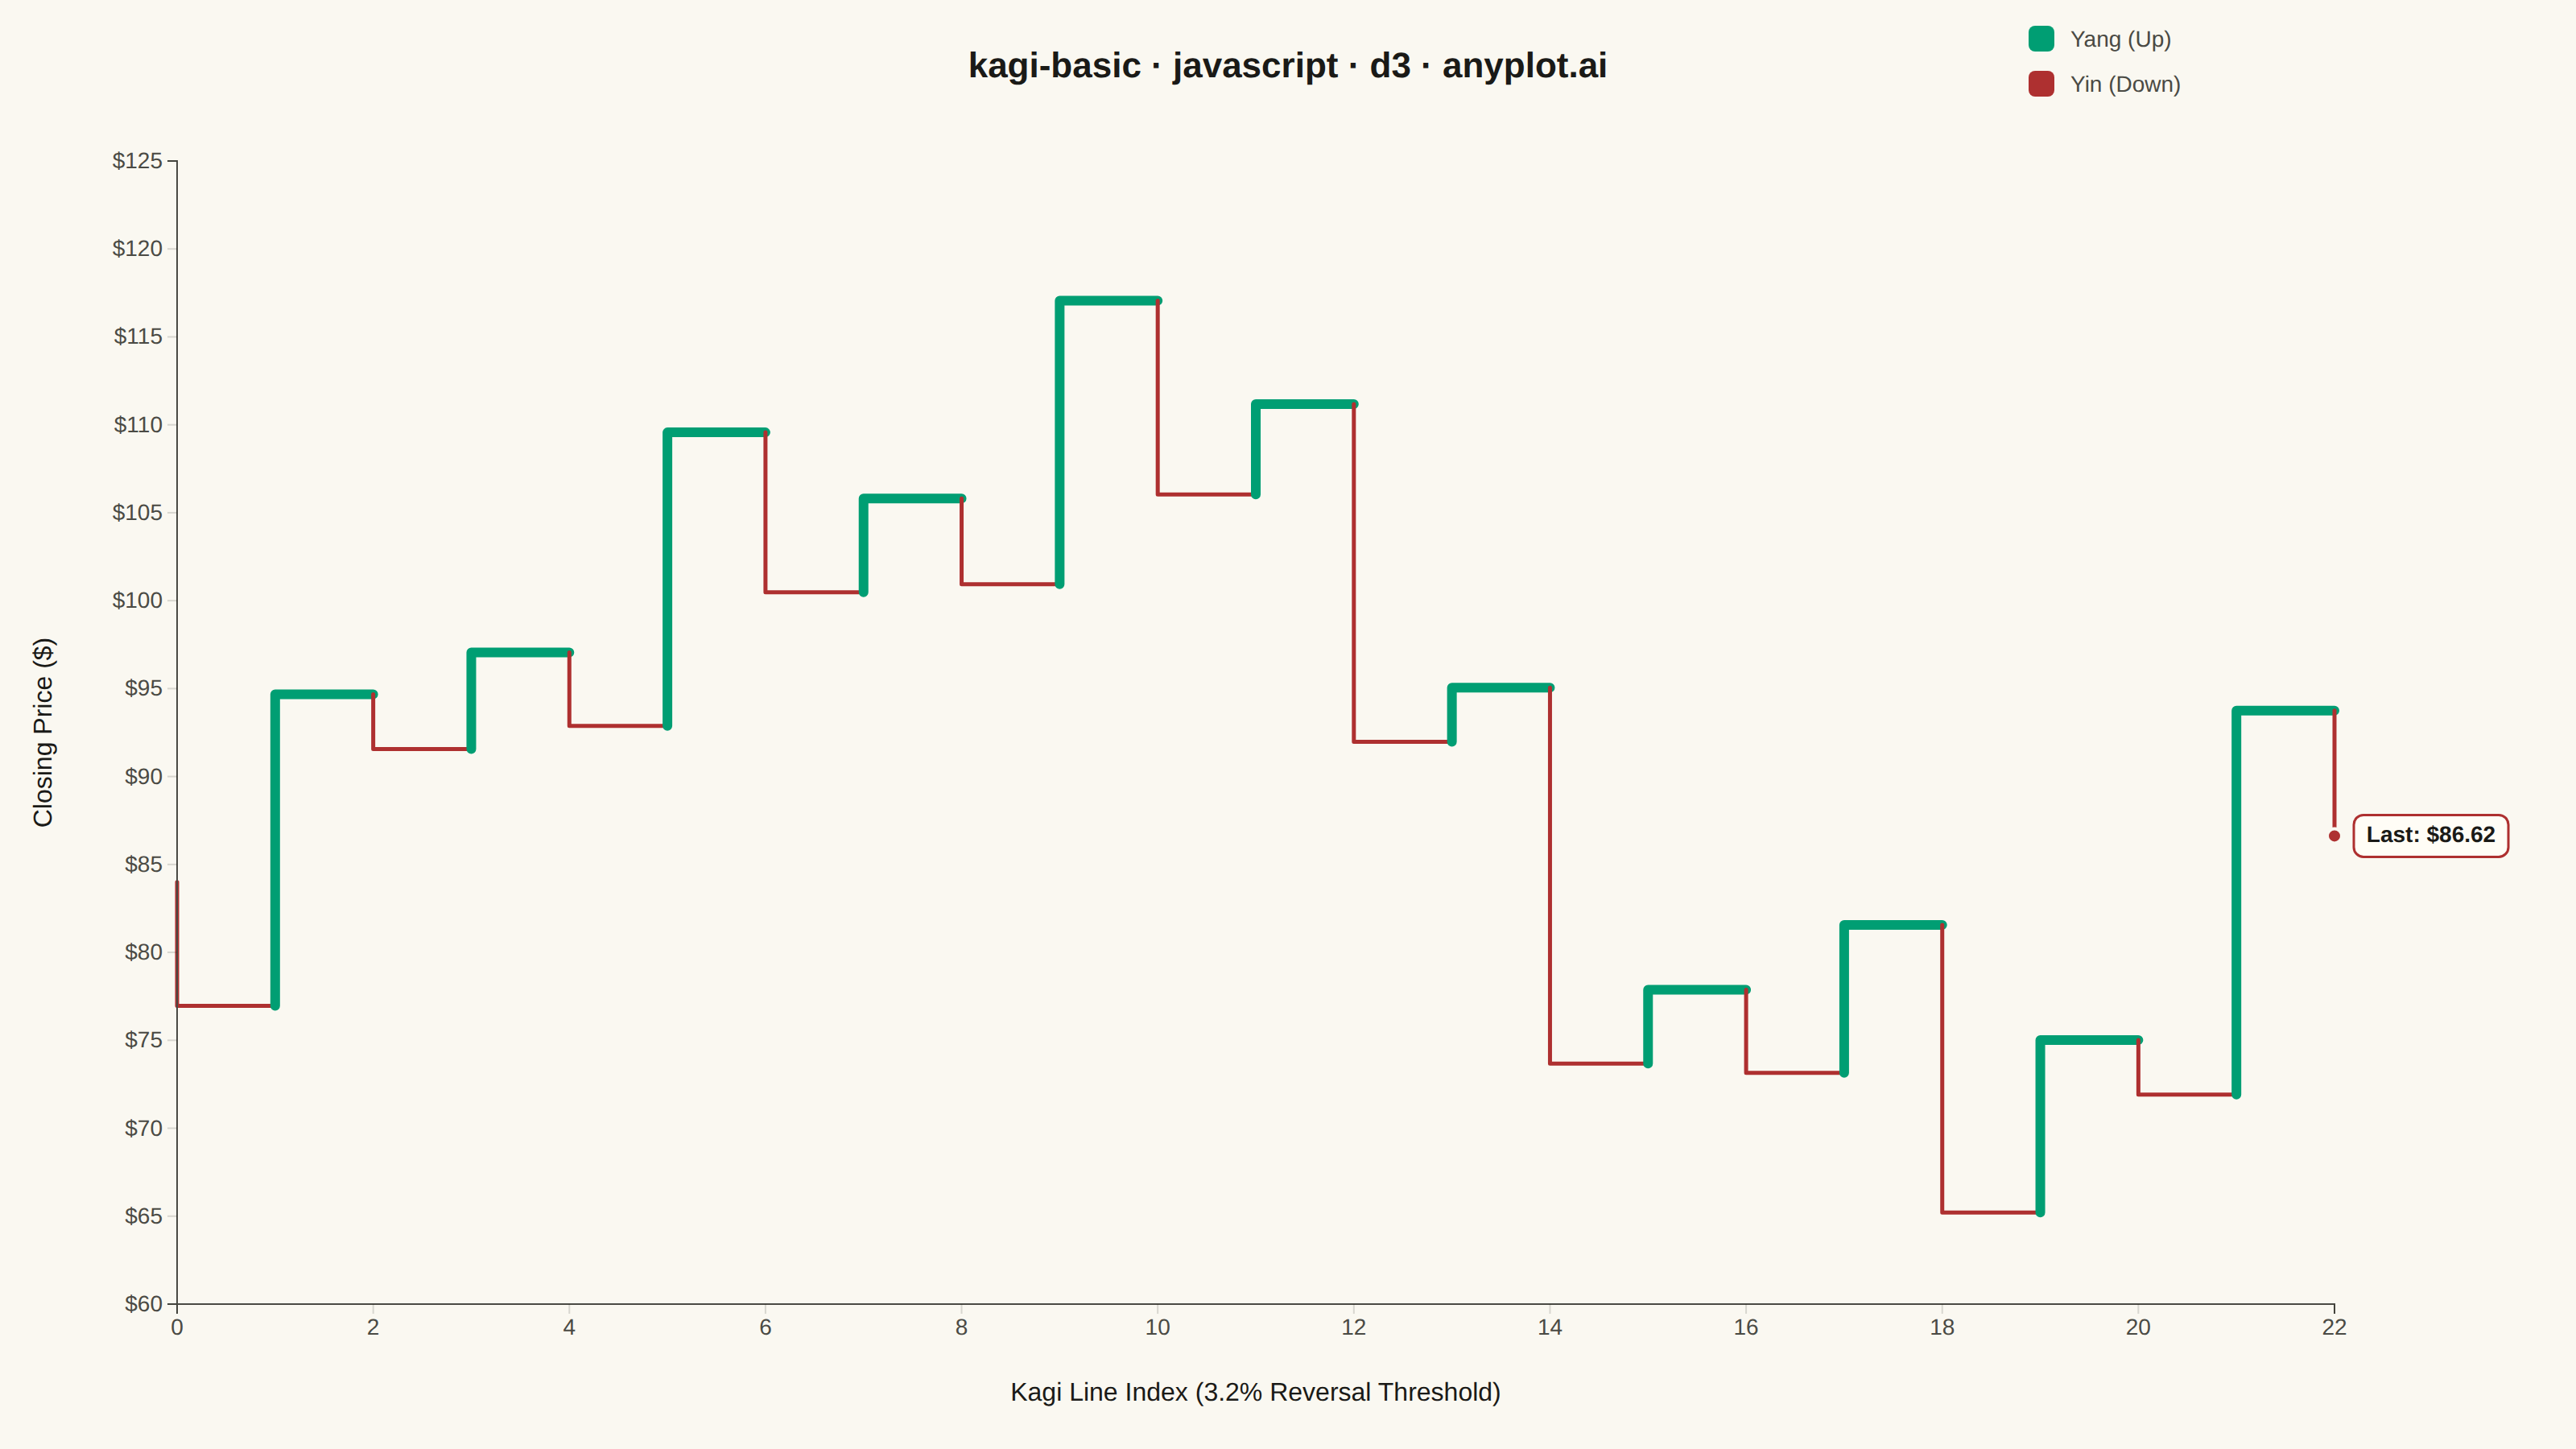
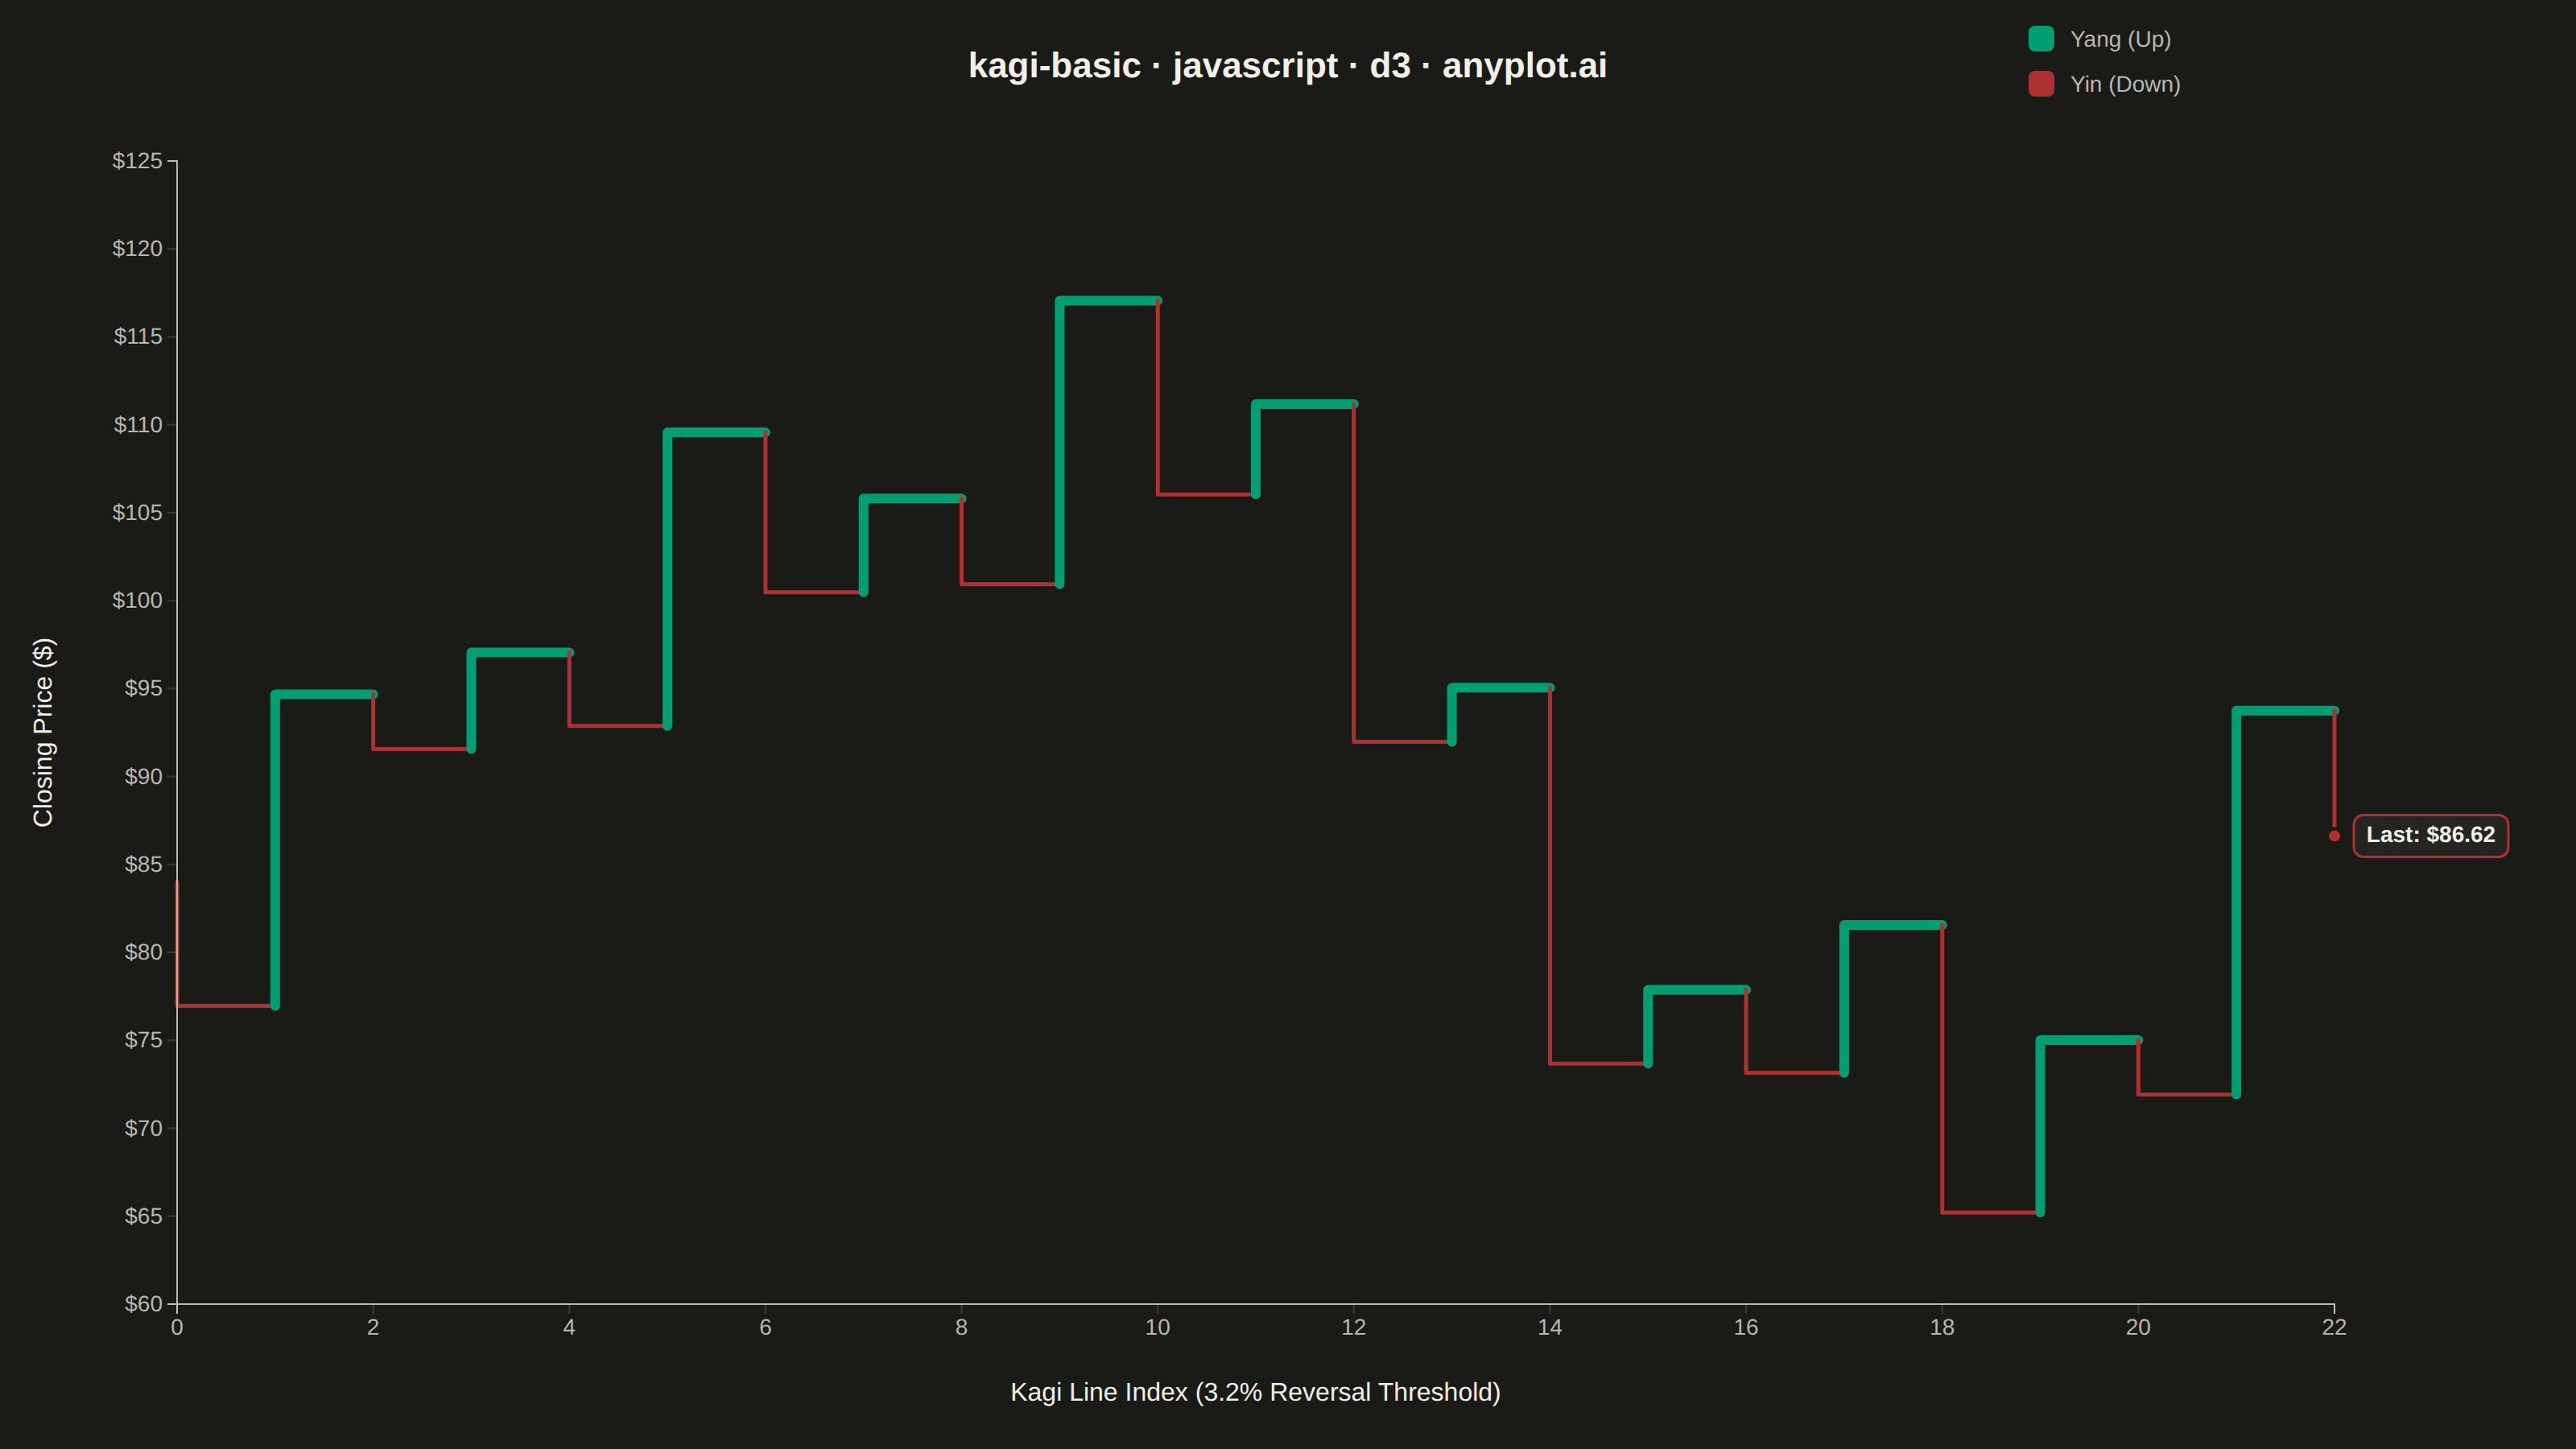
The same plot in 14 other libraries — JavaScript: Chart.js, Apache ECharts, Highcharts, MUI X Charts; Python: Altair, Bokeh, lets-plot, Matplotlib, Plotly, plotnine, Pygal, Seaborn; R: ggplot2; Julia: Makie.jl. Compare all 15 side by side: Basic Kagi Chart in Python, R, Julia and JavaScript.
A Kagi chart is a Japanese charting technique that displays price movements using vertical lines of varying thickness. Unlike time-based charts, Kagi charts change direction only when price moves by a significant amount (the reversal threshold), effectively filtering out market noise. Thick lines (yang) indicate uptrends when price exceeds previous highs, while thin lines (yin) show downtrends when price falls below previous lows, making trend identification intuitive.
// anyplot.ai
// kagi-basic: Basic Kagi Chart
// Library: d3 7.9.0 | JavaScript 22.23.2
// Quality: 91/100 | Created: 2026-09-02

const t = window.ANYPLOT_TOKENS;
const { width, height } = window.ANYPLOT_SIZE;
const margin = { top: 100, right: 150, bottom: 90, left: 110 };
const iw = width - margin.left - margin.right;
const ih = height - margin.top - margin.bottom;

// --- Data: deterministic daily closes (mulberry32 PRNG, fixed seed) --------
function mulberry32(seed) {
  return function () {
    seed |= 0;
    seed = (seed + 0x6d2b79f5) | 0;
    let x = Math.imul(seed ^ (seed >>> 15), 1 | seed);
    x = (x + Math.imul(x ^ (x >>> 7), 61 | x)) ^ x;
    return ((x ^ (x >>> 14)) >>> 0) / 4294967296;
  };
}
const rand = mulberry32(20260108);

const numDays = 320;
const regimeDrift = [0.0012, -0.001, 0.002, -0.0016, 0.0008, -0.0013, 0.0018]; // rotating trend legs
const closes = [84];
for (let i = 1; i < numDays; i++) {
  const regime = regimeDrift[Math.floor(i / 38) % regimeDrift.length];
  const shock = (rand() - 0.5) * 0.055;
  closes.push(Math.max(20, closes[i - 1] * (1 + regime + shock)));
}

// --- Kagi construction: reversal-threshold zigzag over the close series ----
const REVERSAL_PCT = 0.032;

function buildKagiPivots(prices, reversalPct) {
  const pivots = [prices[0]];
  let direction = 0; // 0 = undecided, 1 = up-tracking, -1 = down-tracking
  let extreme = prices[0];

  for (let i = 1; i < prices.length; i++) {
    const p = prices[i];
    if (direction === 0) {
      // Undecided: wait for the first breakout from the starting anchor.
      if (p >= prices[0] * (1 + reversalPct)) {
        direction = 1;
        extreme = p;
      } else if (p <= prices[0] * (1 - reversalPct)) {
        direction = -1;
        extreme = p;
      }
      continue;
    }
    if (direction === 1) {
      if (p > extreme) {
        extreme = p;
      } else if (p <= extreme * (1 - reversalPct)) {
        pivots.push(extreme);
        direction = -1;
        extreme = p;
      }
    } else {
      if (p < extreme) {
        extreme = p;
      } else if (p >= extreme * (1 + reversalPct)) {
        pivots.push(extreme);
        direction = 1;
        extreme = p;
      }
    }
  }
  pivots.push(extreme);
  return pivots;
}

const pivots = buildKagiPivots(closes, REVERSAL_PCT);
const numColumns = pivots.length - 1;

// Each pivot-to-pivot transition is one step-line segment: a vertical move
// to the new pivot, then (except for the final segment) a horizontal
// shoulder/waist carrying it to the next column.
const kagiSegments = [];
for (let i = 0; i < numColumns; i++) {
  const hasShoulder = i < numColumns - 1;
  kagiSegments.push({
    points: [
      { x: i, y: pivots[i] },
      { x: hasShoulder ? i + 1 : i, y: pivots[i + 1] },
    ],
    dir: pivots[i + 1] >= pivots[i] ? "up" : "down",
  });
}

// --- Scales -------------------------------------------------------------
const x = d3
  .scaleLinear()
  .domain([0, numColumns - 1])
  .range([0, iw]);
const yExtent = d3.extent(pivots);
const y = d3
  .scaleLinear()
  .domain([yExtent[0] * 0.97, yExtent[1] * 1.03])
  .nice()
  .range([ih, 0]);

// --- SVG mount -------------------------------------------------------------
const svg = d3
  .select("#container")
  .append("svg")
  .attr("width", width)
  .attr("height", height);
const g = svg
  .append("g")
  .attr("transform", `translate(${margin.left},${margin.top})`);

// --- Kagi lines: thick/green for yang (up), thin/red for yin (down) --------
// Semantic exception (default-style-guide.md): profit/up -> green, loss/down -> red.
const THICK = 6;
const THIN = 2.5;
const upColor = t.palette[0]; // brand green
const downColor = t.palette[4]; // matte red

// Each vertical-then-shoulder segment is a d3-shape path (curveStepBefore),
// not a raw SVG <line>, so the yang/yin step geometry comes from d3.line().
const kagiLine = d3
  .line()
  .x((d) => x(d.x))
  .y((d) => y(d.y))
  .curve(d3.curveStepBefore);

g.selectAll(".kagi-segment")
  .data(kagiSegments)
  .join("path")
  .attr("class", "kagi-segment")
  .attr("fill", "none")
  .attr("d", (d) => kagiLine(d.points))
  .attr("stroke", (d) => (d.dir === "up" ? upColor : downColor))
  .attr("stroke-width", (d) => (d.dir === "up" ? THICK : THIN))
  .attr("stroke-linecap", "round")
  .attr("stroke-linejoin", "round");

// --- Axes --------------------------------------------------------------
const xAxis = g
  .append("g")
  .attr("transform", `translate(0,${ih})`)
  .call(d3.axisBottom(x).ticks(10).tickFormat(d3.format("d")));
const yAxis = g
  .append("g")
  .call(d3.axisLeft(y).tickFormat((d) => `$${d3.format(",.0f")(d)}`));

for (const ax of [xAxis, yAxis]) {
  ax.selectAll("text").attr("fill", t.inkSoft).style("font-size", "14px");
  ax.selectAll("line").attr("stroke", t.grid);
  ax.select(".domain").attr("stroke", t.inkSoft);
}

// --- Axis labels -------------------------------------------------------
g.append("text")
  .attr("x", iw / 2)
  .attr("y", ih + 60)
  .attr("text-anchor", "middle")
  .attr("fill", t.ink)
  .style("font-size", "16px")
  .text(`Kagi Line Index (${d3.format(".1%")(REVERSAL_PCT)} Reversal Threshold)`);

g.append("text")
  .attr("transform", "rotate(-90)")
  .attr("x", -ih / 2)
  .attr("y", -78)
  .attr("text-anchor", "middle")
  .attr("fill", t.ink)
  .style("font-size", "16px")
  .text("Closing Price ($)");

// --- Legend (rounded color chips, no frame per style guide) ----------------
const legendItems = [
  { label: "Yang (Up)", color: upColor },
  { label: "Yin (Down)", color: downColor },
];
const legend = svg
  .append("g")
  .attr("transform", `translate(${width - margin.right - 190}, 24)`);
legendItems.forEach((item, i) => {
  const row = legend.append("g").attr("transform", `translate(0, ${i * 28})`);
  row
    .append("rect")
    .attr("x", 0)
    .attr("y", -8)
    .attr("width", 16)
    .attr("height", 16)
    .attr("rx", 4)
    .attr("fill", item.color);
  row
    .append("text")
    .attr("x", 26)
    .attr("y", 5)
    .attr("fill", t.inkSoft)
    .style("font-size", "14px")
    .text(item.label);
});

// --- End-of-line price callout --------------------------------------------
const lastPivot = pivots[pivots.length - 1];
const lastDir = kagiSegments[kagiSegments.length - 1].dir;
const calloutColor = lastDir === "up" ? upColor : downColor;
const callout = g
  .append("g")
  .attr("transform", `translate(${x(numColumns - 1)},${y(lastPivot)})`);
callout
  .append("circle")
  .attr("r", 4.5)
  .attr("fill", calloutColor)
  .attr("stroke", t.pageBg)
  .attr("stroke-width", 2);
callout
  .append("rect")
  .attr("x", 12)
  .attr("y", -13)
  .attr("width", 96)
  .attr("height", 26)
  .attr("rx", 6)
  .attr("fill", t.elevatedBg)
  .attr("stroke", calloutColor)
  .attr("stroke-width", 1.5);
callout
  .append("text")
  .attr("x", 60)
  .attr("y", 4)
  .attr("text-anchor", "middle")
  .attr("fill", t.ink)
  .style("font-size", "14px")
  .style("font-weight", "600")
  .text(`Last: $${lastPivot.toFixed(2)}`);

// --- Title -------------------------------------------------------------
svg
  .append("text")
  .attr("x", width / 2)
  .attr("y", 48)
  .attr("text-anchor", "middle")
  .attr("fill", t.ink)
  .style("font-size", "22px")
  .style("font-weight", "600")
  .text("kagi-basic · javascript · d3 · anyplot.ai");
Runnable source as JSON, for any HTTP client: https://api.anyplot.ai/specs/kagi-basic/d3/code. Any spec id and library id listed in llms-full.txt fit the same URL shape; every URL below is complete and callable.
{
  "spec_id": "kagi-basic",
  "language": "javascript",
  "library": "d3",
  "page": "https://anyplot.ai/kagi-basic/javascript/d3",
  "hub": "https://anyplot.ai/kagi-basic",
  "code_json": "https://api.anyplot.ai/specs/kagi-basic/d3/code",
  "spec_json": "https://api.anyplot.ai/specs/kagi-basic",
  "render_light_png": "https://storage.googleapis.com/anyplot-images/plots/kagi-basic/javascript/d3/plot-light.png",
  "render_dark_png": "https://storage.googleapis.com/anyplot-images/plots/kagi-basic/javascript/d3/plot-dark.png",
  "interactive_light_html": "https://storage.googleapis.com/anyplot-images/plots/kagi-basic/javascript/d3/plot-light.html",
  "interactive_dark_html": "https://storage.googleapis.com/anyplot-images/plots/kagi-basic/javascript/d3/plot-dark.html",
  "quality_score": 91.0,
  "license": "MIT",
  "guide": "https://anyplot.ai/llms.txt"
}
Part of Basic Kagi Chart on anyplot.ai.