The same plot in 14 other libraries — JavaScript: Chart.js, D3.js, Highcharts, MUI X Charts; Python: Altair, Bokeh, lets-plot, Matplotlib, Plotly, plotnine, Pygal, Seaborn; R: ggplot2; Julia: Makie.jl. Compare all 15 side by side: Basic Kagi Chart in Python, R, Julia and JavaScript.
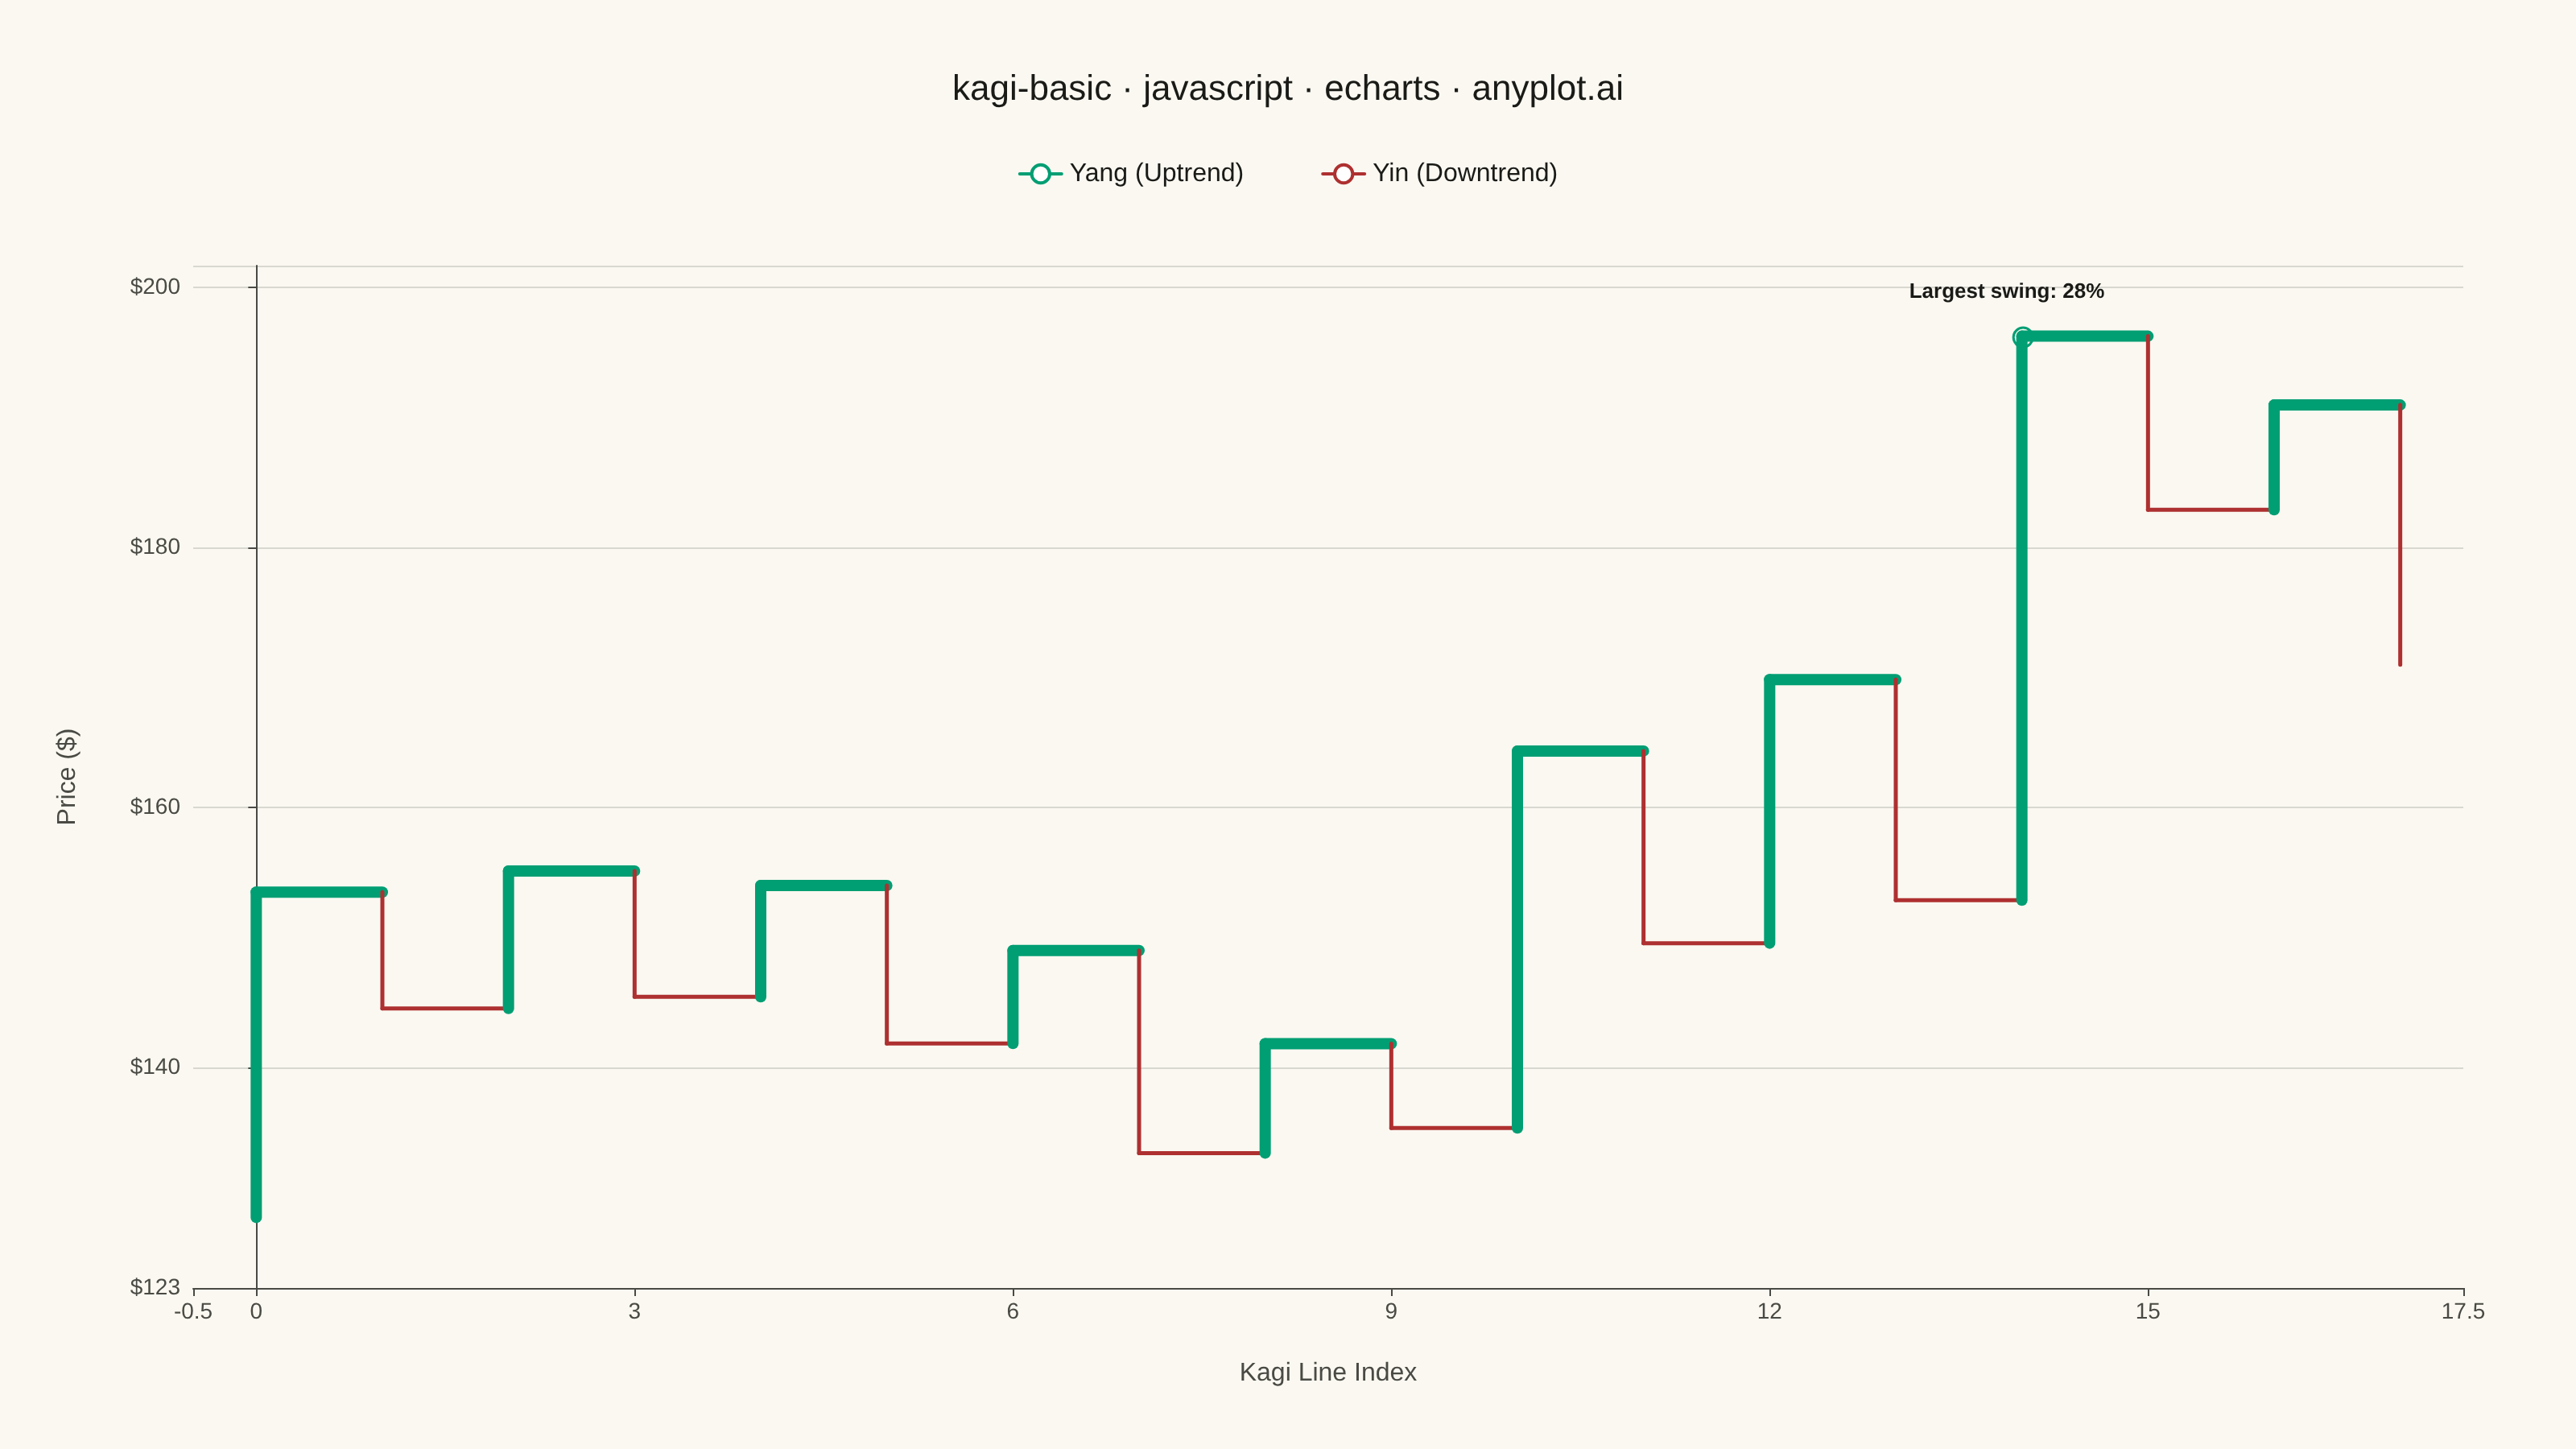
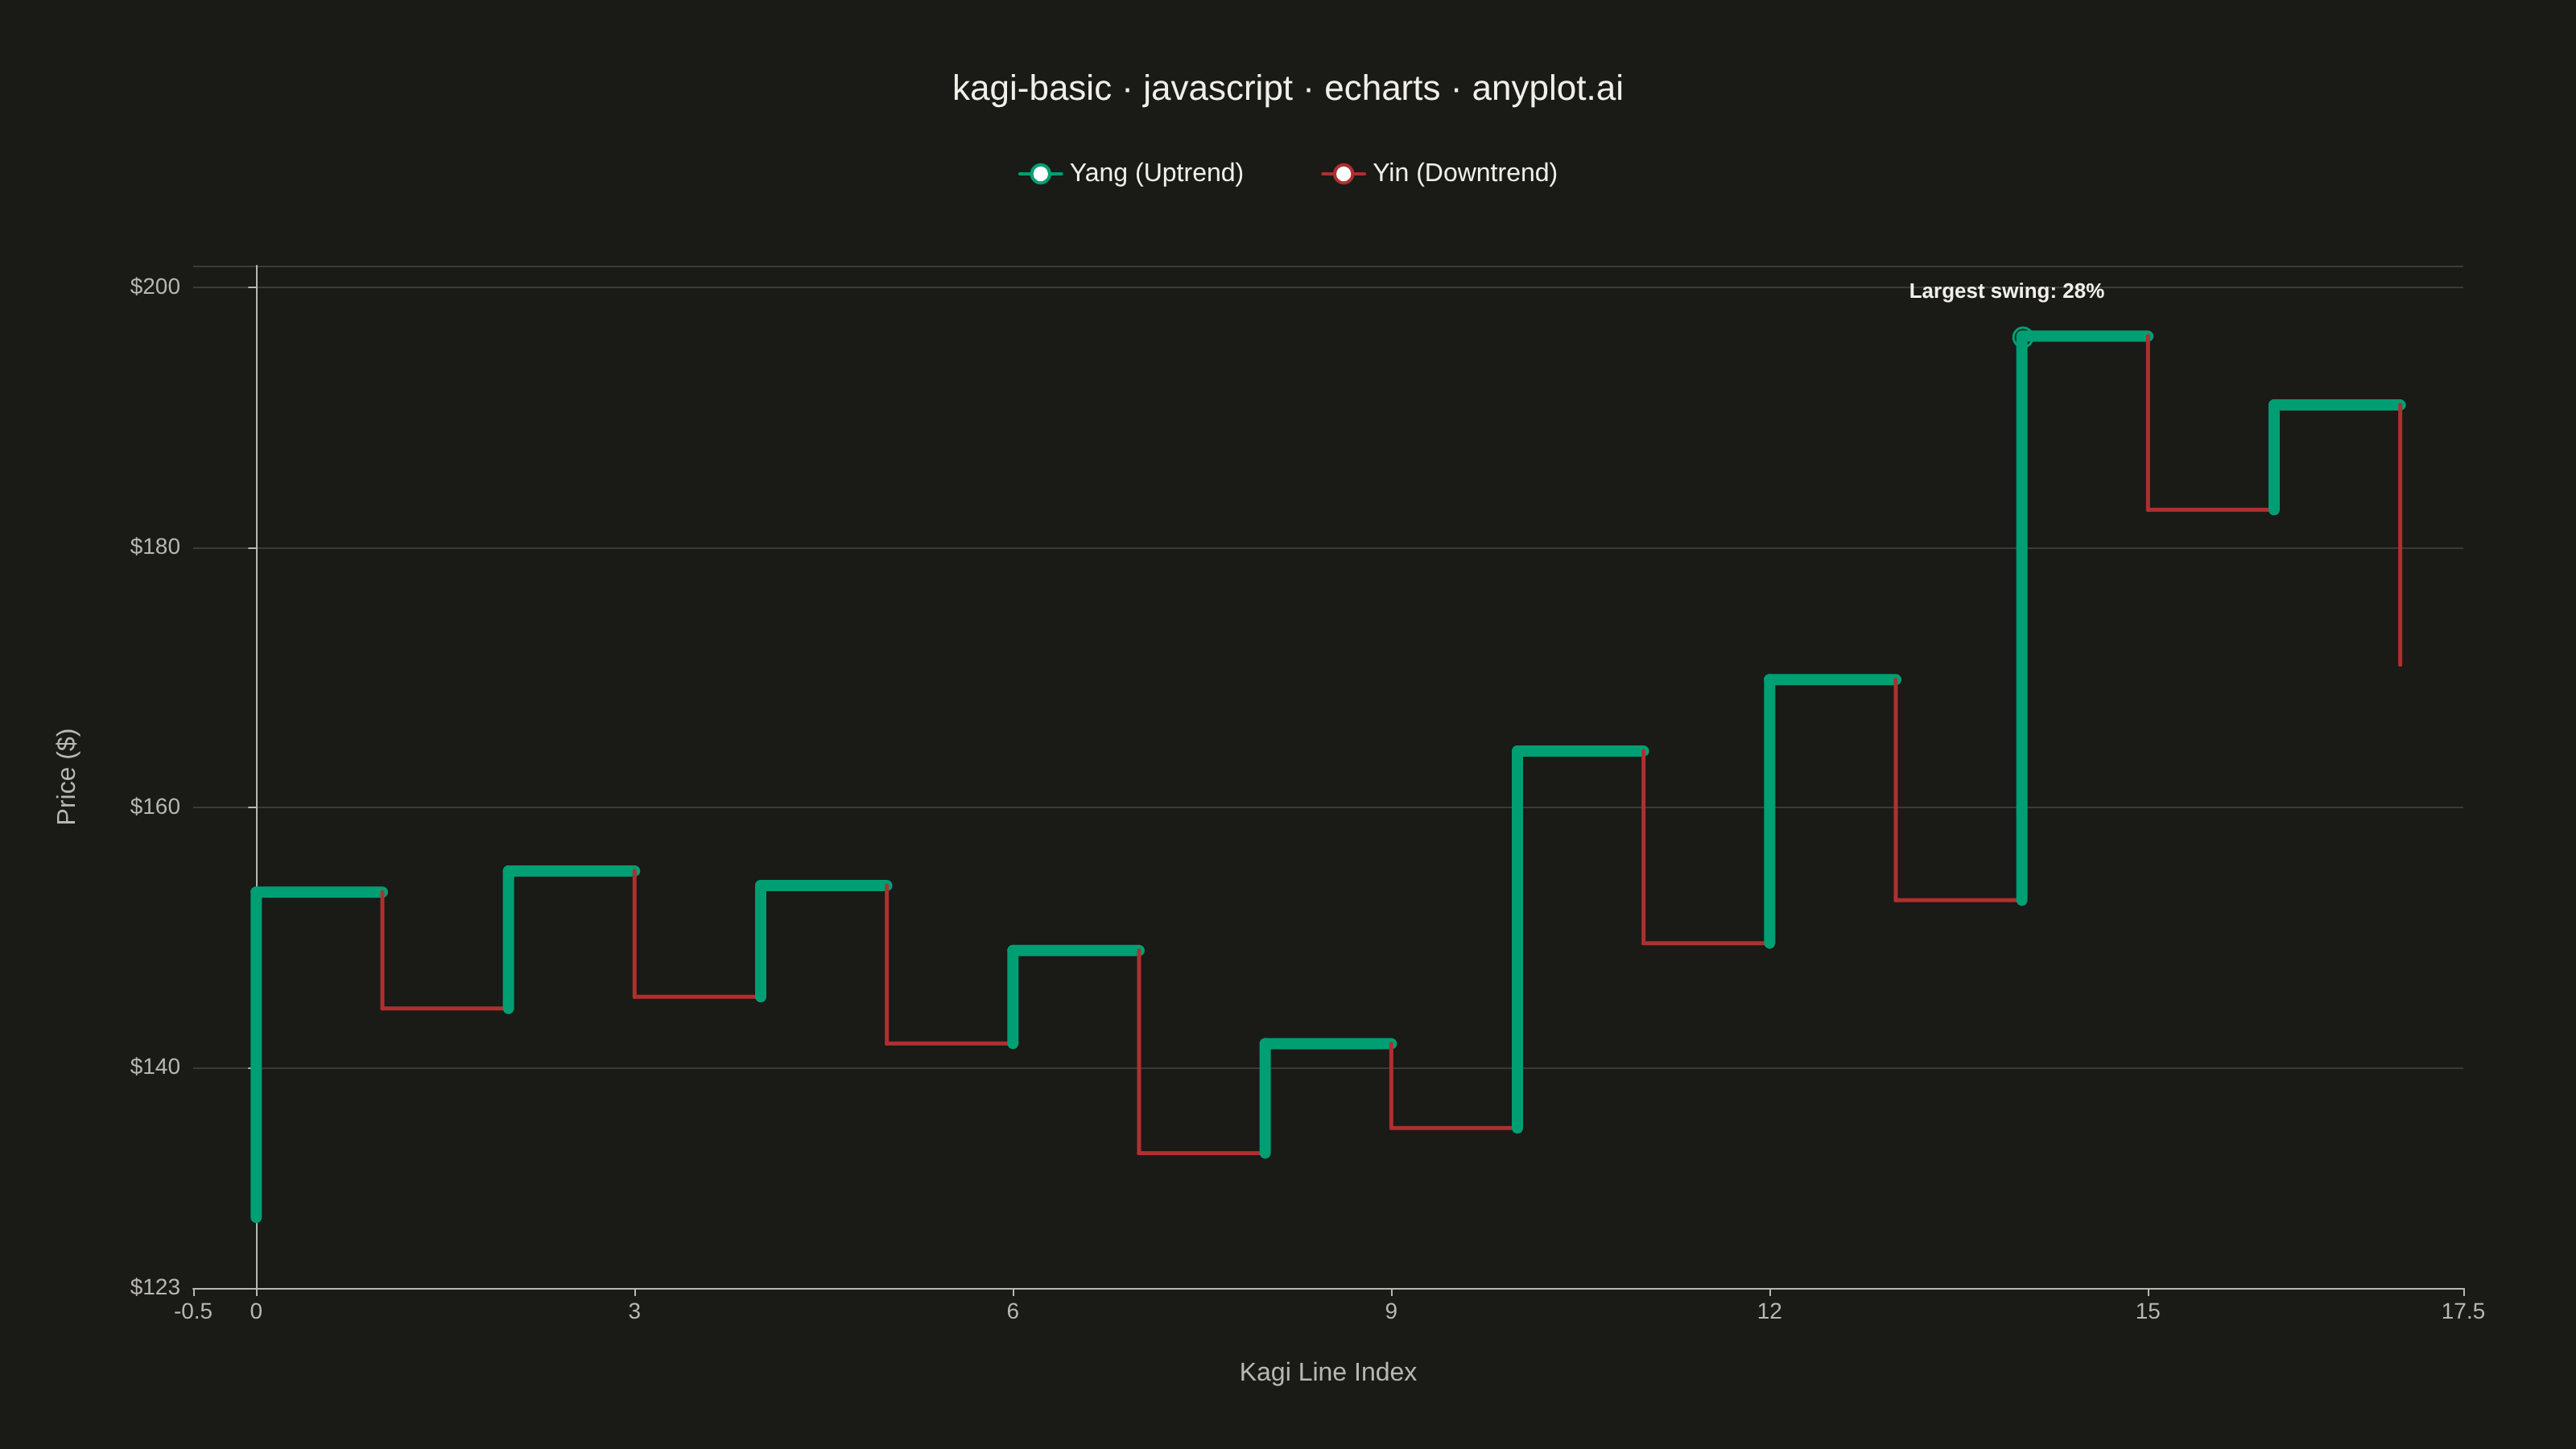
A Kagi chart is a Japanese charting technique that displays price movements using vertical lines of varying thickness. Unlike time-based charts, Kagi charts change direction only when price moves by a significant amount (the reversal threshold), effectively filtering out market noise. Thick lines (yang) indicate uptrends when price exceeds previous highs, while thin lines (yin) show downtrends when price falls below previous lows, making trend identification intuitive.
// anyplot.ai
// kagi-basic: Basic Kagi Chart
// Library: echarts 6.1.0 | JavaScript 22.23.2
// Quality: 91/100 | Created: 2026-09-02
//# anyplot-orientation: landscape

const t = window.ANYPLOT_TOKENS;

// --- Data (in-memory, deterministic) ----------------------------------------
// Daily closing prices via a fixed-seed LCG random walk with mild upward drift.
const makeRng = (seed) => {
  let state = seed >>> 0;
  return () => {
    state = (state * 1664525 + 1013904223) >>> 0;
    return state / 4294967296;
  };
};
const rand = makeRng(42);

const numObservations = 260;
const closePrices = [128.5];
for (let i = 1; i < numObservations; i++) {
  const u1 = Math.max(rand(), 1e-9);
  const u2 = rand();
  const z = Math.sqrt(-2 * Math.log(u1)) * Math.cos(2 * Math.PI * u2);
  const drift = 0.0005;
  const volatility = 0.017;
  closePrices.push(closePrices[i - 1] * (1 + drift + volatility * z));
}

// --- Kagi construction: reversal-threshold swing filter ---------------------
// A new Kagi column only forms once price moves `reversalPct` against the
// current trend; small moves within the threshold are absorbed into the
// running high/low, filtering out time-based noise.
const reversalPct = 0.04;

const kagiColumns = [];
let columnBase = closePrices[0];
let direction = null;
let extreme = closePrices[0];
for (let i = 1; i < closePrices.length; i++) {
  const price = closePrices[i];
  if (direction === null) {
    if (price >= columnBase * (1 + reversalPct)) {
      direction = "up";
      extreme = price;
    } else if (price <= columnBase * (1 - reversalPct)) {
      direction = "down";
      extreme = price;
    }
    continue;
  }
  if (direction === "up") {
    if (price > extreme) {
      extreme = price;
    } else if (price <= extreme * (1 - reversalPct)) {
      kagiColumns.push({ dir: "up", from: columnBase, to: extreme });
      columnBase = extreme;
      direction = "down";
      extreme = price;
    }
  } else {
    if (price < extreme) {
      extreme = price;
    } else if (price >= extreme * (1 + reversalPct)) {
      kagiColumns.push({ dir: "down", from: columnBase, to: extreme });
      columnBase = extreme;
      direction = "up";
      extreme = price;
    }
  }
}
kagiColumns.push({ dir: direction || "up", from: columnBase, to: extreme });

// Flatten columns into drawable segments: one vertical bar per column (yang
// thick/green on up-swings, yin thin/red on down-swings) plus the horizontal
// shoulder/waist connecting each column to the next at the reversal price.
const segments = [];
for (let i = 0; i < kagiColumns.length; i++) {
  const y0 = i === 0 ? kagiColumns[0].from : kagiColumns[i - 1].to;
  const y1 = kagiColumns[i].to;
  segments.push({ kind: "v", x: i, y0, y1, dir: kagiColumns[i].dir });
  if (i < kagiColumns.length - 1) {
    segments.push({ kind: "h", x0: i, x1: i + 1, y: y1, dir: kagiColumns[i].dir });
  }
}

const allPrices = kagiColumns.flatMap((c) => [c.from, c.to]);
const priceMin = Math.min(...allPrices);
const priceMax = Math.max(...allPrices);
const pricePad = (priceMax - priceMin) * 0.08;

// --- Init --------------------------------------------------------------------
const chart = echarts.init(document.getElementById("container"));

// --- Option --------------------------------------------------------------------
chart.setOption({
  animation: false,
  backgroundColor: "transparent",
  title: {
    text: "kagi-basic · javascript · echarts · anyplot.ai",
    left: "center",
    top: 40,
    textStyle: { color: t.ink, fontSize: 22, fontWeight: 500 },
  },
  legend: {
    data: ["Yang (Uptrend)", "Yin (Downtrend)"],
    top: 95,
    left: "center",
    itemGap: 48,
    itemWidth: 26,
    itemHeight: 14,
    textStyle: { color: t.ink, fontSize: 16 },
  },
  grid: { left: 120, right: 70, top: 165, bottom: 100 },
  xAxis: {
    type: "value",
    name: "Kagi Line Index",
    nameLocation: "middle",
    nameGap: 45,
    nameTextStyle: { color: t.inkSoft, fontSize: 16 },
    min: -0.5,
    max: kagiColumns.length - 0.5,
    axisLabel: { color: t.inkSoft, fontSize: 14 },
    axisLine: { lineStyle: { color: t.inkSoft } },
    splitLine: { show: false },
  },
  yAxis: {
    type: "value",
    name: "Price ($)",
    nameLocation: "middle",
    nameGap: 70,
    nameTextStyle: { color: t.inkSoft, fontSize: 16 },
    min: priceMin - pricePad,
    max: priceMax + pricePad,
    axisLabel: { color: t.inkSoft, fontSize: 14, formatter: (v) => `$${v.toFixed(0)}` },
    axisLine: { lineStyle: { color: t.inkSoft } },
    splitLine: { lineStyle: { color: t.grid } },
  },
  series: [
    {
      name: "Yang (Uptrend)",
      type: "line",
      data: [],
      showSymbol: false,
      lineStyle: { color: t.palette[0], width: 7, cap: "round" },
      itemStyle: { color: t.palette[0] },
    },
    {
      name: "Yin (Downtrend)",
      type: "line",
      data: [],
      showSymbol: false,
      lineStyle: { color: t.palette[4], width: 2.5, cap: "round" },
      itemStyle: { color: t.palette[4] },
    },
    {
      name: "Kagi",
      type: "custom",
      encode: { x: 0, y: 1 },
      data: segments.map((s) =>
        s.kind === "v" ? [s.x, (s.y0 + s.y1) / 2] : [(s.x0 + s.x1) / 2, s.y]
      ),
      renderItem: (params, api) => {
        const seg = segments[params.dataIndex];
        const color = seg.dir === "up" ? t.palette[0] : t.palette[4];
        const lineWidth = seg.dir === "up" ? 7 : 2.5;
        const p0 = seg.kind === "v" ? api.coord([seg.x, seg.y0]) : api.coord([seg.x0, seg.y]);
        const p1 = seg.kind === "v" ? api.coord([seg.x, seg.y1]) : api.coord([seg.x1, seg.y]);
        return {
          type: "line",
          shape: { x1: p0[0], y1: p0[1], x2: p1[0], y2: p1[1] },
          style: { stroke: color, lineWidth, lineCap: "round" },
        };
      },
    },
  ],
});

// --- Deliberate flourish: callout on the largest single-column reversal -----
// Marks the column with the biggest shoulder/waist swing so the chart tells a
// story at a glance instead of leaving every column visually equal-weight.
let calloutIdx = 0;
let calloutSwing = 0;
kagiColumns.forEach((c, i) => {
  const swing = Math.abs(c.to - c.from);
  if (swing > calloutSwing) {
    calloutSwing = swing;
    calloutIdx = i;
  }
});
const calloutCol = kagiColumns[calloutIdx];
const calloutPct = Math.round(Math.abs(calloutCol.to / calloutCol.from - 1) * 100);
const calloutY = Math.max(calloutCol.from, calloutCol.to);
const [calloutPx, calloutPy] = chart.convertToPixel({ xAxisIndex: 0, yAxisIndex: 0 }, [
  calloutIdx,
  calloutY,
]);
const calloutColor = calloutCol.dir === "up" ? t.palette[0] : t.palette[4];
const size = window.ANYPLOT_SIZE;
const calloutLeft = Math.min(Math.max(calloutPx - 70, 130), size.width - 230);
const calloutTop = Math.max(calloutPy - 34, 172);
chart.setOption({
  animation: false,
  graphic: [
    {
      type: "circle",
      left: calloutPx - 6,
      top: calloutPy - 6,
      shape: { cx: 6, cy: 6, r: 6 },
      style: { fill: "transparent", stroke: calloutColor, lineWidth: 1.5 },
      z: 10,
    },
    {
      type: "text",
      left: calloutLeft,
      top: calloutTop,
      style: {
        text: `Largest swing: ${calloutPct}%`,
        fill: t.ink,
        fontSize: 13,
        fontWeight: 600,
      },
      z: 10,
    },
  ],
});
Runnable source as JSON, for any HTTP client: https://api.anyplot.ai/specs/kagi-basic/echarts/code. Any spec id and library id listed in llms-full.txt fit the same URL shape; every URL below is complete and callable.
{
  "spec_id": "kagi-basic",
  "language": "javascript",
  "library": "echarts",
  "page": "https://anyplot.ai/kagi-basic/javascript/echarts",
  "hub": "https://anyplot.ai/kagi-basic",
  "code_json": "https://api.anyplot.ai/specs/kagi-basic/echarts/code",
  "spec_json": "https://api.anyplot.ai/specs/kagi-basic",
  "render_light_png": "https://storage.googleapis.com/anyplot-images/plots/kagi-basic/javascript/echarts/plot-light.png",
  "render_dark_png": "https://storage.googleapis.com/anyplot-images/plots/kagi-basic/javascript/echarts/plot-dark.png",
  "interactive_light_html": "https://storage.googleapis.com/anyplot-images/plots/kagi-basic/javascript/echarts/plot-light.html",
  "interactive_dark_html": "https://storage.googleapis.com/anyplot-images/plots/kagi-basic/javascript/echarts/plot-dark.html",
  "quality_score": 91.0,
  "license": "MIT",
  "guide": "https://anyplot.ai/llms.txt"
}
Part of Basic Kagi Chart on anyplot.ai.