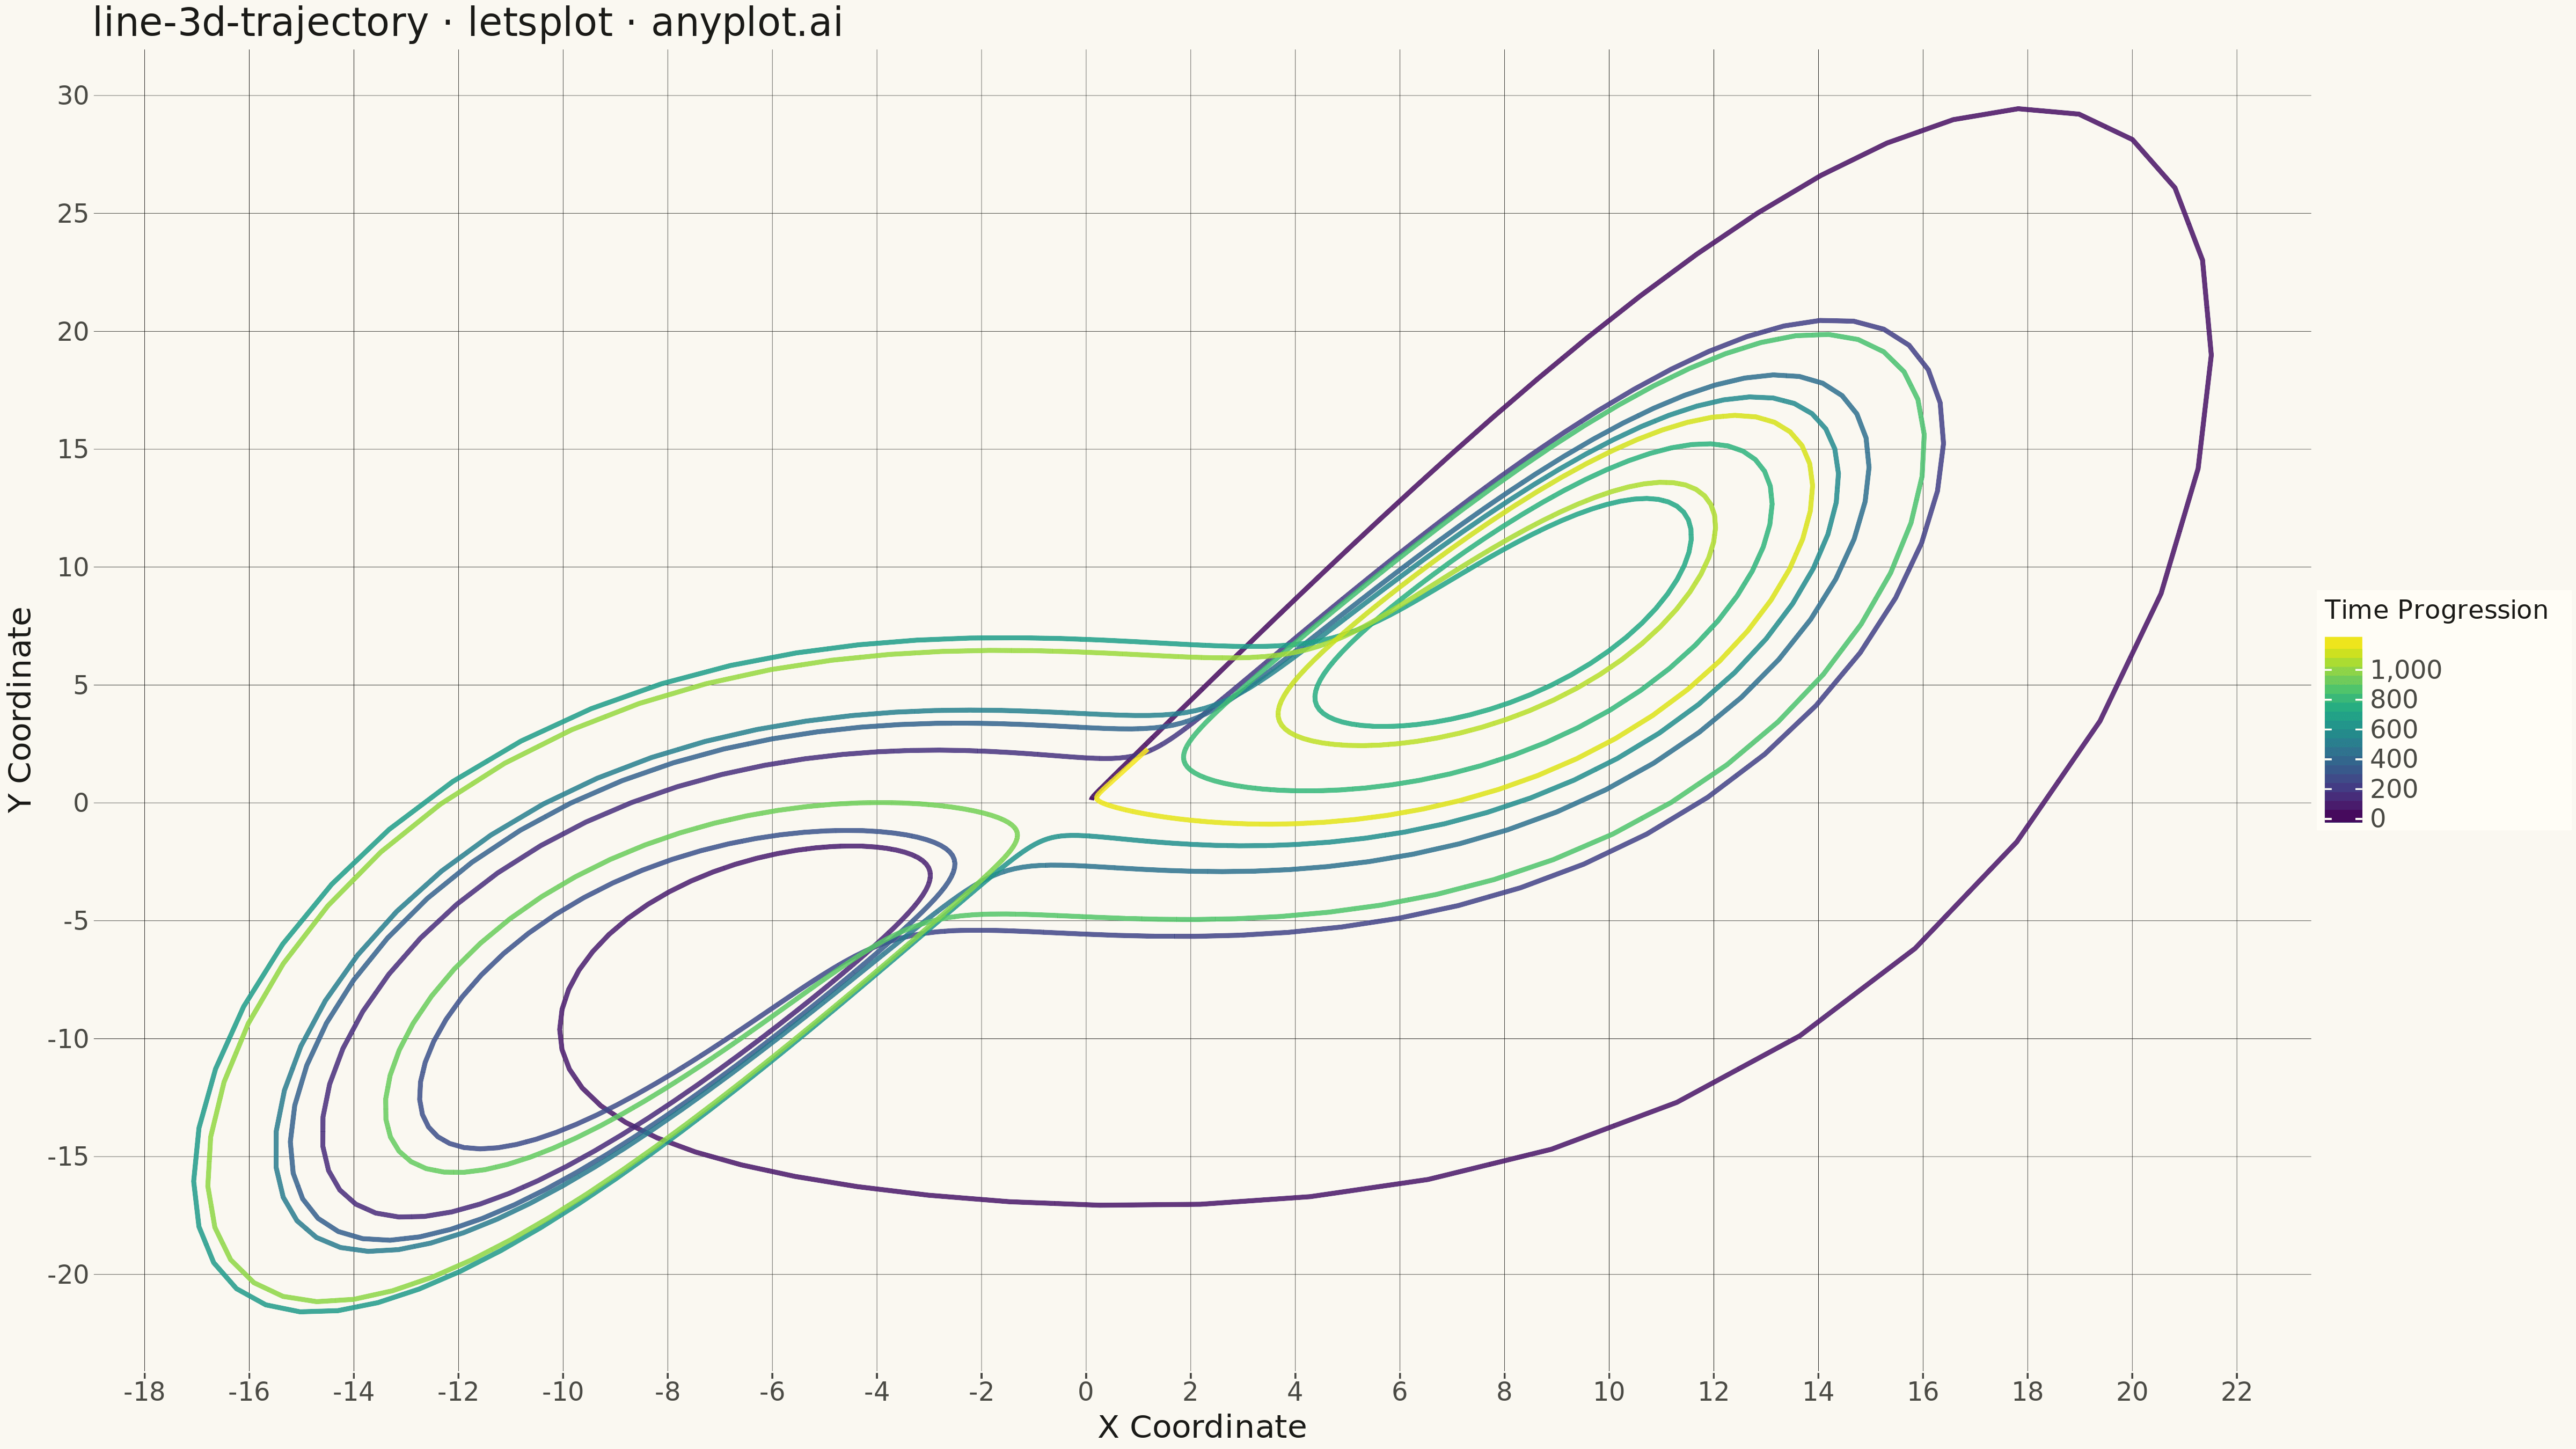
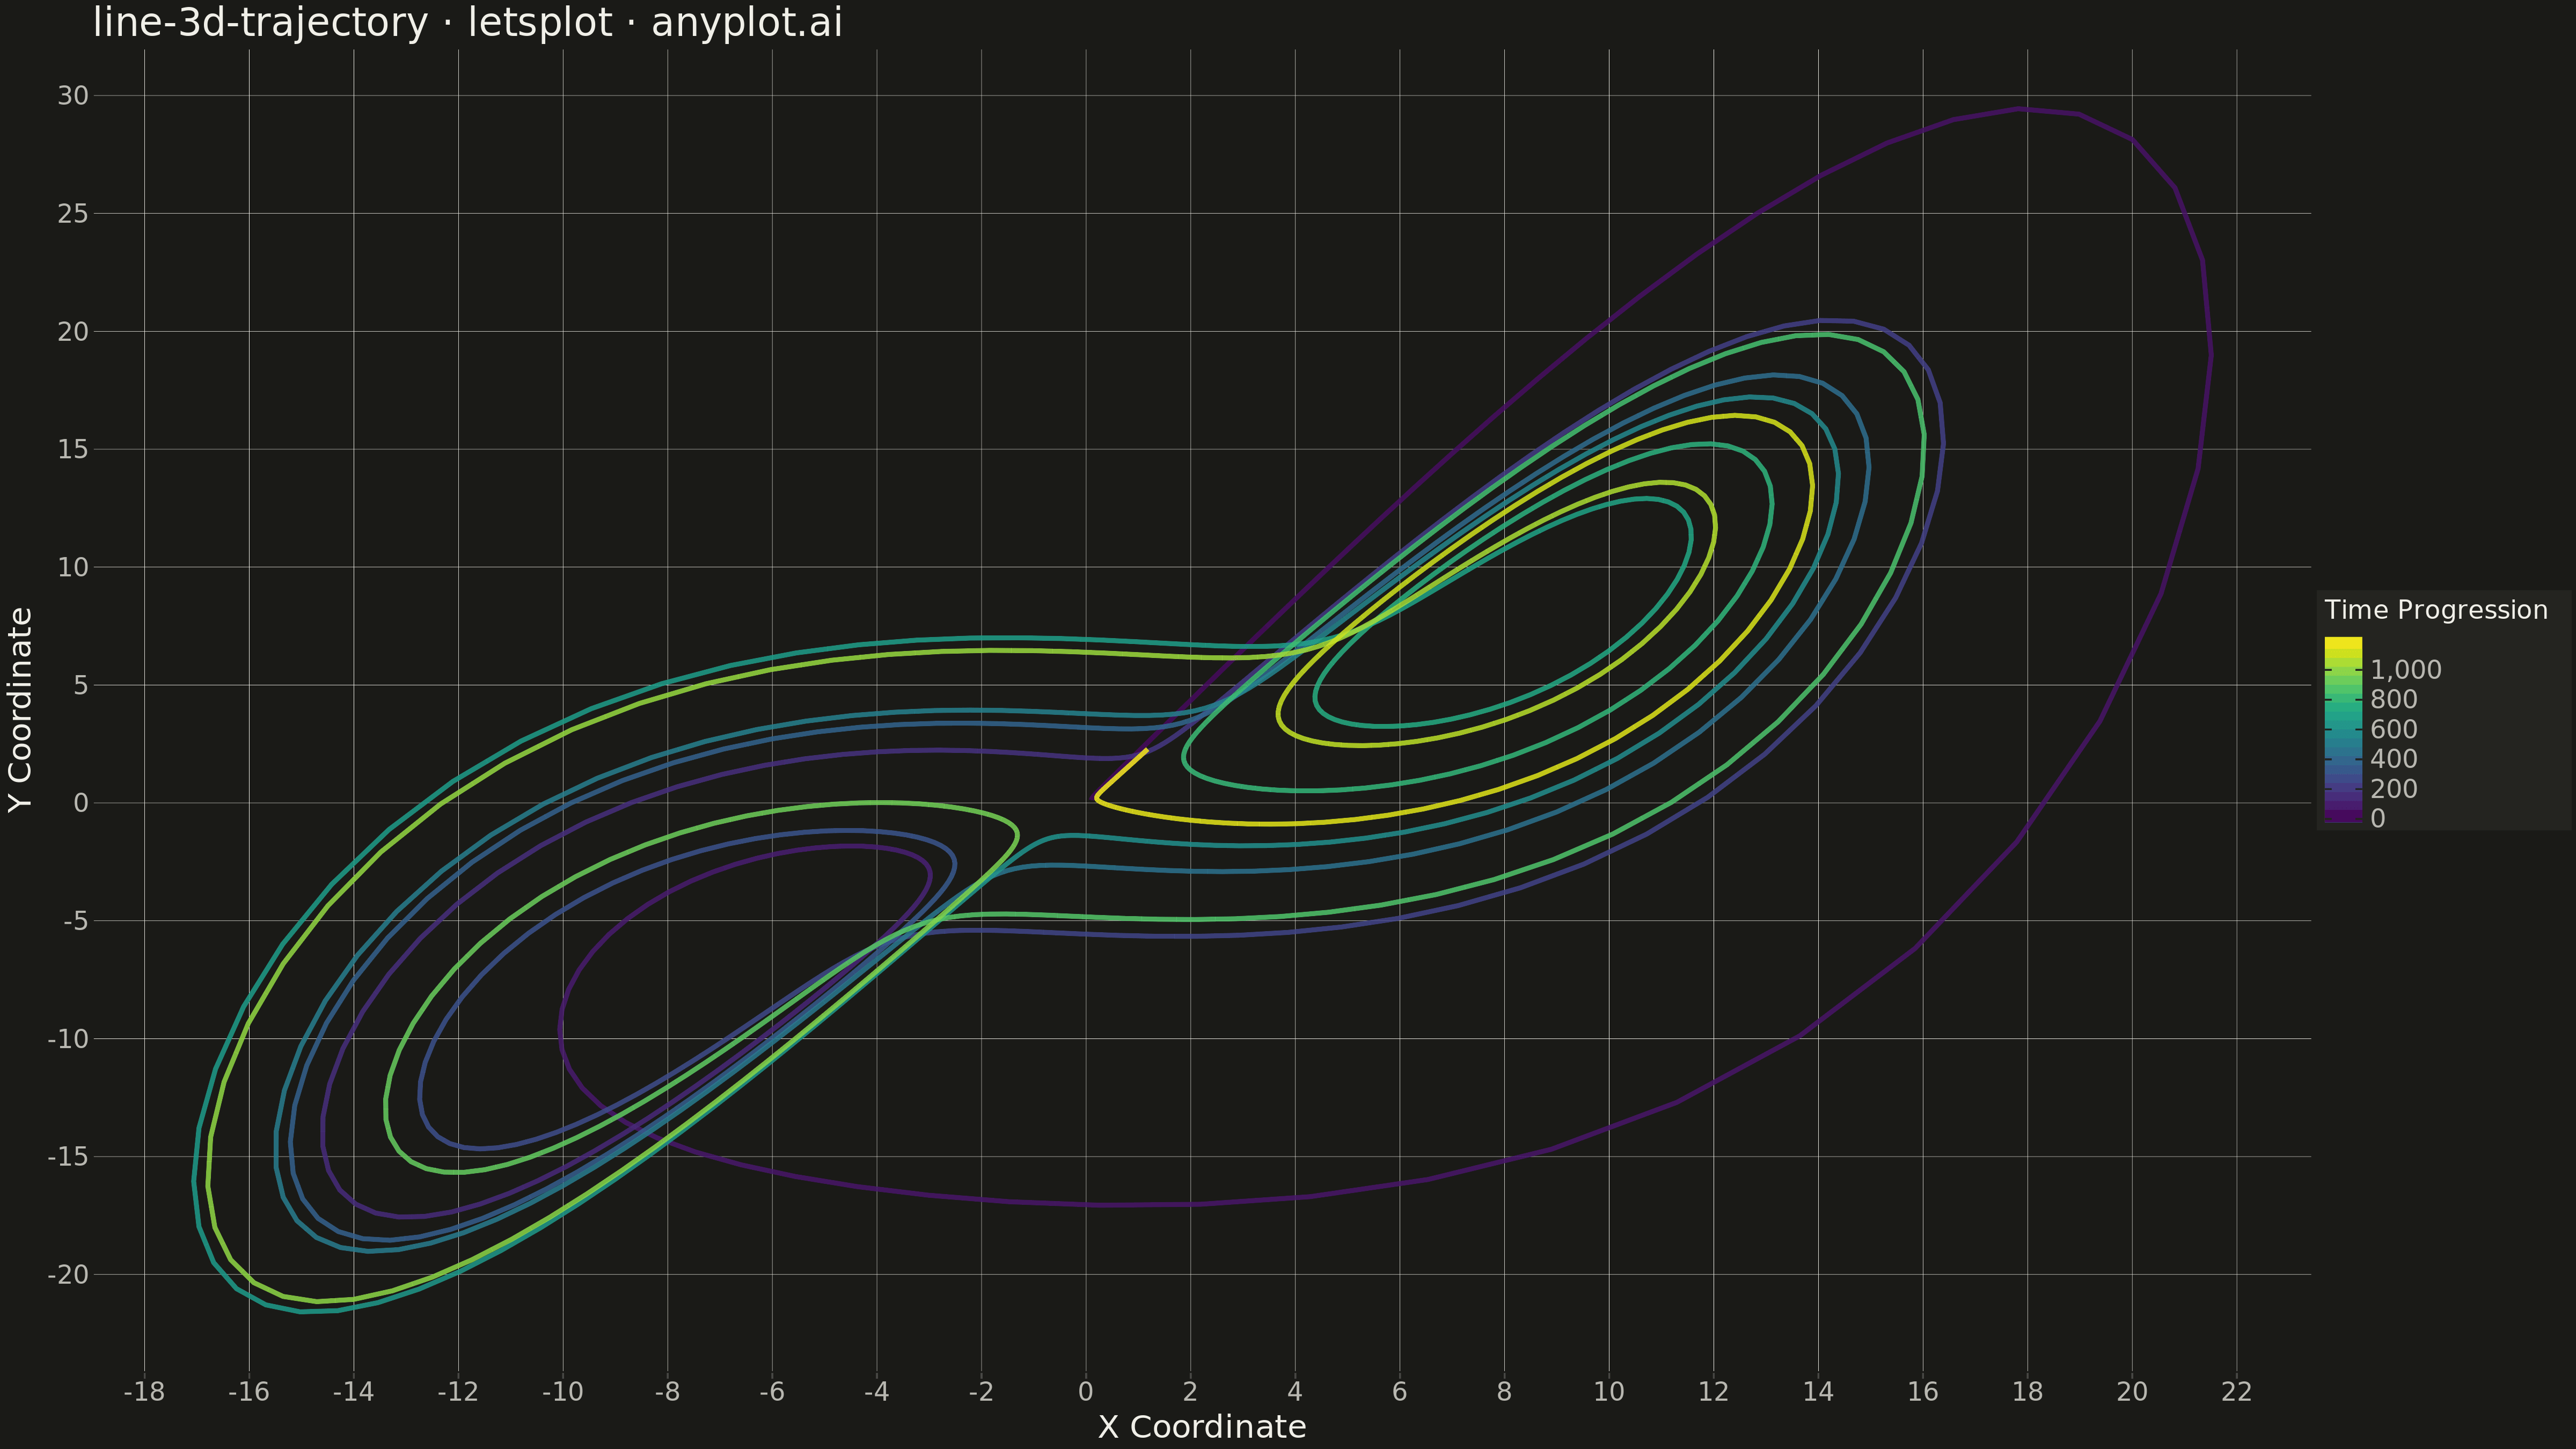
The same plot in 13 other libraries — Python: Altair, Bokeh, Matplotlib, Plotly, Pygal, Seaborn; R: ggplot2; Julia: Makie.jl; JavaScript: Chart.js, D3.js, Apache ECharts, Highcharts, MUI X Charts. Compare all 14 side by side: 3D Line Plot for Trajectory Visualization in Python, R, Julia and JavaScript.
A 3D line plot that displays paths, trajectories, or curves as connected lines in three-dimensional space. Unlike scatter plots that show discrete points, this visualization connects data points sequentially to reveal continuous paths, making it ideal for understanding motion, mathematical curves, and temporal evolution in 3D. Interactive rotation is essential for exploring the spatial structure of complex trajectories.
""" anyplot.ai
line-3d-trajectory: 3D Line Plot for Trajectory Visualization
Library: letsplot 4.9.0 | Python 3.13.13
Quality: 90/100 | Created: 2026-05-16
"""

import os
import pathlib
import shutil

import numpy as np
import pandas as pd
from lets_plot import *


LetsPlot.setup_html()

# Theme
THEME = os.getenv("ANYPLOT_THEME", "light")
PAGE_BG = "#FAF8F1" if THEME == "light" else "#1A1A17"
ELEVATED_BG = "#FFFDF6" if THEME == "light" else "#242420"
INK = "#1A1A17" if THEME == "light" else "#F0EFE8"
INK_SOFT = "#4A4A44" if THEME == "light" else "#B8B7B0"
INK_MUTED = "#6B6A63" if THEME == "light" else "#A8A79F"
BRAND = "#009E73"

# Generate Lorenz attractor trajectory
np.random.seed(42)
dt = 0.01
num_steps = 1200
x, y, z = 0.1, 0.1, 0.1
xs, ys, zs = [], [], []

sigma = 10.0
rho = 28.0
beta = 8.0 / 3.0

for _ in range(num_steps):
    dx = sigma * (y - x)
    dy = x * (rho - z) - y
    dz = x * y - beta * z
    x += dt * dx
    y += dt * dy
    z += dt * dz
    xs.append(x)
    ys.append(y)
    zs.append(z)

time_steps = np.arange(num_steps)

# Create DataFrame with computed 2D projection for visualization
# Project 3D data to 2D while encoding the z-axis through color and secondary position
df = pd.DataFrame({"x": xs, "y": ys, "z": zs, "time": time_steps})

# Normalize z for color encoding
z_norm = (np.array(zs) - np.min(zs)) / (np.max(zs) - np.min(zs))

# Create path-based visualization showing trajectory progression
# Use x-y projection with z encoded as color gradient for temporal progression
plot = (
    ggplot(df, aes(x="x", y="y", color="time"))
    + geom_path(size=1.3, alpha=0.85)
    + scale_color_viridis()
    + ggsize(1600, 900)
    + theme(
        plot_background=element_rect(fill=PAGE_BG, color=PAGE_BG),
        panel_background=element_rect(fill=PAGE_BG, color=PAGE_BG),
        panel_grid_major=element_line(color=INK, size=0.2),
        panel_grid_minor=element_blank(),
        axis_title=element_text(color=INK, size=20, face="plain"),
        axis_text=element_text(color=INK_SOFT, size=16),
        axis_line=element_line(color=INK_SOFT, size=0.5),
        plot_title=element_text(color=INK, size=24, face="plain"),
        legend_background=element_rect(fill=ELEVATED_BG, color=INK_SOFT),
        legend_text=element_text(color=INK_SOFT, size=16),
        legend_title=element_text(color=INK, size=16),
        legend_position="right",
    )
    + labs(
        x="X Coordinate", y="Y Coordinate", color="Time Progression", title="line-3d-trajectory · letsplot · anyplot.ai"
    )
)

# Save output
ggsave(plot, f"plot-{THEME}.png", scale=3)
ggsave(plot, f"plot-{THEME}.html")

# Move files from lets-plot-images subdirectory to current directory if needed
lpi_dir = pathlib.Path("lets-plot-images")
if lpi_dir.exists():
    for ext in ["png", "html"]:
        src = lpi_dir / f"plot-{THEME}.{ext}"
        dst = pathlib.Path(f"plot-{THEME}.{ext}")
        if src.exists() and not dst.exists():
            shutil.copy(src, dst)
Runnable source as JSON, for any HTTP client: https://api.anyplot.ai/specs/line-3d-trajectory/letsplot/code. Any spec id and library id listed in llms-full.txt fit the same URL shape; every URL below is complete and callable.
{
  "spec_id": "line-3d-trajectory",
  "language": "python",
  "library": "letsplot",
  "page": "https://anyplot.ai/line-3d-trajectory/python/letsplot",
  "hub": "https://anyplot.ai/line-3d-trajectory",
  "code_json": "https://api.anyplot.ai/specs/line-3d-trajectory/letsplot/code",
  "spec_json": "https://api.anyplot.ai/specs/line-3d-trajectory",
  "render_light_png": "https://storage.googleapis.com/anyplot-images/plots/line-3d-trajectory/python/letsplot/plot-light.png",
  "render_dark_png": "https://storage.googleapis.com/anyplot-images/plots/line-3d-trajectory/python/letsplot/plot-dark.png",
  "interactive_light_html": "https://storage.googleapis.com/anyplot-images/plots/line-3d-trajectory/python/letsplot/plot-light.html",
  "interactive_dark_html": "https://storage.googleapis.com/anyplot-images/plots/line-3d-trajectory/python/letsplot/plot-dark.html",
  "quality_score": 90.0,
  "license": "MIT",
  "guide": "https://anyplot.ai/llms.txt"
}
Part of 3D Line Plot for Trajectory Visualization on anyplot.ai.