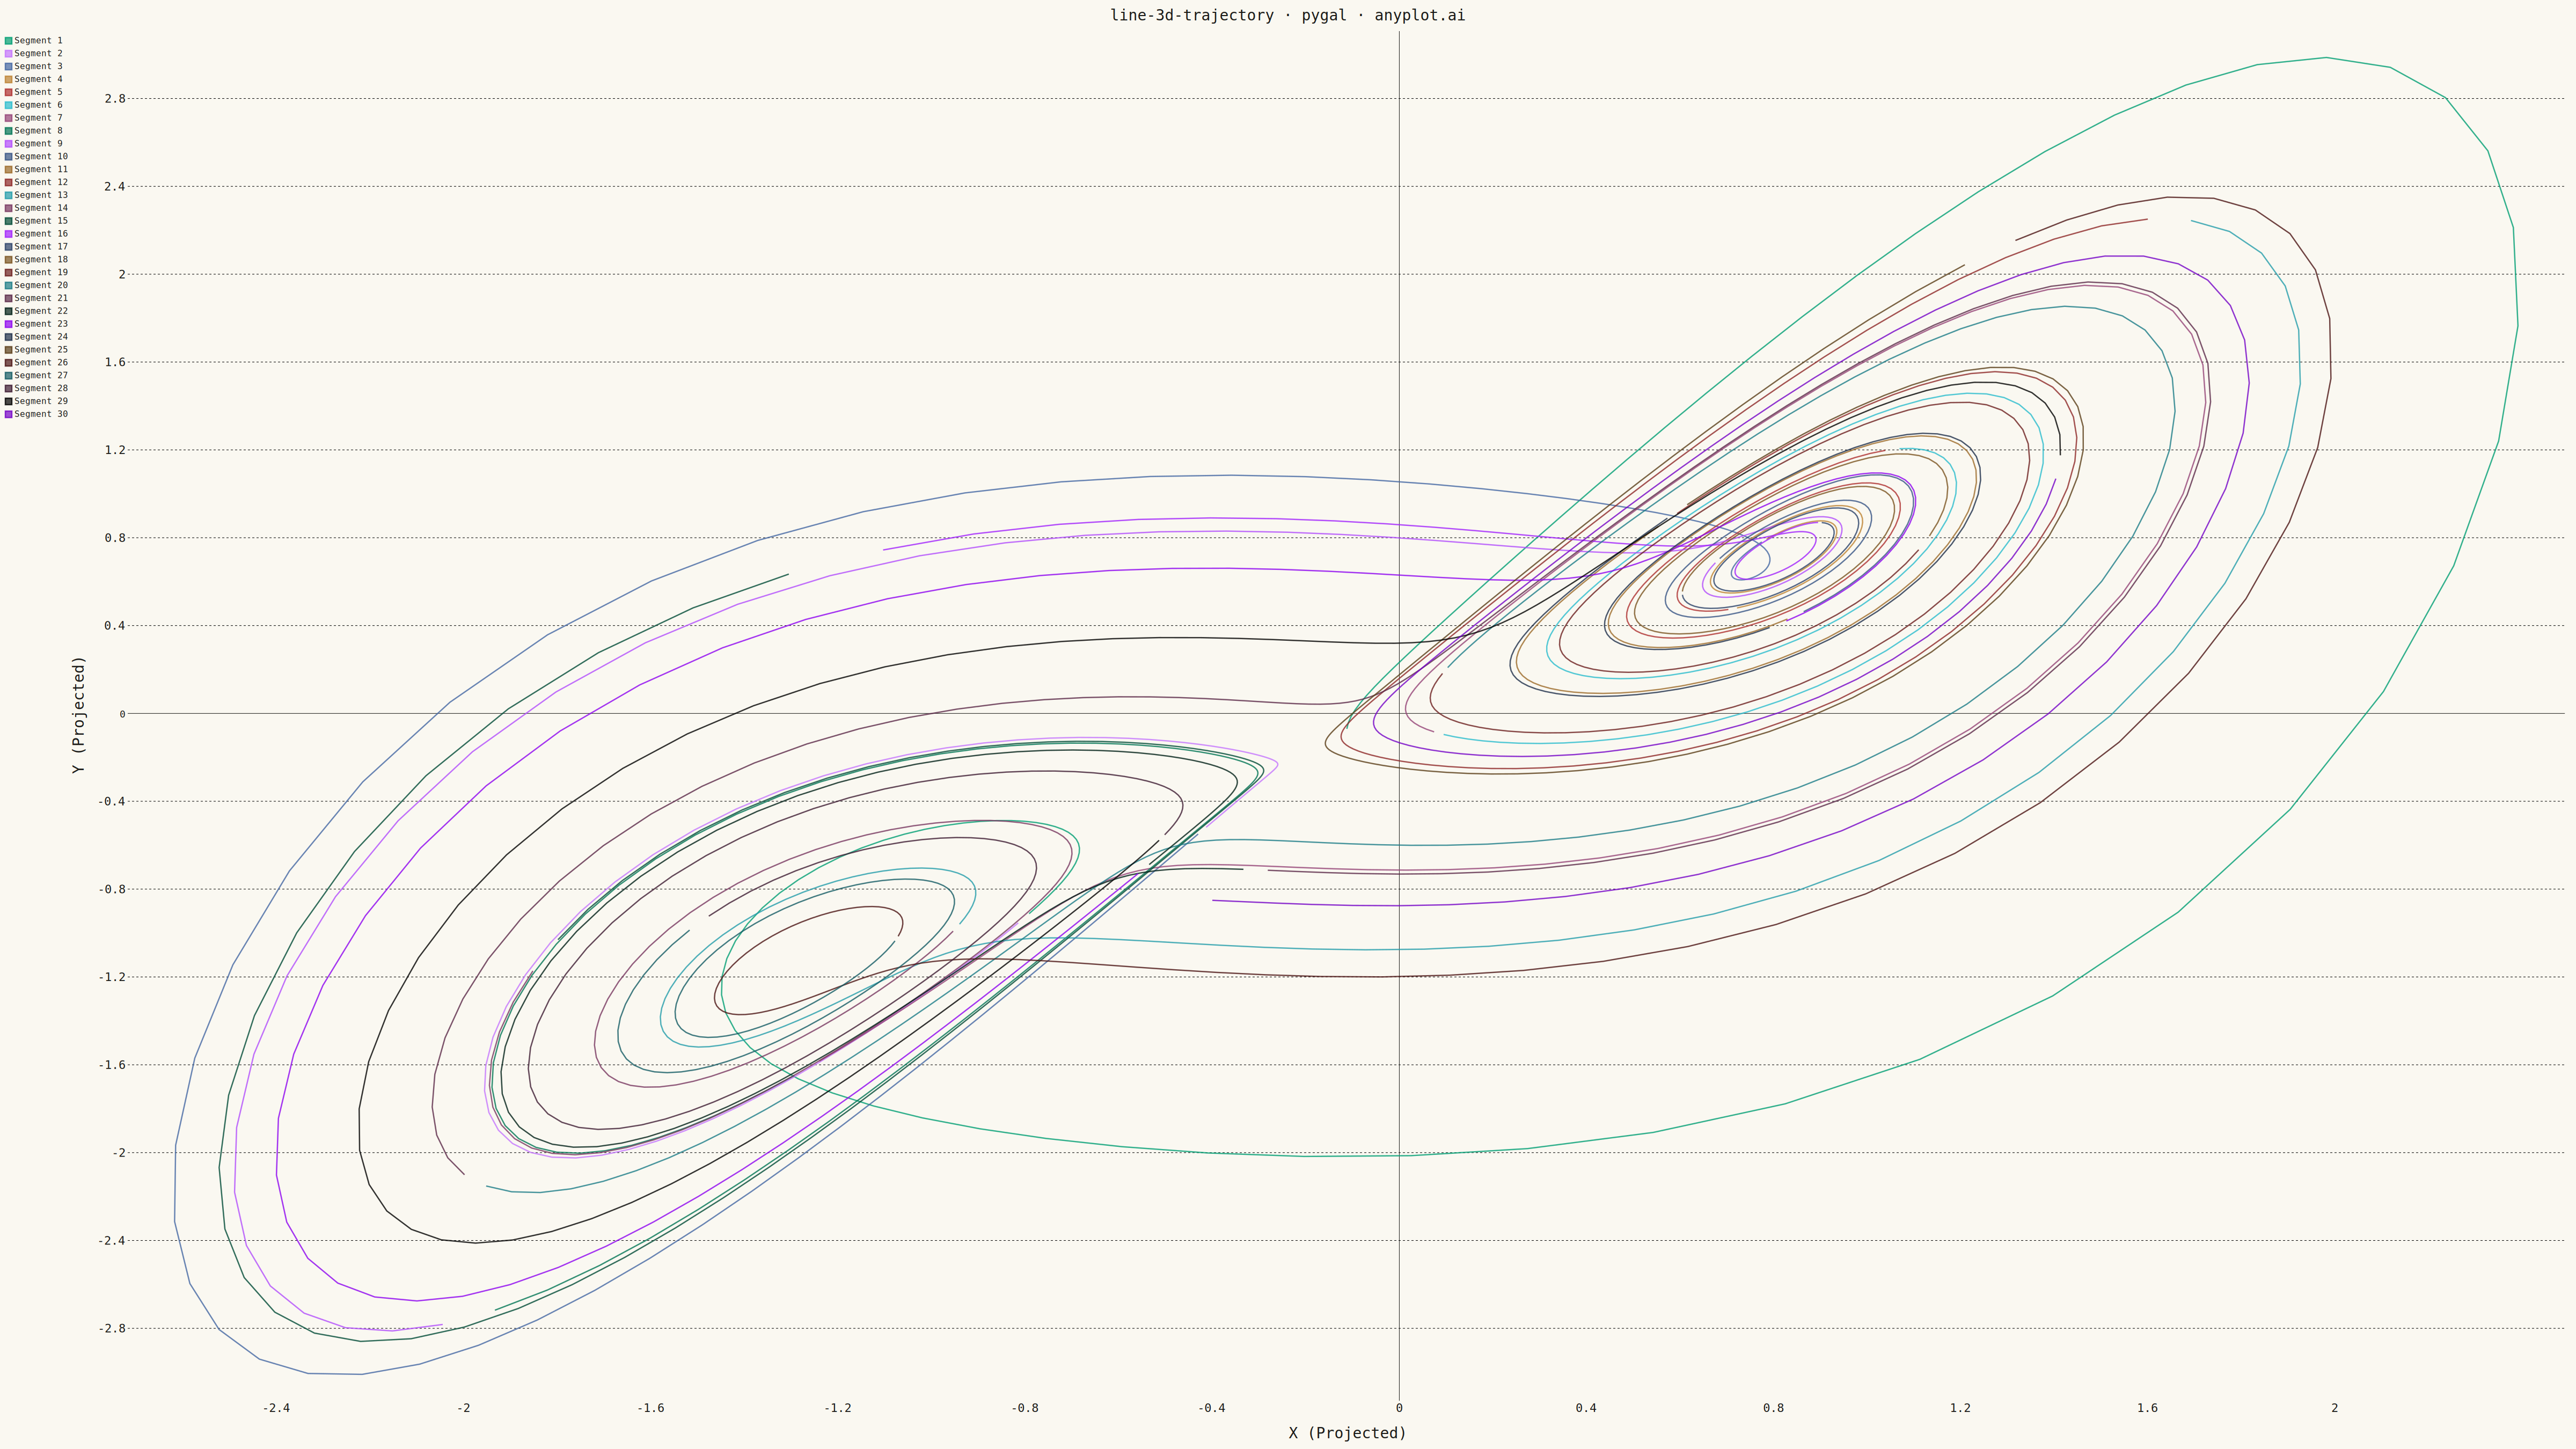
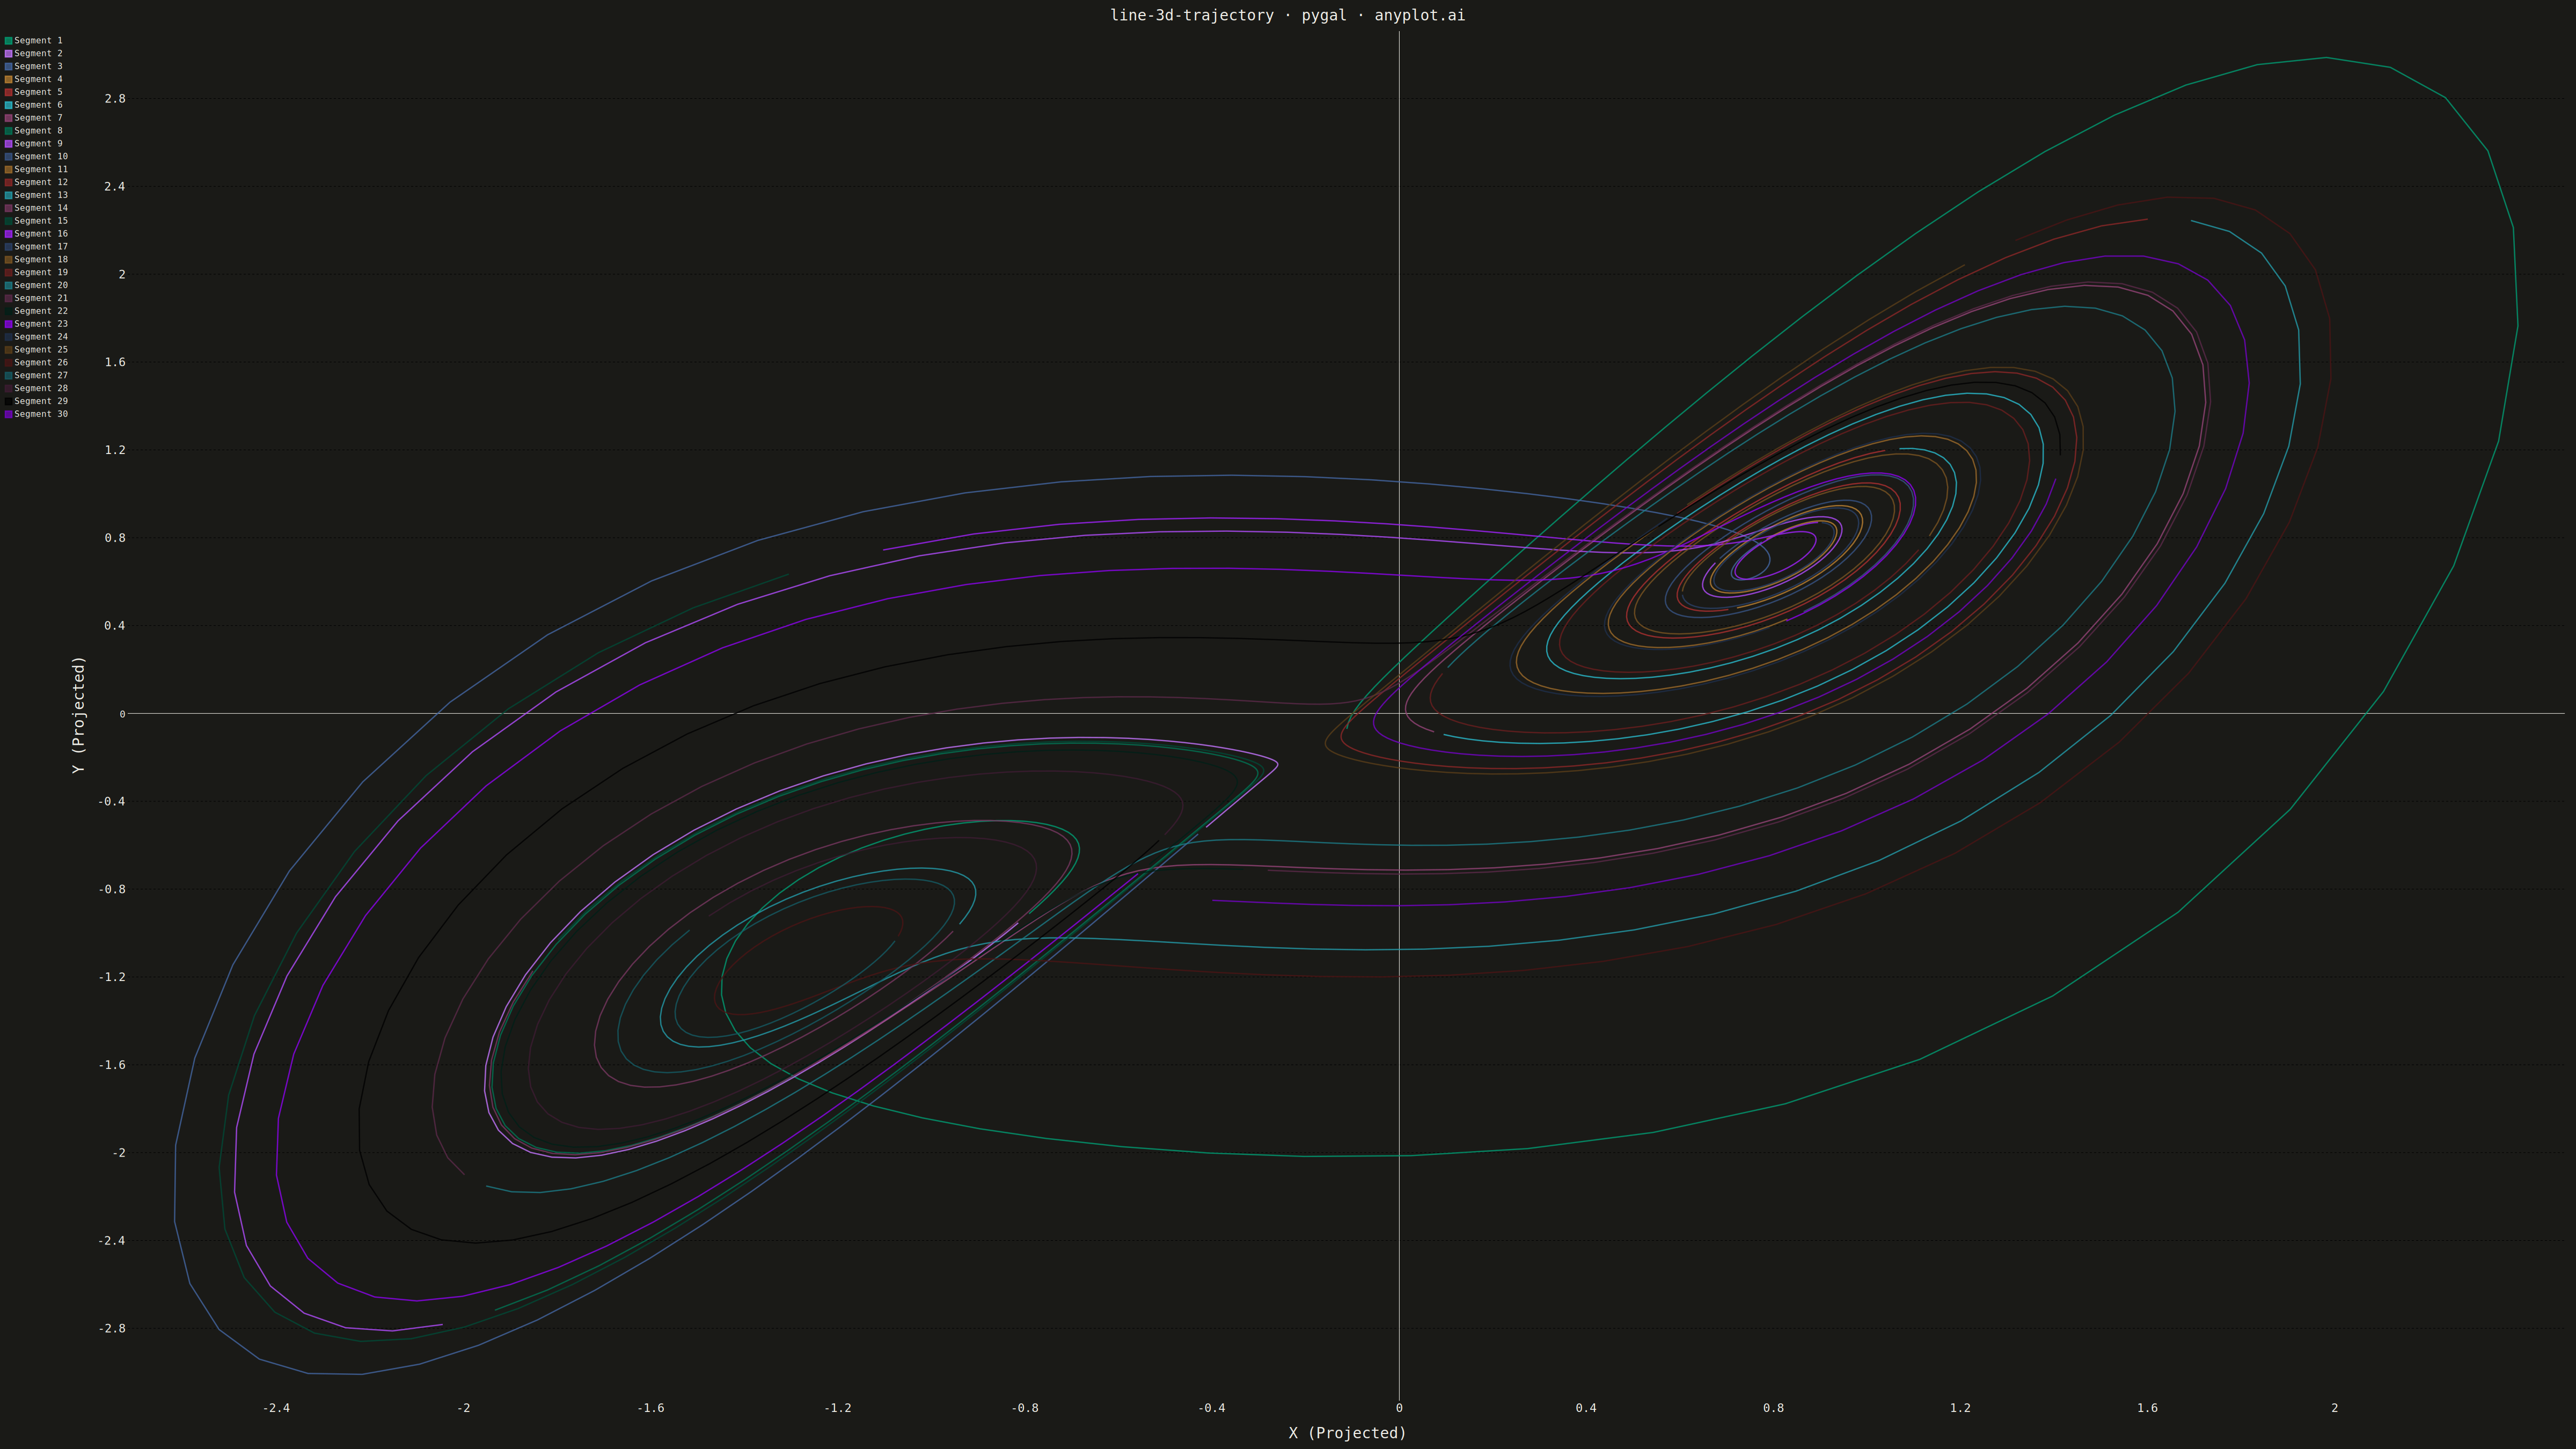
The same plot in 13 other libraries — Python: Altair, Bokeh, lets-plot, Matplotlib, Plotly, Seaborn; R: ggplot2; Julia: Makie.jl; JavaScript: Chart.js, D3.js, Apache ECharts, Highcharts, MUI X Charts. Compare all 14 side by side: 3D Line Plot for Trajectory Visualization in Python, R, Julia and JavaScript.
A 3D line plot that displays paths, trajectories, or curves as connected lines in three-dimensional space. Unlike scatter plots that show discrete points, this visualization connects data points sequentially to reveal continuous paths, making it ideal for understanding motion, mathematical curves, and temporal evolution in 3D. Interactive rotation is essential for exploring the spatial structure of complex trajectories.
""" anyplot.ai
line-3d-trajectory: 3D Line Plot for Trajectory Visualization
Library: pygal 3.1.3 | Python 3.13.15
Quality: 86/100 | Updated: 2026-08-25
"""

import os

import numpy as np
import pygal
from pygal.style import Style


# Theme tokens (see prompts/default-style-guide.md "Background" + "Theme-adaptive Chrome")
THEME = os.getenv("ANYPLOT_THEME", "light")
PAGE_BG = "#FAF8F1" if THEME == "light" else "#1A1A17"
INK = "#1A1A17" if THEME == "light" else "#F0EFE8"
INK_MUTED = "#6B6A63" if THEME == "light" else "#A8A79F"

# Imprint palette (see prompts/default-style-guide.md "Categorical Palette")
IMPRINT_PALETTE = ("#009E73", "#C475FD", "#4467A3", "#BD8233", "#AE3030", "#2ABCCD", "#954477", "#99B314")

# Data — Lorenz attractor trajectory (deterministic chaotic ODE, no randomness)
sigma, rho, beta, dt, num_steps = 10.0, 28.0, 8.0 / 3.0, 0.01, 3000
x, y, z = 1.0, 1.0, 1.0
trajectory = np.zeros((num_steps, 3))
for i in range(num_steps):
    dx, dy, dz = sigma * (y - x), x * (rho - z) - y, x * y - beta * z
    x, y, z = x + dt * dx, y + dt * dy, z + dt * dz
    trajectory[i] = [x, y, z]

# pygal has no native 3D chart type, so the 3rd spatial axis is preserved via
# a true isometric projection (standard 45 deg azimuth / 35.264 deg elevation
# rotation matrices) instead of simply plotting x vs y and discarding z — the
# rotated x/y below are each a mix of all three original coordinates, so the
# projected 2D view actually encodes the 3D shape of the trajectory
xc = trajectory[:, 0] - trajectory[:, 0].mean()
yc = trajectory[:, 1] - trajectory[:, 1].mean()
zc = trajectory[:, 2] - trajectory[:, 2].mean()

azimuth, elevation = np.radians(45.0), np.radians(35.264)
x_rot = xc * np.cos(azimuth) - yc * np.sin(azimuth)
y_rot = xc * np.sin(azimuth) + yc * np.cos(azimuth)
y_iso = y_rot * np.cos(elevation) - zc * np.sin(elevation)

x_norm = x_rot / (x_rot.std() + 1e-8)
y_norm = y_iso / (y_iso.std() + 1e-8)

# pygal has no per-vertex gradient stroke, so the trajectory is split into
# equal-time segments; pygal cycles a serie's color from `Style.colors` by
# series index (a per-add `color=` kwarg is silently dropped — undocumented
# SerieConfig limitation), so the gradient itself must be pre-built here and
# handed to the Style as one color per segment. Alpha is baked into each
# stop (rgba) to thin overplotting in the tightly-wound coil regions —
# >500 points per the data-density heuristic (3000 points / 30 series here).
num_segments = 30
segment_length = len(x_norm) // num_segments

# imprint_seq: brand green -> blue (single-polarity continuous encoding)
seq_start, seq_end = IMPRINT_PALETTE[0], IMPRINT_PALETTE[2]
gradient_colors = []
for i in range(num_segments):
    t = i / (num_segments - 1)
    r = round(int(seq_start[1:3], 16) + (int(seq_end[1:3], 16) - int(seq_start[1:3], 16)) * t)
    g = round(int(seq_start[3:5], 16) + (int(seq_end[3:5], 16) - int(seq_start[3:5], 16)) * t)
    b = round(int(seq_start[5:7], 16) + (int(seq_end[5:7], 16) - int(seq_start[5:7], 16)) * t)
    gradient_colors.append(f"rgba({r}, {g}, {b}, 0.75)")

# Plot — see prompts/library/pygal.md "Sizing + Theme" for the canonical values
custom_style = Style(
    background=PAGE_BG,
    plot_background=PAGE_BG,
    foreground=INK,
    foreground_strong=INK,
    foreground_subtle=INK_MUTED,
    colors=tuple(gradient_colors),
    title_font_size=66,
    label_font_size=56,
    major_label_font_size=44,
    legend_font_size=44,
    value_font_size=36,
    stroke_width=1.5,
)

chart = pygal.XY(
    title="line-3d-trajectory · python · pygal · anyplot.ai",
    x_title="X — isometric projection of (x, y, z)",
    y_title="Y — isometric projection; color encodes elapsed time",
    width=3200,
    height=1800,
    style=custom_style,
    show_legend=False,
    show_dots=False,
)

for i in range(num_segments):
    start_idx = i * segment_length
    end_idx = start_idx + segment_length if i < num_segments - 1 else len(x_norm)
    xy_pairs = list(zip(x_norm[start_idx:end_idx].tolist(), y_norm[start_idx:end_idx].tolist(), strict=True))
    chart.add(f"Time step {start_idx}–{end_idx - 1}", xy_pairs, stroke_style={"width": 1.5})

# Save
chart.render_to_png(f"plot-{THEME}.png")
with open(f"plot-{THEME}.html", "wb") as f:
    f.write(chart.render())
Runnable source as JSON, for any HTTP client: https://api.anyplot.ai/specs/line-3d-trajectory/pygal/code. Any spec id and library id listed in llms-full.txt fit the same URL shape; every URL below is complete and callable.
{
  "spec_id": "line-3d-trajectory",
  "language": "python",
  "library": "pygal",
  "page": "https://anyplot.ai/line-3d-trajectory/python/pygal",
  "hub": "https://anyplot.ai/line-3d-trajectory",
  "code_json": "https://api.anyplot.ai/specs/line-3d-trajectory/pygal/code",
  "spec_json": "https://api.anyplot.ai/specs/line-3d-trajectory",
  "render_light_png": "https://storage.googleapis.com/anyplot-images/plots/line-3d-trajectory/python/pygal/plot-light.png",
  "render_dark_png": "https://storage.googleapis.com/anyplot-images/plots/line-3d-trajectory/python/pygal/plot-dark.png",
  "interactive_light_html": "https://storage.googleapis.com/anyplot-images/plots/line-3d-trajectory/python/pygal/plot-light.html",
  "interactive_dark_html": "https://storage.googleapis.com/anyplot-images/plots/line-3d-trajectory/python/pygal/plot-dark.html",
  "quality_score": 86.0,
  "license": "MIT",
  "guide": "https://anyplot.ai/llms.txt"
}
Part of 3D Line Plot for Trajectory Visualization on anyplot.ai.