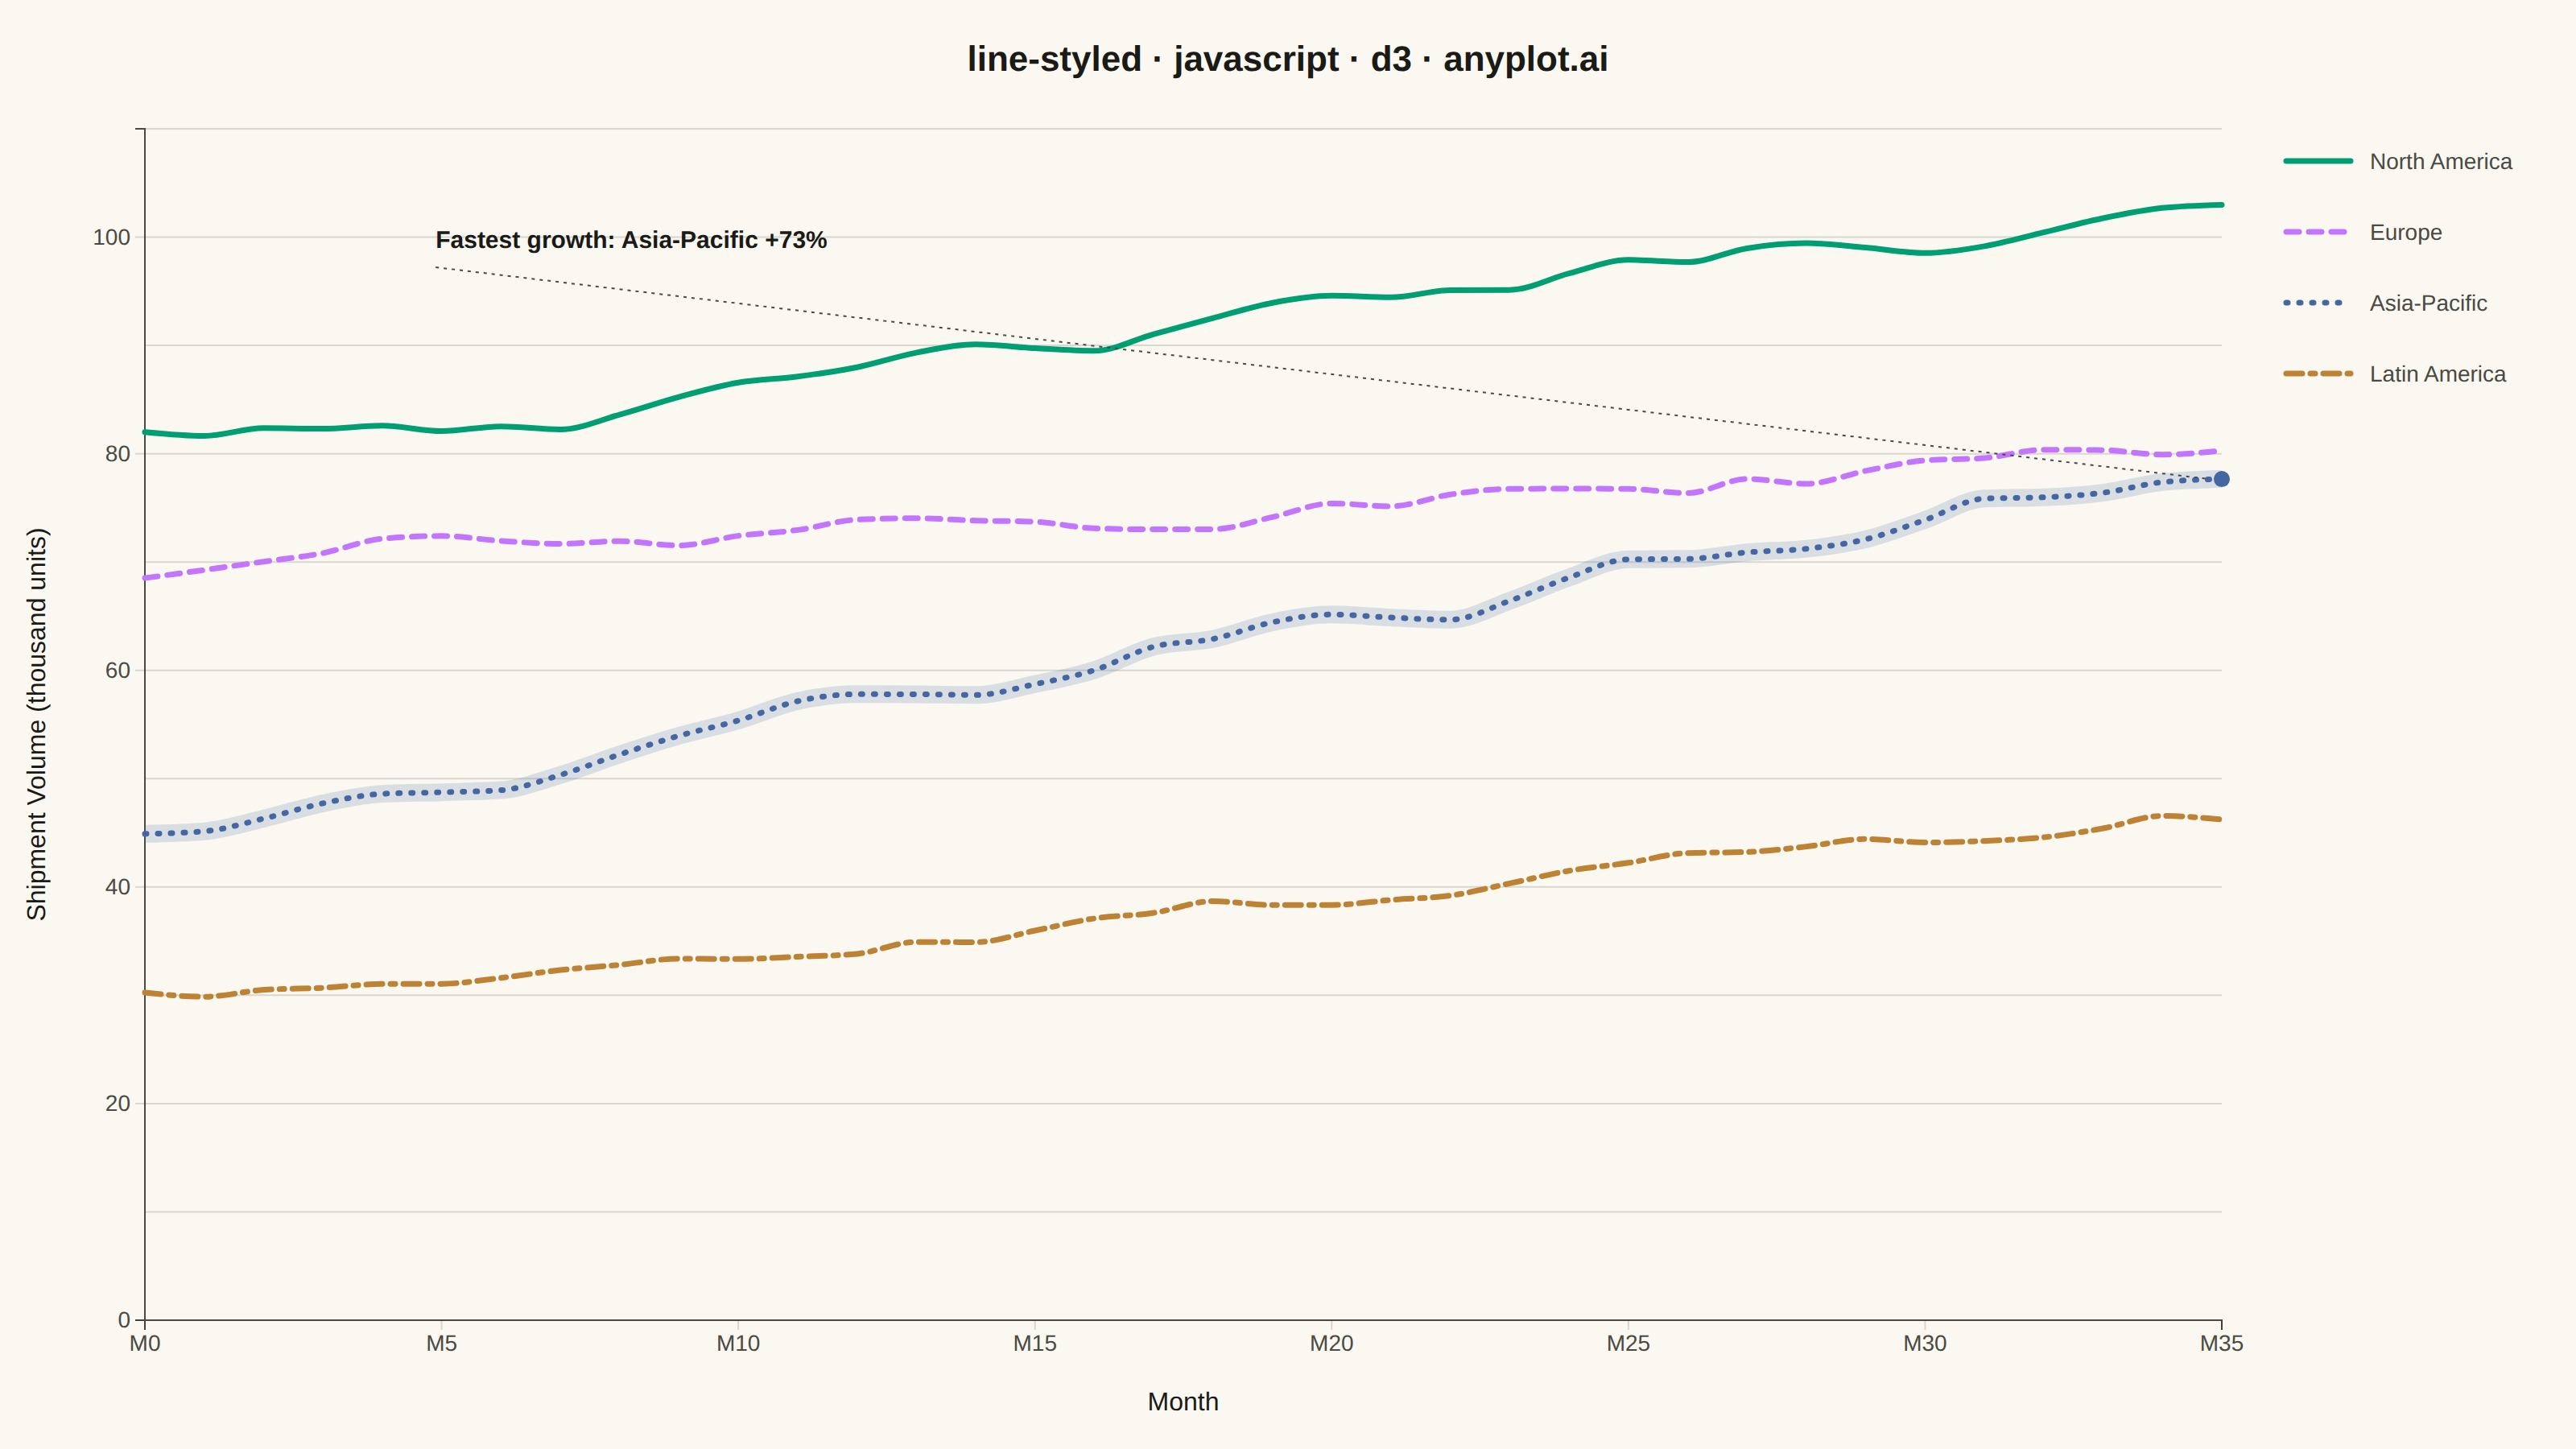
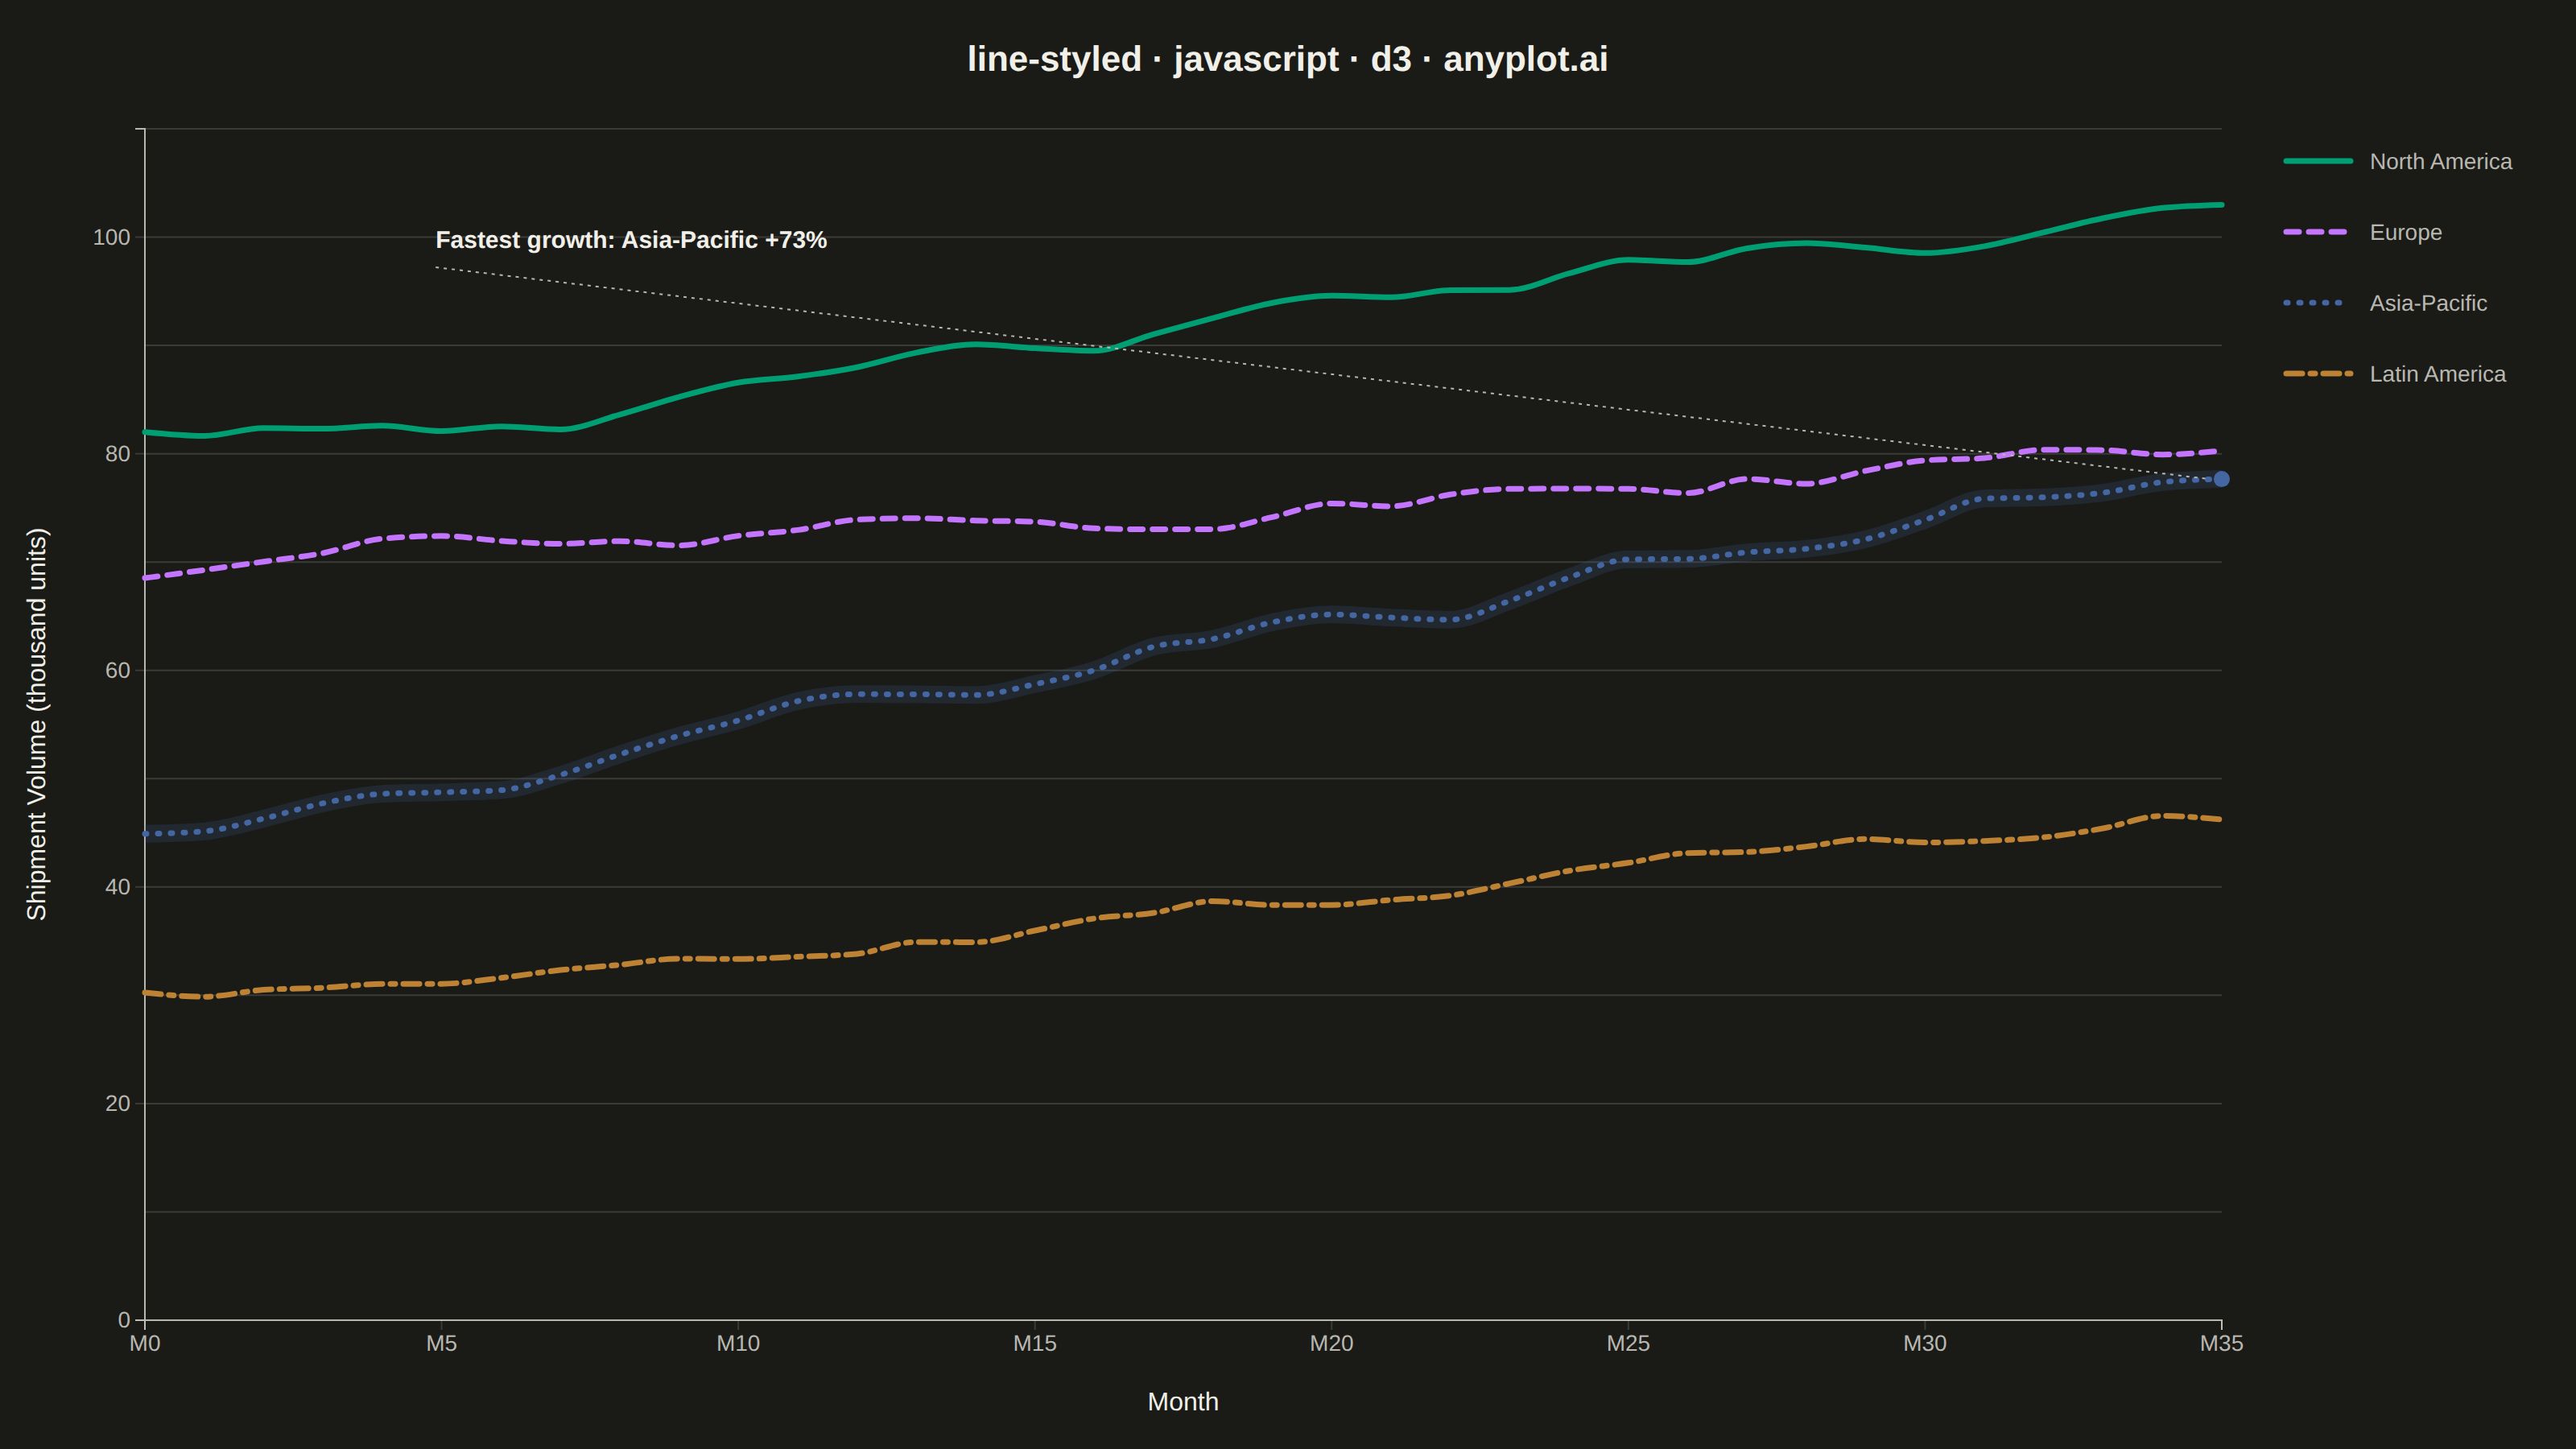
The same plot in 14 other libraries — JavaScript: Chart.js, Apache ECharts, Highcharts, MUI X Charts; Python: Altair, Bokeh, lets-plot, Matplotlib, Plotly, plotnine, Pygal, Seaborn; R: ggplot2; Julia: Makie.jl. Compare all 15 side by side: Styled Line Plot in Python, R, Julia and JavaScript.
A line plot using different line styles (solid, dashed, dotted, dash-dot) to distinguish multiple data series. This is especially useful for black-and-white printing or when color distinction is insufficient.
// anyplot.ai
// line-styled: Styled Line Plot
// Library: d3 7.9.0 | JavaScript 22.23.2
// Quality: 91/100 | Created: 2026-09-05

const t = window.ANYPLOT_TOKENS;
const { width, height } = window.ANYPLOT_SIZE;
const margin = { top: 80, right: 220, bottom: 80, left: 90 };
const iw = width - margin.left - margin.right;
const ih = height - margin.top - margin.bottom;

// --- Data (in-memory, deterministic) ----------------------------------------
// Fixed-seed LCG — the browser has no seeded RNG.
let seed = 42;
function rand() {
  seed = (seed * 1664525 + 1013904223) % 4294967296;
  return seed / 4294967296;
}

const months = 36;
const series = [
  { name: "North America", start: 82, drift: 0.55, noise: 2.2, dash: null },
  { name: "Europe", start: 68, drift: 0.35, noise: 2.0, dash: "8,6" },
  { name: "Asia-Pacific", start: 45, drift: 0.9, noise: 2.6, dash: "1,7" },
  { name: "Latin America", start: 30, drift: 0.4, noise: 1.6, dash: "10,5,3,5" },
];

const data = series.map((s) => {
  let value = s.start;
  const points = [];
  for (let i = 0; i < months; i += 1) {
    value += s.drift + (rand() - 0.5) * s.noise;
    value = Math.max(5, value);
    points.push({ month: i, value });
  }
  return { name: s.name, dash: s.dash, points };
});

// --- SVG mount ---------------------------------------------------------------
const svg = d3.select("#container").append("svg").attr("width", width).attr("height", height);
const g = svg.append("g").attr("transform", `translate(${margin.left},${margin.top})`);

// --- Scales --------------------------------------------------------------------
const x = d3.scaleLinear().domain([0, months - 1]).range([0, iw]);
const y = d3
  .scaleLinear()
  .domain([0, d3.max(data, (s) => d3.max(s.points, (p) => p.value))])
  .nice()
  .range([ih, 0]);

// --- Gridlines (y-axis only, subtle) --------------------------------------------
g.append("g")
  .attr("class", "grid")
  .call(d3.axisLeft(y).tickSize(-iw).tickFormat(""))
  .call((sel) => sel.select(".domain").remove())
  .selectAll("line")
  .attr("stroke", t.grid);

// --- Axes ------------------------------------------------------------------
const xAxis = g
  .append("g")
  .attr("transform", `translate(0,${ih})`)
  .call(
    d3
      .axisBottom(x)
      .ticks(9)
      .tickFormat((d) => `M${d}`),
  );
const yAxis = g.append("g").call(d3.axisLeft(y).ticks(6).tickFormat(d3.format(",.0f")));
for (const ax of [xAxis, yAxis]) {
  ax.selectAll("text").attr("fill", t.inkSoft).style("font-size", "14px");
  ax.selectAll("line").attr("stroke", t.grid);
  ax.select(".domain").attr("stroke", t.inkSoft);
}

// --- Axis labels -------------------------------------------------------------
g.append("text")
  .attr("x", iw / 2)
  .attr("y", ih + 56)
  .attr("text-anchor", "middle")
  .attr("fill", t.ink)
  .style("font-size", "16px")
  .text("Month");

g.append("text")
  .attr("transform", "rotate(-90)")
  .attr("x", -ih / 2)
  .attr("y", -62)
  .attr("text-anchor", "middle")
  .attr("fill", t.ink)
  .style("font-size", "16px")
  .text("Shipment Volume (thousand units)");

// --- Lines — distinguished by style, not just color -----------------------------
const color = d3.scaleOrdinal().domain(series.map((s) => s.name)).range(t.palette);
const line = d3
  .line()
  .x((d) => x(d.month))
  .y((d) => y(d.value))
  .curve(d3.curveMonotoneX);

g.selectAll(".series-line")
  .data(data)
  .join("path")
  .attr("class", "series-line")
  .attr("fill", "none")
  .attr("stroke", (d) => color(d.name))
  .attr("stroke-width", 3.5)
  .attr("stroke-dasharray", (d) => d.dash)
  .attr("stroke-linecap", "round")
  .attr("d", (d) => line(d.points));

// --- Data-driven focal annotation (storytelling) ----------------------------
// Highlight whichever series actually grew the fastest (relative to its own
// start), computed from the generated points rather than hard-coded.
const relativeGrowth = (d) =>
  (d.points[d.points.length - 1].value - d.points[0].value) / d.points[0].value;
const focalSeries = d3.greatest(data, (d) => relativeGrowth(d));
const focal = { series: focalSeries, growth: relativeGrowth(focalSeries) };
const focalEnd = focal.series.points[focal.series.points.length - 1];
const focalColor = color(focal.series.name);

// Soft halo behind the focal line only — draws the eye without changing its
// stroke width, keeping "consistent line width across styles" intact.
g.insert("path", ".series-line")
  .attr("fill", "none")
  .attr("stroke", focalColor)
  .attr("stroke-opacity", 0.18)
  .attr("stroke-width", 11)
  .attr("d", line(focal.series.points));

g.append("circle")
  .attr("cx", x(focalEnd.month))
  .attr("cy", y(focalEnd.value))
  .attr("r", 5)
  .attr("fill", focalColor);

const calloutX = iw * 0.14;
const calloutY = ih * 0.1;
g.append("line")
  .attr("x1", calloutX)
  .attr("y1", calloutY + 12)
  .attr("x2", x(focalEnd.month) - 8)
  .attr("y2", y(focalEnd.value))
  .attr("stroke", t.inkSoft)
  .attr("stroke-width", 1)
  .attr("stroke-dasharray", "2,3");

g.append("text")
  .attr("x", calloutX)
  .attr("y", calloutY)
  .attr("fill", t.ink)
  .style("font-size", "15px")
  .style("font-weight", "600")
  .text(`Fastest growth: ${focal.series.name} +${Math.round(focal.growth * 100)}%`);

// --- Legend (style + color mapping) --------------------------------------------
const legend = svg
  .append("g")
  .attr("transform", `translate(${margin.left + iw + 40},${margin.top + 20})`);

const legendRows = legend
  .selectAll(".legend-row")
  .data(data)
  .join("g")
  .attr("class", "legend-row")
  .attr("transform", (d, i) => `translate(0,${i * 44})`);

legendRows
  .append("line")
  .attr("x1", 0)
  .attr("x2", 40)
  .attr("y1", 0)
  .attr("y2", 0)
  .attr("stroke", (d) => color(d.name))
  .attr("stroke-width", 3.5)
  .attr("stroke-dasharray", (d) => d.dash)
  .attr("stroke-linecap", "round");

legendRows
  .append("text")
  .attr("x", 52)
  .attr("y", 5)
  .attr("fill", t.inkSoft)
  .style("font-size", "14px")
  .text((d) => d.name);

// --- Title -------------------------------------------------------------------
svg
  .append("text")
  .attr("x", width / 2)
  .attr("y", 44)
  .attr("text-anchor", "middle")
  .attr("fill", t.ink)
  .style("font-size", "22px")
  .style("font-weight", "600")
  .text("line-styled · javascript · d3 · anyplot.ai");
Runnable source as JSON, for any HTTP client: https://api.anyplot.ai/specs/line-styled/d3/code. Any spec id and library id listed in llms-full.txt fit the same URL shape; every URL below is complete and callable.
{
  "spec_id": "line-styled",
  "language": "javascript",
  "library": "d3",
  "page": "https://anyplot.ai/line-styled/javascript/d3",
  "hub": "https://anyplot.ai/line-styled",
  "code_json": "https://api.anyplot.ai/specs/line-styled/d3/code",
  "spec_json": "https://api.anyplot.ai/specs/line-styled",
  "render_light_png": "https://storage.googleapis.com/anyplot-images/plots/line-styled/javascript/d3/plot-light.png",
  "render_dark_png": "https://storage.googleapis.com/anyplot-images/plots/line-styled/javascript/d3/plot-dark.png",
  "interactive_light_html": "https://storage.googleapis.com/anyplot-images/plots/line-styled/javascript/d3/plot-light.html",
  "interactive_dark_html": "https://storage.googleapis.com/anyplot-images/plots/line-styled/javascript/d3/plot-dark.html",
  "quality_score": 91.0,
  "license": "MIT",
  "guide": "https://anyplot.ai/llms.txt"
}
Part of Styled Line Plot on anyplot.ai.