The same plot in 14 other libraries — JavaScript: Chart.js, D3.js, Apache ECharts, Highcharts; Python: Altair, Bokeh, lets-plot, Matplotlib, Plotly, plotnine, Pygal, Seaborn; R: ggplot2; Julia: Makie.jl. Compare all 15 side by side: Styled Line Plot in Python, R, Julia and JavaScript.
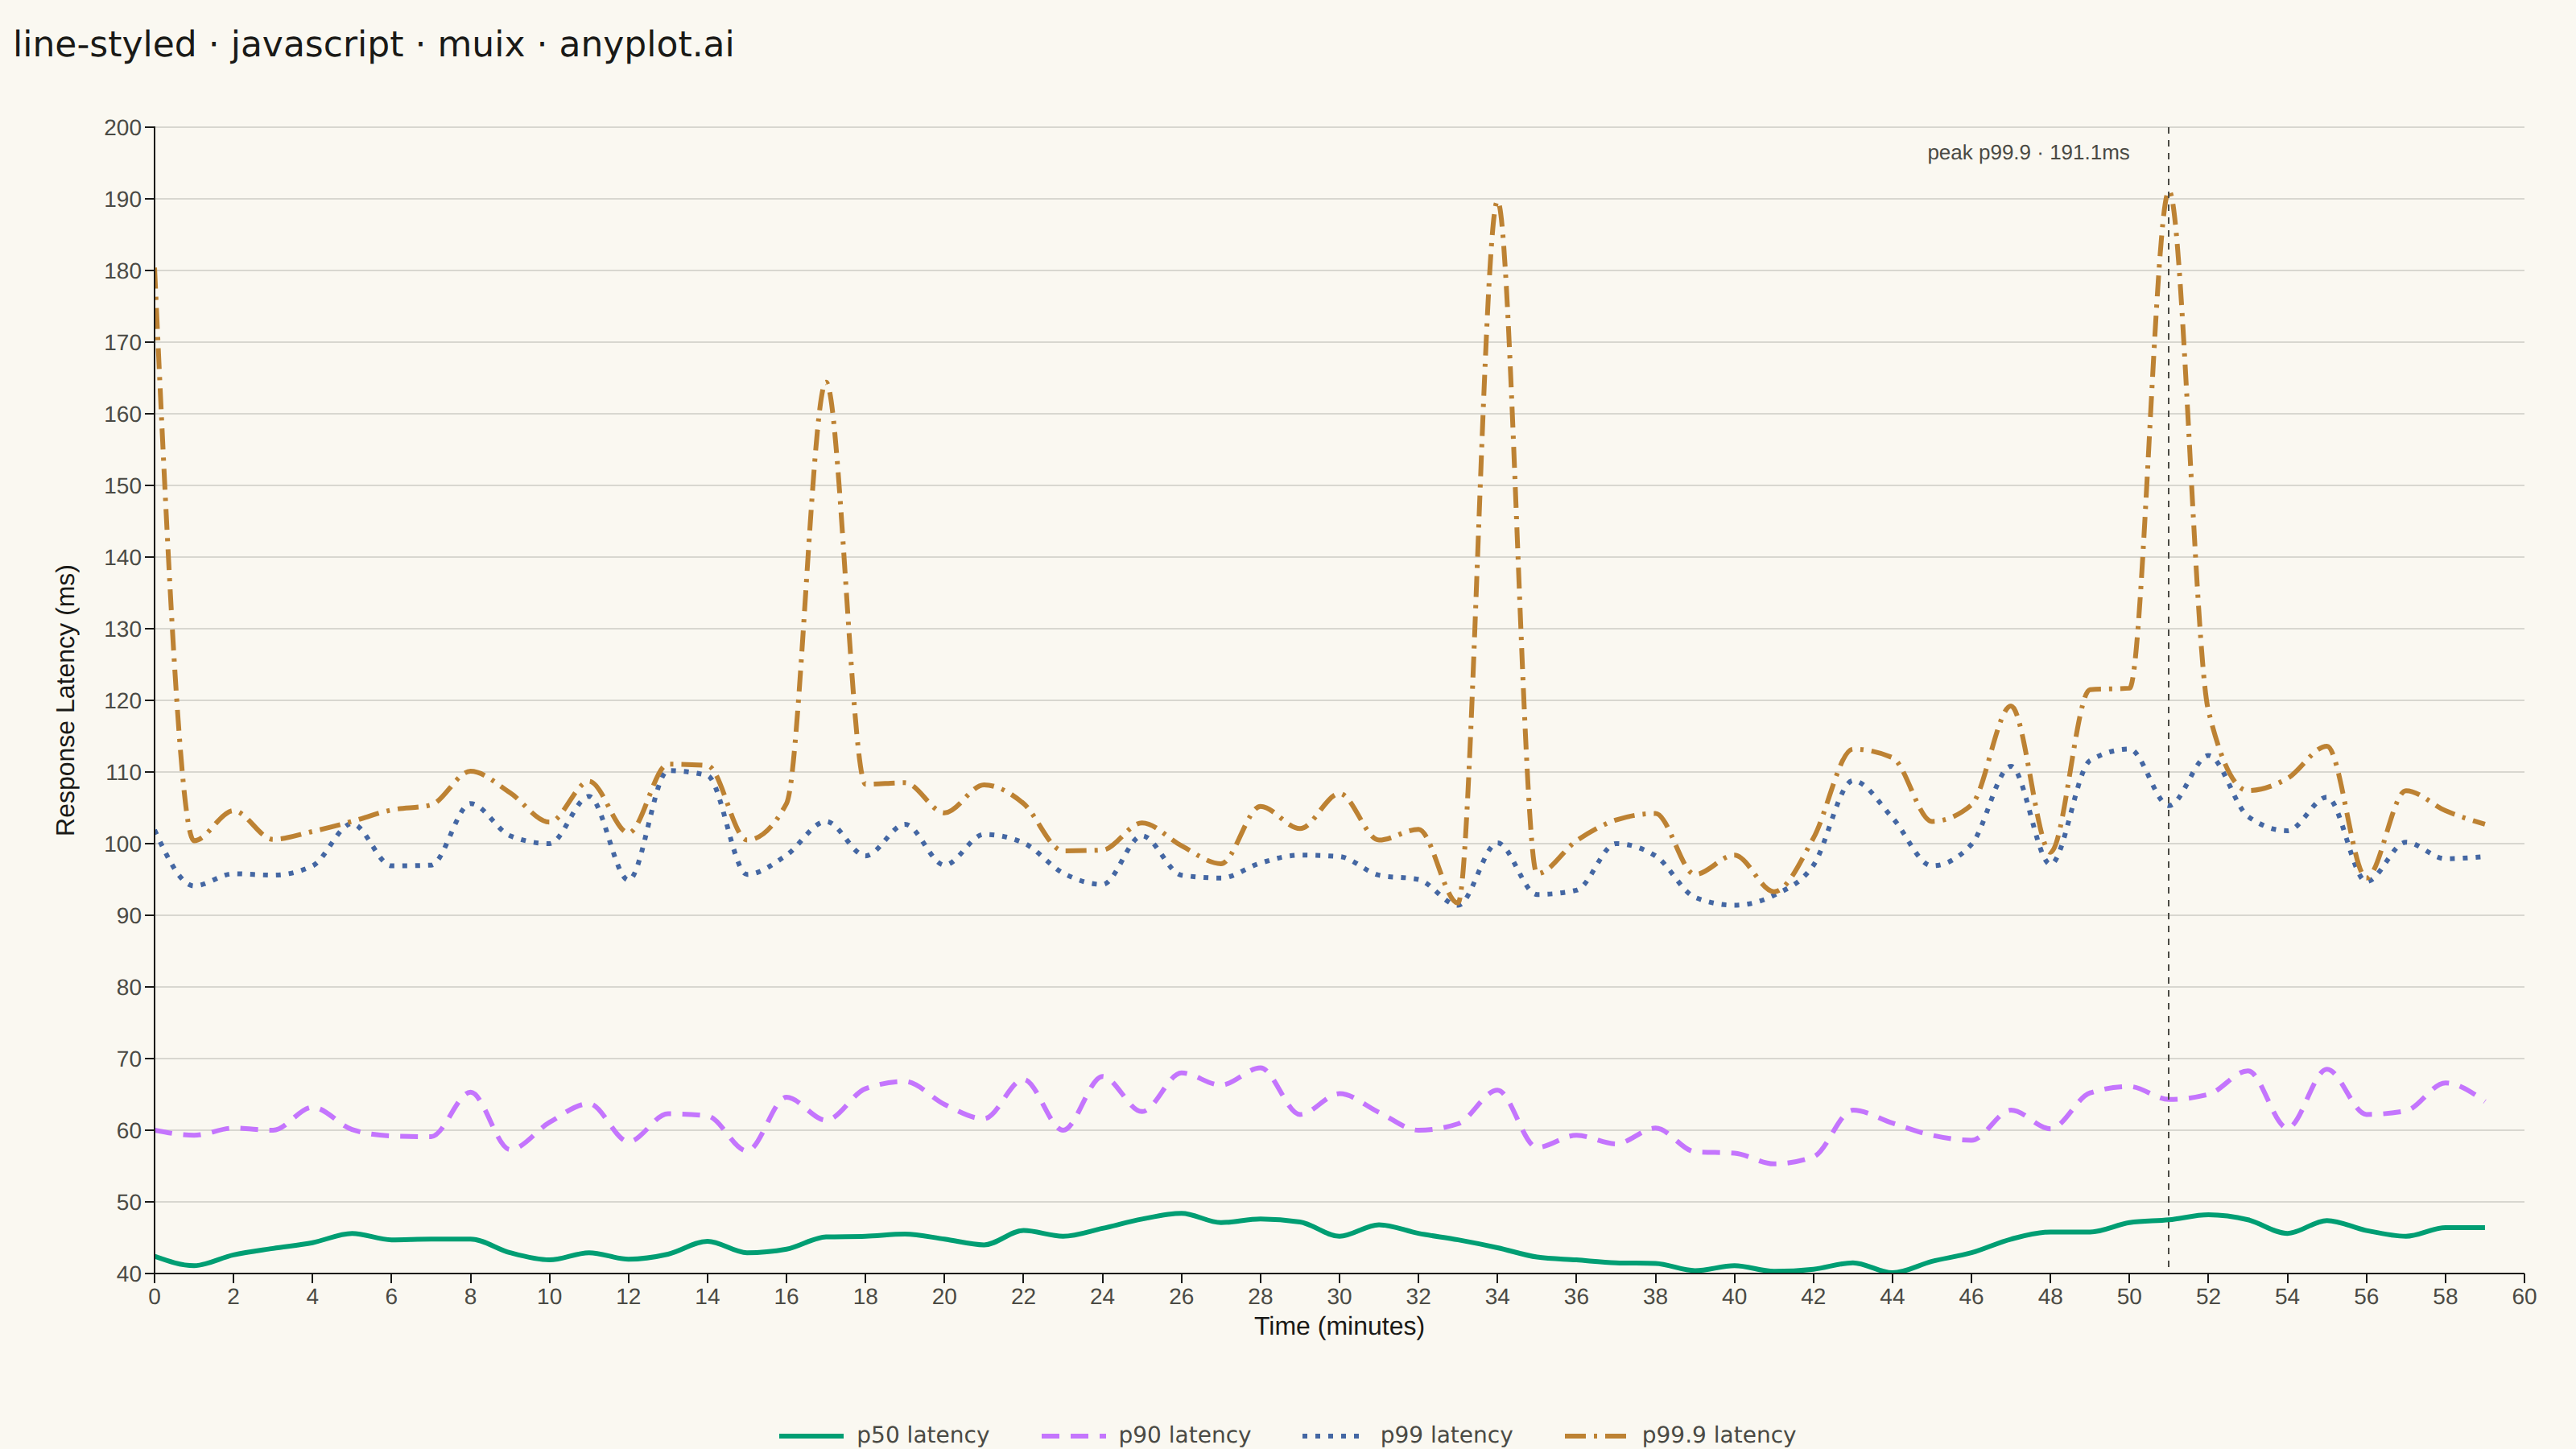
A line plot using different line styles (solid, dashed, dotted, dash-dot) to distinguish multiple data series. This is especially useful for black-and-white printing or when color distinction is insufficient.
// anyplot.ai
// line-styled: Styled Line Plot
// Library: muix 7.29.1 | JavaScript 22.23.2
// Quality: 91/100 | Created: 2026-09-05
import {
  LineChart,
  lineElementClasses,
  getLineElementUtilityClass,
} from "@mui/x-charts/LineChart";
import { ChartsReferenceLine } from "@mui/x-charts/ChartsReferenceLine";

const t = window.ANYPLOT_TOKENS;

// --- Data (in-memory, deterministic mulberry32 PRNG) ------------------------
function mulberry32(seed: number) {
  return () => {
    seed |= 0;
    seed = (seed + 0x6d2b79f5) | 0;
    let x = Math.imul(seed ^ (seed >>> 15), 1 | seed);
    x = (x + Math.imul(x ^ (x >>> 7), 61 | x)) ^ x;
    return ((x ^ (x >>> 14)) >>> 0) / 4294967296;
  };
}
const rand = mulberry32(42);

const MINUTES = Array.from({ length: 60 }, (_, i) => i);

const p50: number[] = [];
const p90: number[] = [];
const p99: number[] = [];
const p999: number[] = [];
let baseline = 42;
for (let i = 0; i < MINUTES.length; i += 1) {
  baseline += (rand() - 0.5) * 4;
  baseline = Math.min(58, Math.max(32, baseline));
  const tailGap = 14 + rand() * 8;
  const deepTailGap = 30 + rand() * 14 + Math.sin(i / 6) * 6;
  const spike = i % 17 === 0 ? 55 + rand() * 35 : rand() * 10;
  p50.push(Math.round(baseline * 10) / 10);
  p90.push(Math.round((baseline + tailGap) * 10) / 10);
  p99.push(Math.round((baseline + tailGap + deepTailGap) * 10) / 10);
  p999.push(Math.round((baseline + tailGap + deepTailGap + spike) * 10) / 10);
}

// The single largest tail-latency spike is the focal point of the story
// (called out with a reference line below) — find it once, up front.
let peakIndex = 0;
for (let i = 1; i < p999.length; i += 1) {
  if (p999[i] > p999[peakIndex]) peakIndex = i;
}
const peakMinute = MINUTES[peakIndex];
const peakValue = p999[peakIndex];

// Standard line styles mapped to series, so the chart stays legible when
// printed in monochrome (spec: solid, dashed, dotted, dash-dot). p99's dots
// are a touch denser/thicker than a minimal dotted pattern so they stay
// visible where p99 and p99.9 cross, and at small (mobile) render scale.
const SERIES = [
  { id: "p50", label: "p50 latency", dash: "none" },
  { id: "p90", label: "p90 latency", dash: "11 7" },
  { id: "p99", label: "p99 latency", dash: "3 5" },
  { id: "p999", label: "p99.9 latency", dash: "13 5 2 5" },
];

// Consistent line width across styles; strokeDasharray keyed per series id
// via the utility class MUI X attaches to each line's root element.
const lineSx = {
  [`.${lineElementClasses.root}`]: { strokeWidth: 3 },
  ...Object.fromEntries(
    SERIES.map((s) => [
      `.${getLineElementUtilityClass(`series-${s.id}`)}`,
      { strokeDasharray: s.dash },
    ]),
  ),
};

// Custom legend swatch: a short dashed line sample next to the series name.
// MUI X's built-in legend only draws color squares (no dash preview) and its
// bottom-anchored position ignores the chart's own margin, so a plain HTML
// row below the chart both fixes the layout and shows the actual line style.
function LegendRow({ topGap }: { topGap: number }) {
  return (
    <div
      style={{
        display: "flex",
        justifyContent: "center",
        alignItems: "center",
        gap: 32,
        paddingTop: topGap,
        fontFamily: "system-ui, sans-serif",
      }}
    >
      {SERIES.map((s, i) => (
        <div
          key={s.id}
          style={{ display: "flex", alignItems: "center", gap: 8 }}
        >
          <svg width={40} height={14}>
            <line
              x1={0}
              y1={7}
              x2={40}
              y2={7}
              stroke={t.palette[i]}
              strokeWidth={3}
              strokeDasharray={s.dash}
            />
          </svg>
          <span style={{ fontSize: 14, color: t.inkSoft }}>{s.label}</span>
        </div>
      ))}
    </div>
  );
}

// --- Chart (default-exported component — the harness mounts it) -------------
export default function Chart() {
  const { width, height } = window.ANYPLOT_SIZE;
  const titleHeight = 56;
  const legendHeight = 48;
  const chartHeight = height - titleHeight - legendHeight;

  return (
    <div style={{ width, height, display: "flex", flexDirection: "column" }}>
      <div
        style={{
          height: titleHeight,
          display: "flex",
          alignItems: "center",
          paddingLeft: 8,
          fontSize: 22,
          fontWeight: 500,
          color: t.ink,
          fontFamily: "system-ui, sans-serif",
        }}
      >
        line-styled · javascript · muix · anyplot.ai
      </div>
      <LineChart
        width={width}
        height={chartHeight}
        skipAnimation
        dataset={MINUTES.map((minute, i) => ({
          minute,
          p50: p50[i],
          p90: p90[i],
          p99: p99[i],
          p999: p999[i],
        }))}
        xAxis={[
          {
            dataKey: "minute",
            label: "Time (minutes)",
            scaleType: "linear",
            labelStyle: { fontSize: 16, fill: t.ink },
            tickLabelStyle: { fontSize: 14, fill: t.inkSoft },
          },
        ]}
        yAxis={[
          {
            label: "Response Latency (ms)",
            // MUI X positions the axis label at a fixed `tickFontSize + tickSize
            // + 10` offset from the axis line, independent of how wide the tick
            // numbers actually render — with 3-digit ticks (up to "190") the
            // real default collides with the label. `tickFontSize` only feeds
            // that offset math here since `tickLabelStyle.fontSize` below wins
            // for the rendered numbers, so bumping it clears the collision
            // without changing the tick numbers' visual size.
            tickFontSize: 34,
            labelStyle: { fontSize: 16, fill: t.ink },
            tickLabelStyle: { fontSize: 14, fill: t.inkSoft },
          },
        ]}
        series={SERIES.map((s, i) => ({
          id: s.id,
          dataKey: s.id,
          label: s.label,
          color: t.palette[i],
          curve: "monotoneX",
          showMark: false,
        }))}
        grid={{ horizontal: true }}
        margin={{ top: 20, right: 32, bottom: 64, left: 96 }}
        slots={{ legend: () => null }}
        sx={{
          ...lineSx,
          "& .MuiChartsAxisLine": { stroke: t.inkSoft },
          "& .MuiChartsAxisTick": { stroke: t.inkSoft },
        }}
      >
        {/* Focal-point touch: mark the single largest tail-latency spike
            instead of leaving the p99.9 story purely implicit. */}
        <ChartsReferenceLine
          x={peakMinute}
          label={`peak p99.9 · ${peakValue}ms`}
          labelAlign="start"
          spacing={{ x: -150, y: 10 }}
          lineStyle={{ stroke: t.inkSoft, strokeDasharray: "4 4" }}
          labelStyle={{ fontSize: 13, fill: t.inkSoft }}
        />
      </LineChart>
      <LegendRow topGap={legendHeight - 14 - 8} />
    </div>
  );
}
Runnable source as JSON, for any HTTP client: https://api.anyplot.ai/specs/line-styled/muix/code. Any spec id and library id listed in llms-full.txt fit the same URL shape; every URL below is complete and callable.
{
  "spec_id": "line-styled",
  "language": "javascript",
  "library": "muix",
  "page": "https://anyplot.ai/line-styled/javascript/muix",
  "hub": "https://anyplot.ai/line-styled",
  "code_json": "https://api.anyplot.ai/specs/line-styled/muix/code",
  "spec_json": "https://api.anyplot.ai/specs/line-styled",
  "render_light_png": "https://storage.googleapis.com/anyplot-images/plots/line-styled/javascript/muix/plot-light.png",
  "render_dark_png": "https://storage.googleapis.com/anyplot-images/plots/line-styled/javascript/muix/plot-dark.png",
  "interactive_light_html": "https://storage.googleapis.com/anyplot-images/plots/line-styled/javascript/muix/plot-light.html",
  "interactive_dark_html": "https://storage.googleapis.com/anyplot-images/plots/line-styled/javascript/muix/plot-dark.html",
  "quality_score": 91.0,
  "license": "MIT",
  "guide": "https://anyplot.ai/llms.txt"
}
Part of Styled Line Plot on anyplot.ai.