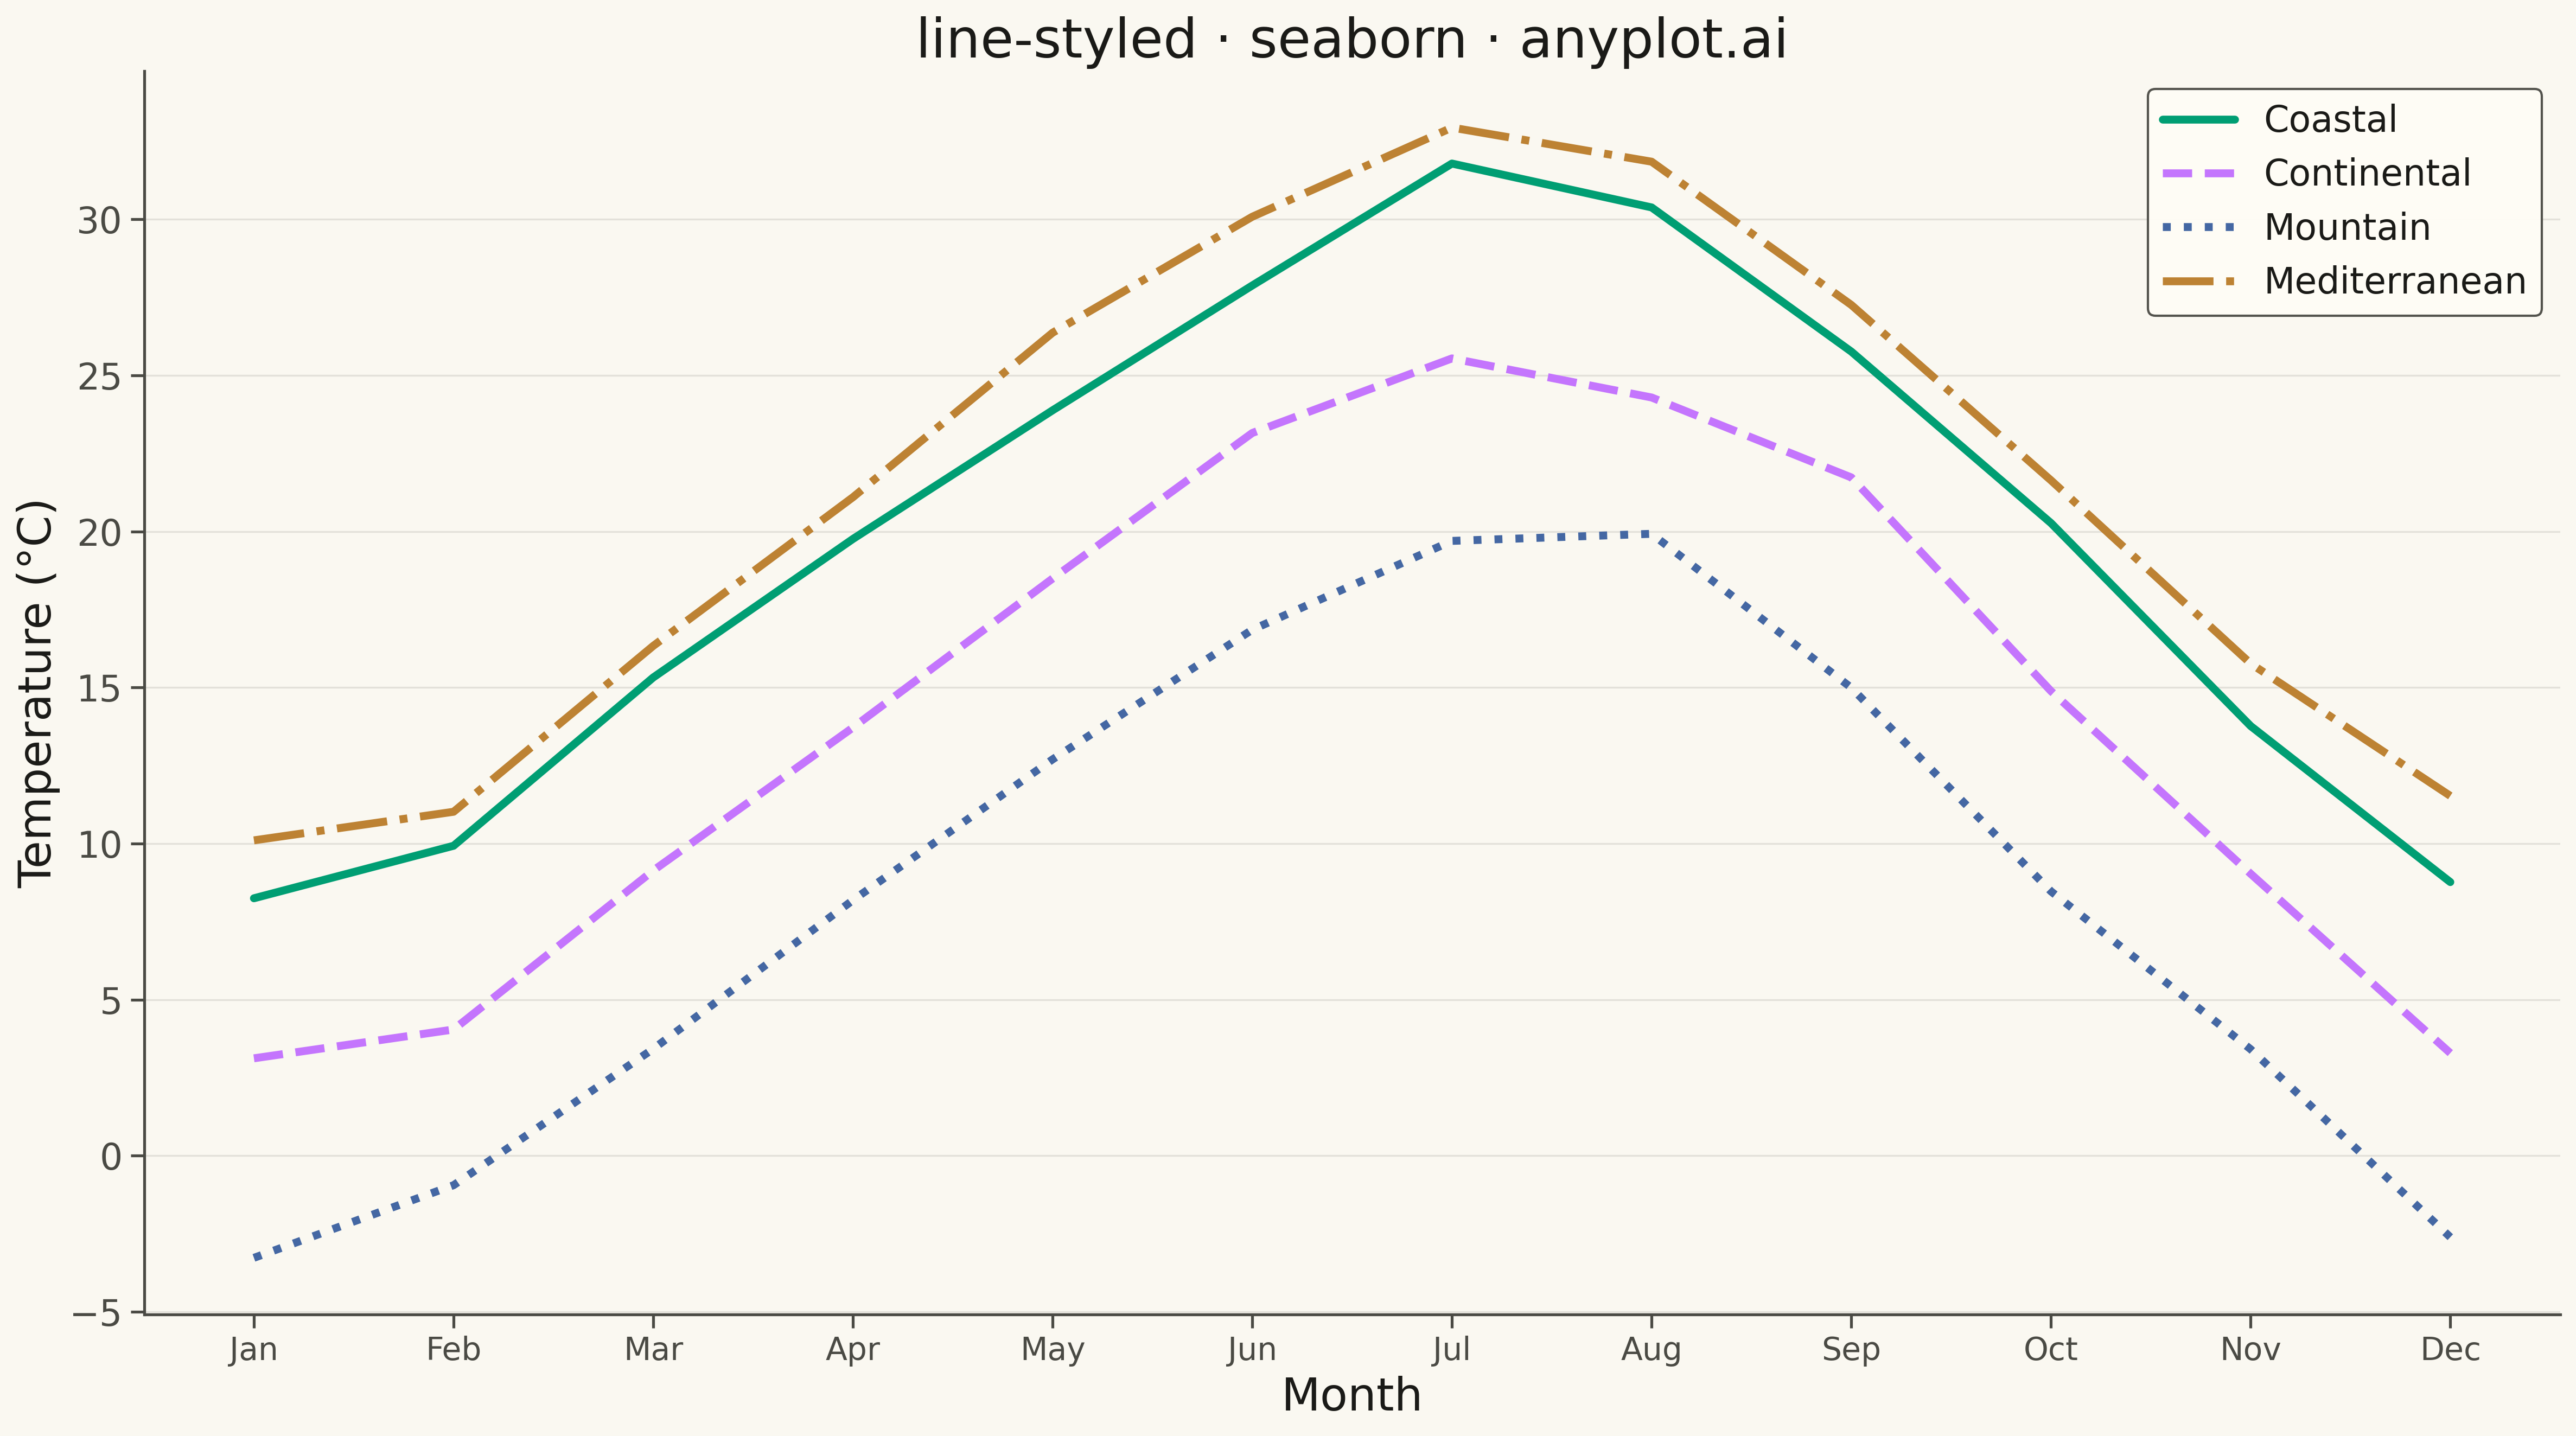
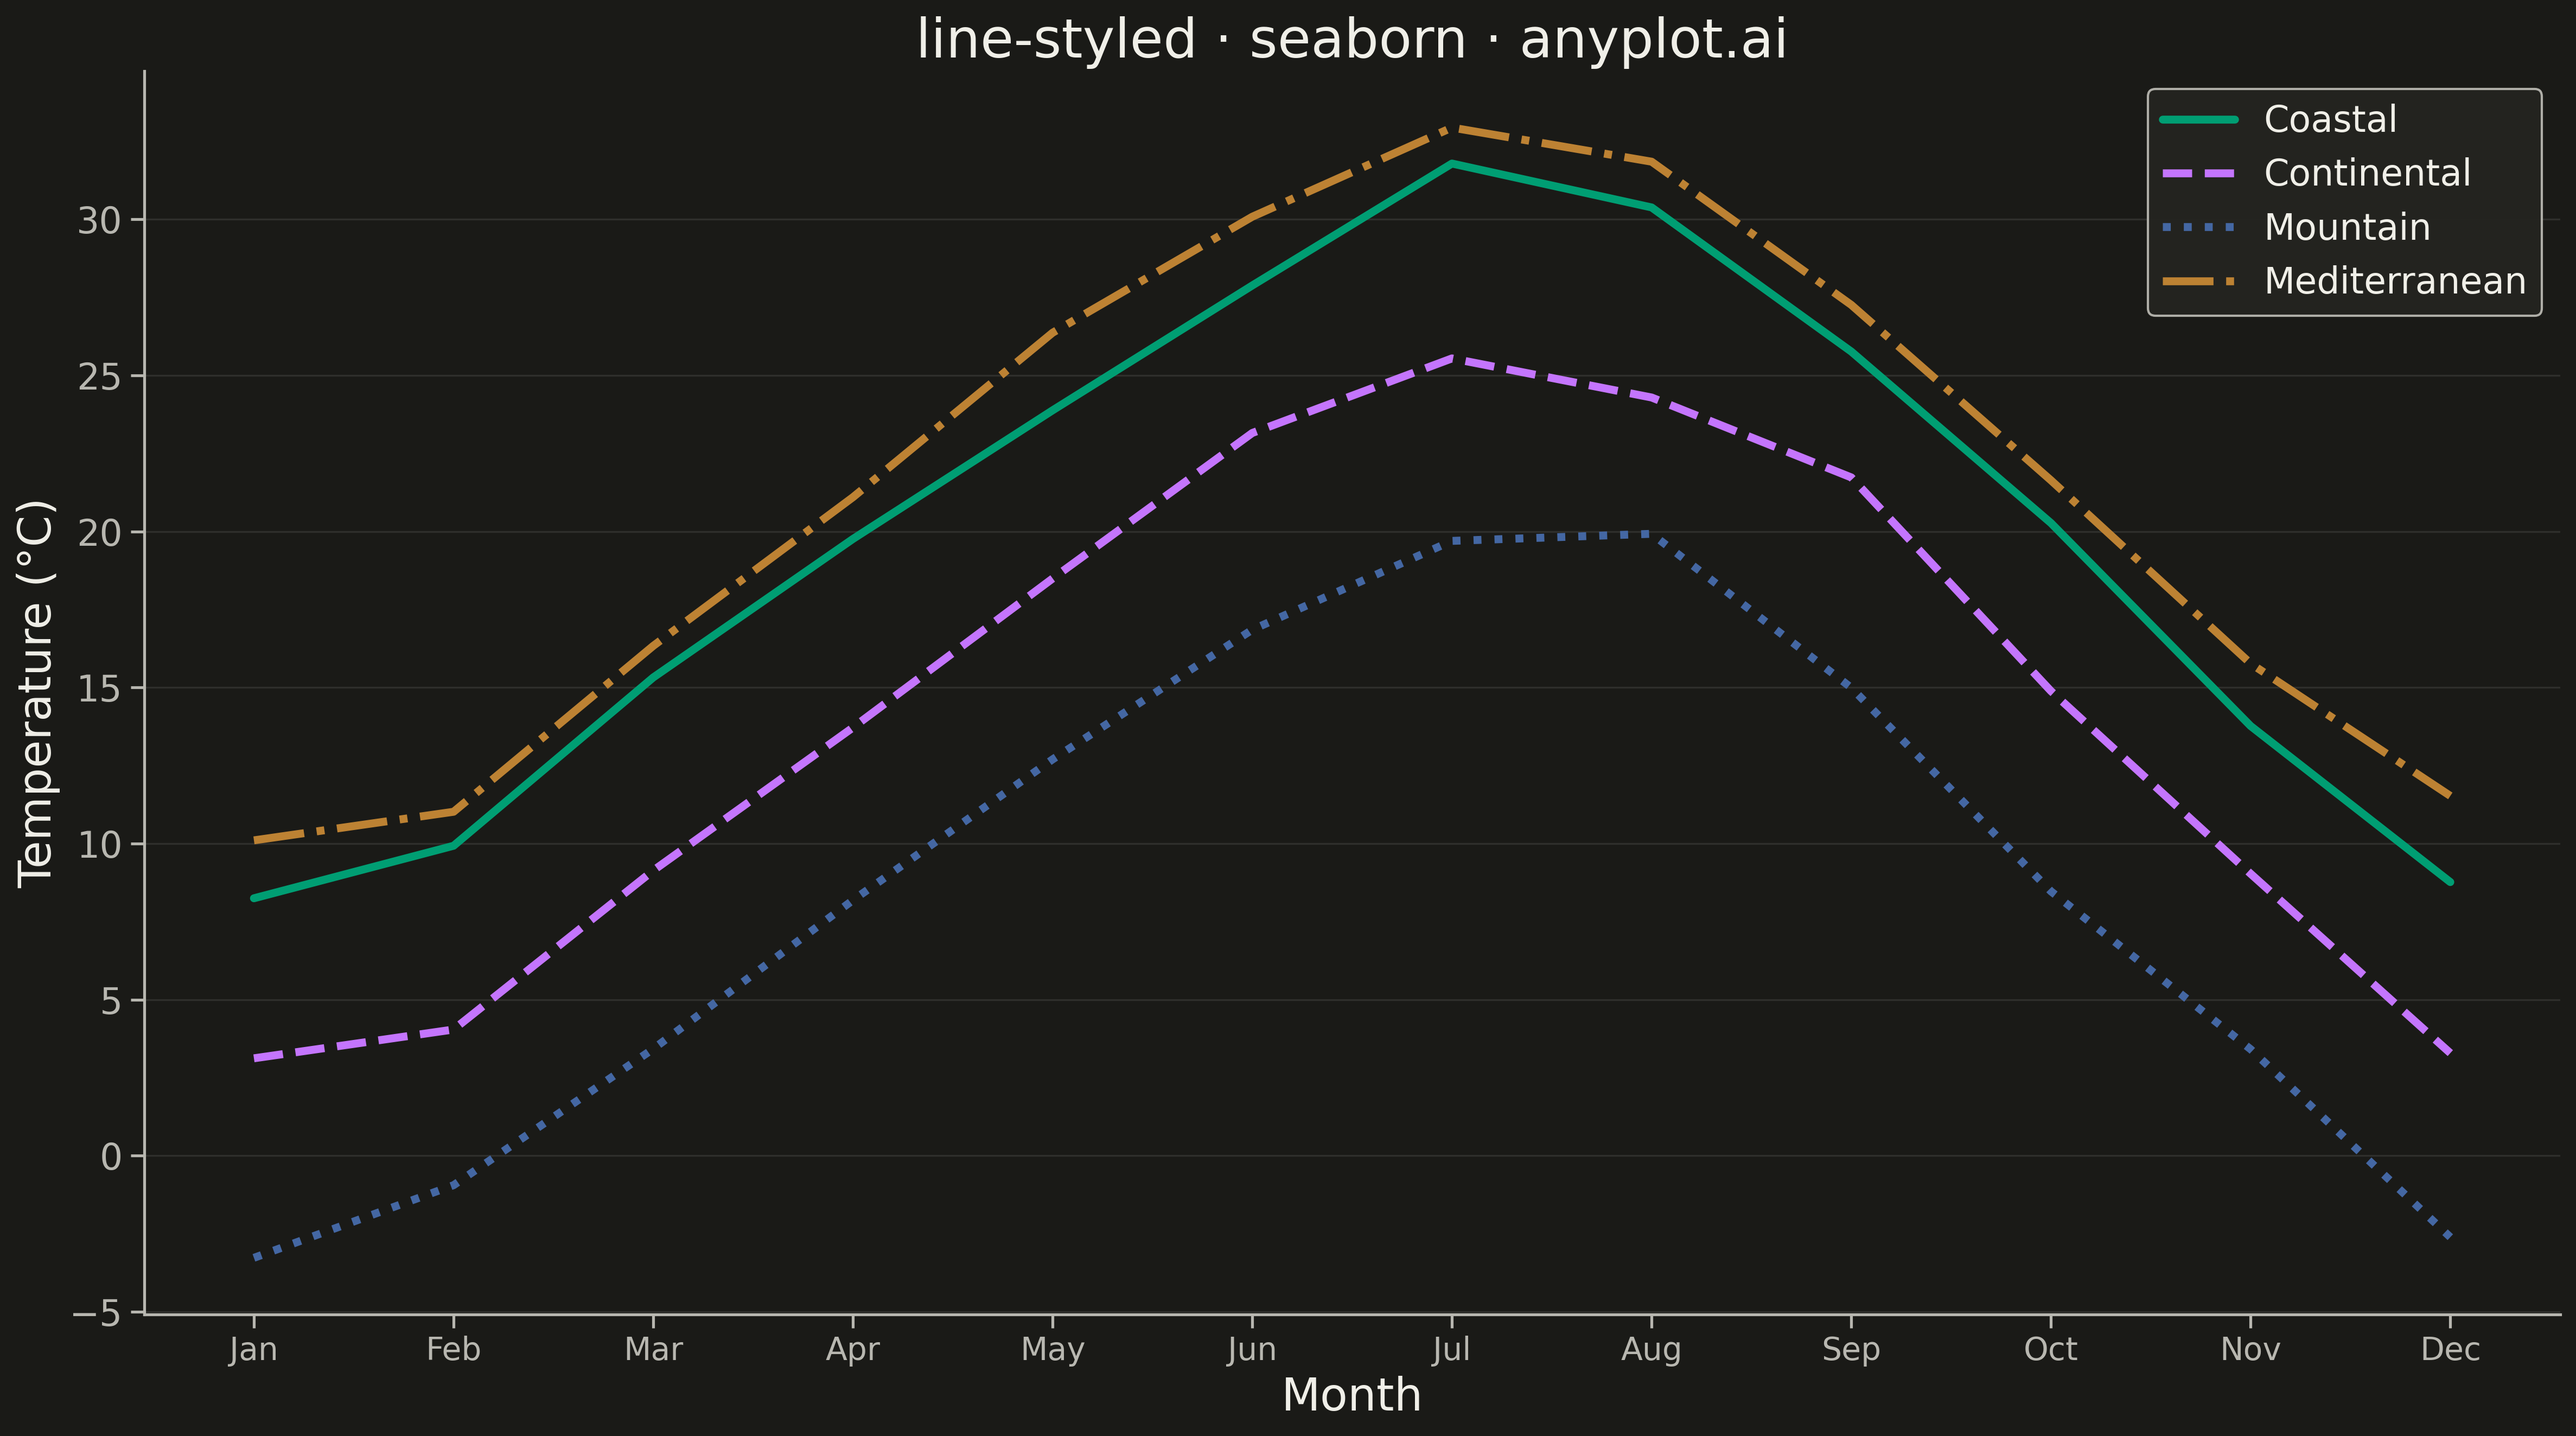
A line plot using different line styles (solid, dashed, dotted, dash-dot) to distinguish multiple data series. This is especially useful for black-and-white printing or when color distinction is insufficient.
""" anyplot.ai
line-styled: Styled Line Plot
Library: seaborn 0.13.2 | Python 3.13.13
Quality: 93/100 | Updated: 2026-05-12
"""

import os

import matplotlib.pyplot as plt
import numpy as np
import seaborn as sns


# Theme tokens
THEME = os.getenv("ANYPLOT_THEME", "light")
PAGE_BG = "#FAF8F1" if THEME == "light" else "#1A1A17"
ELEVATED_BG = "#FFFDF6" if THEME == "light" else "#242420"
INK = "#1A1A17" if THEME == "light" else "#F0EFE8"
INK_SOFT = "#4A4A44" if THEME == "light" else "#B8B7B0"

# Okabe-Ito palette - first series always #009E73
IMPRINT = ["#009E73", "#C475FD", "#4467A3", "#BD8233"]

# Data - Temperature trends across seasons
np.random.seed(42)
months = np.arange(1, 13)
month_names = ["Jan", "Feb", "Mar", "Apr", "May", "Jun", "Jul", "Aug", "Sep", "Oct", "Nov", "Dec"]

# Temperature patterns for different regions (°C)
base_temp = np.array([5, 7, 12, 16, 21, 25, 28, 27, 23, 17, 11, 6])
coastal = base_temp + np.random.randn(12) * 0.5 + 3
continental = base_temp + np.random.randn(12) * 0.5 - 2
mountain = base_temp + np.random.randn(12) * 0.5 - 8
mediterranean = base_temp + np.random.randn(12) * 0.5 + 5

# Plot
sns.set_theme(
    style="ticks",
    rc={
        "figure.facecolor": PAGE_BG,
        "axes.facecolor": PAGE_BG,
        "axes.edgecolor": INK_SOFT,
        "axes.labelcolor": INK,
        "text.color": INK,
        "xtick.color": INK_SOFT,
        "ytick.color": INK_SOFT,
        "grid.color": INK,
        "grid.alpha": 0.10,
        "legend.facecolor": ELEVATED_BG,
        "legend.edgecolor": INK_SOFT,
    },
)

fig, ax = plt.subplots(figsize=(16, 9), facecolor=PAGE_BG)

# Line styles: solid, dashed, dotted, dashdot
line_styles = ["-", "--", ":", "-."]
labels = ["Coastal", "Continental", "Mountain", "Mediterranean"]
data_series = [coastal, continental, mountain, mediterranean]

for data, label, ls, color in zip(data_series, labels, line_styles, IMPRINT, strict=True):
    ax.plot(months, data, linestyle=ls, linewidth=3.5, color=color, label=label)

# Styling
ax.set_xlabel("Month", fontsize=20, color=INK)
ax.set_ylabel("Temperature (°C)", fontsize=20, color=INK)
ax.set_title("line-styled · seaborn · anyplot.ai", fontsize=24, fontweight="medium", color=INK)
ax.tick_params(axis="both", labelsize=16, colors=INK_SOFT)
ax.set_xticks(months)
ax.set_xticklabels(month_names, fontsize=14, color=INK_SOFT)
ax.yaxis.grid(True, alpha=0.10, linewidth=0.8, color=INK)
ax.spines["top"].set_visible(False)
ax.spines["right"].set_visible(False)
for s in ("left", "bottom"):
    ax.spines[s].set_color(INK_SOFT)
ax.legend(fontsize=16, loc="upper right", framealpha=0.95, facecolor=ELEVATED_BG, edgecolor=INK_SOFT)

plt.tight_layout()
plt.savefig(f"plot-{THEME}.png", dpi=300, bbox_inches="tight", facecolor=PAGE_BG)
Runnable source as JSON, for any HTTP client: https://api.anyplot.ai/specs/line-styled/seaborn/code. Any spec id and library id listed in llms-full.txt fit the same URL shape; every URL below is complete and callable.
{
  "spec_id": "line-styled",
  "language": "python",
  "library": "seaborn",
  "page": "https://anyplot.ai/line-styled/python/seaborn",
  "hub": "https://anyplot.ai/line-styled",
  "code_json": "https://api.anyplot.ai/specs/line-styled/seaborn/code",
  "spec_json": "https://api.anyplot.ai/specs/line-styled",
  "render_light_png": "https://storage.googleapis.com/anyplot-images/plots/line-styled/python/seaborn/plot-light.png",
  "render_dark_png": "https://storage.googleapis.com/anyplot-images/plots/line-styled/python/seaborn/plot-dark.png",
  "quality_score": 93.0,
  "license": "MIT",
  "guide": "https://anyplot.ai/llms.txt"
}
Part of Styled Line Plot on anyplot.ai.