The same plot in 14 other libraries — Python: Altair, Bokeh, lets-plot, Matplotlib, Plotly, plotnine, Pygal, Seaborn; R: ggplot2; JavaScript: Chart.js, D3.js, Apache ECharts, Highcharts, MUI X Charts. Compare all 15 side by side: Styled Line Plot in Python, R, Julia and JavaScript.
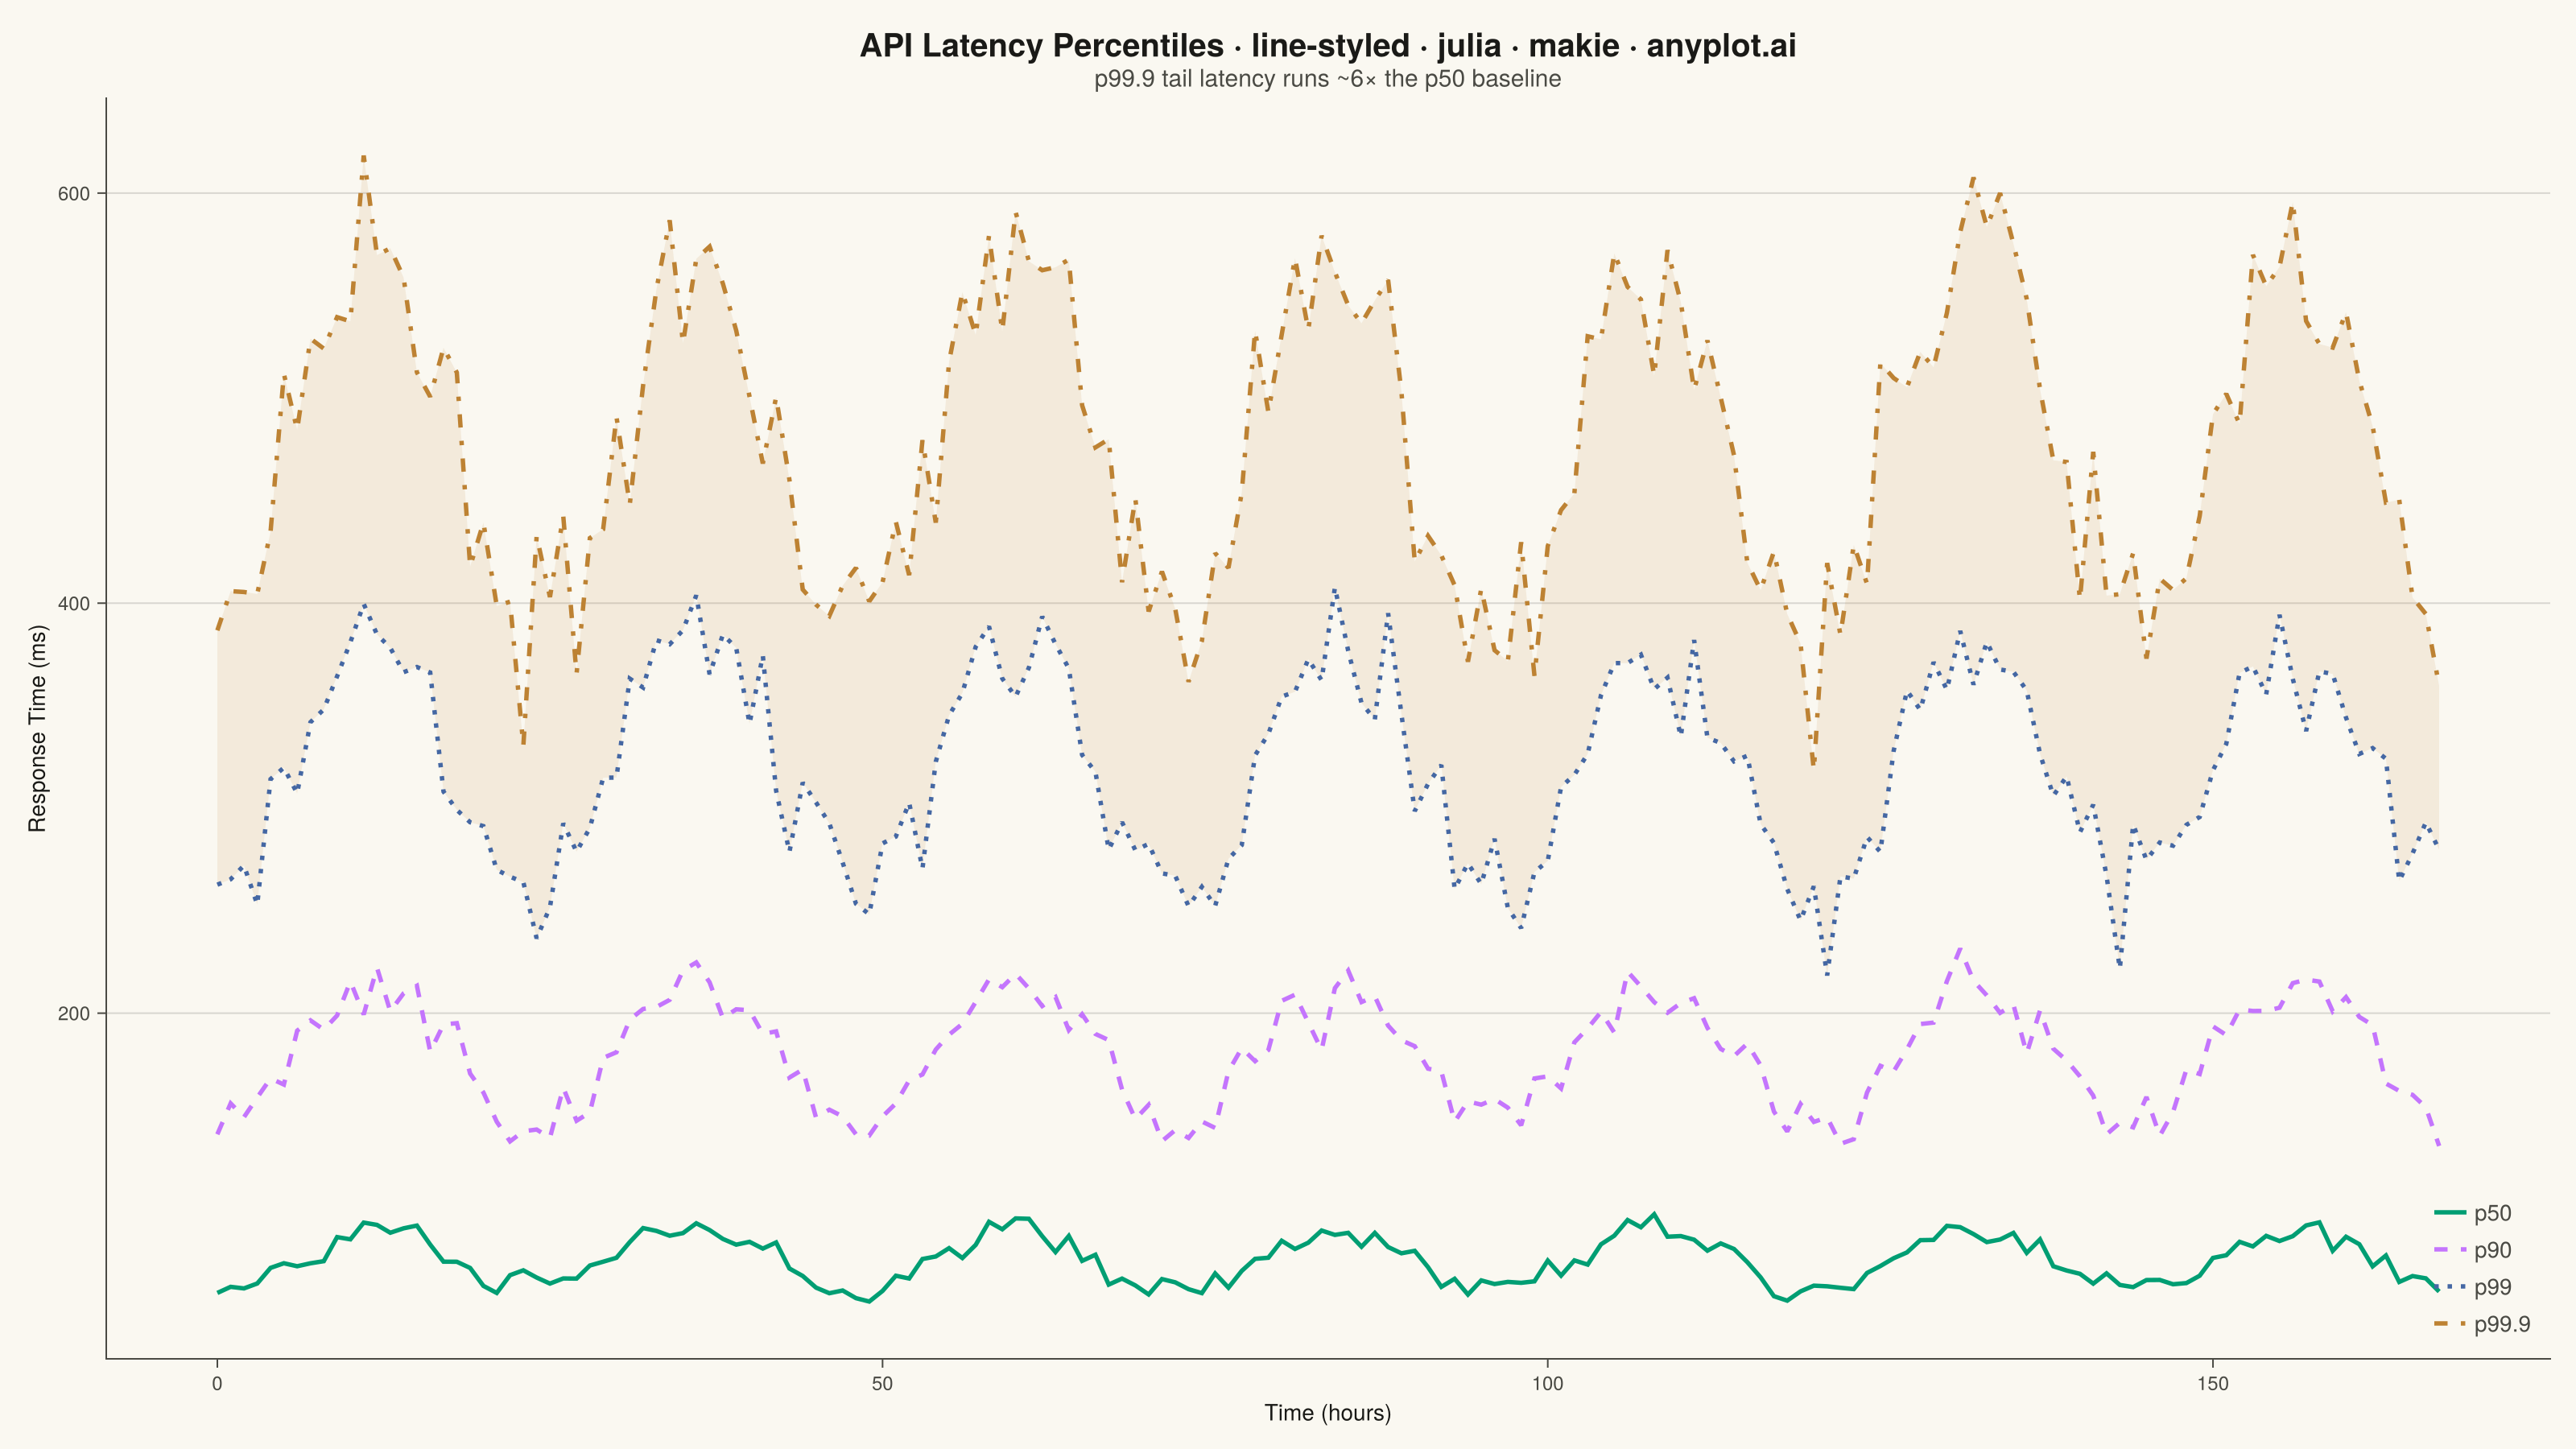
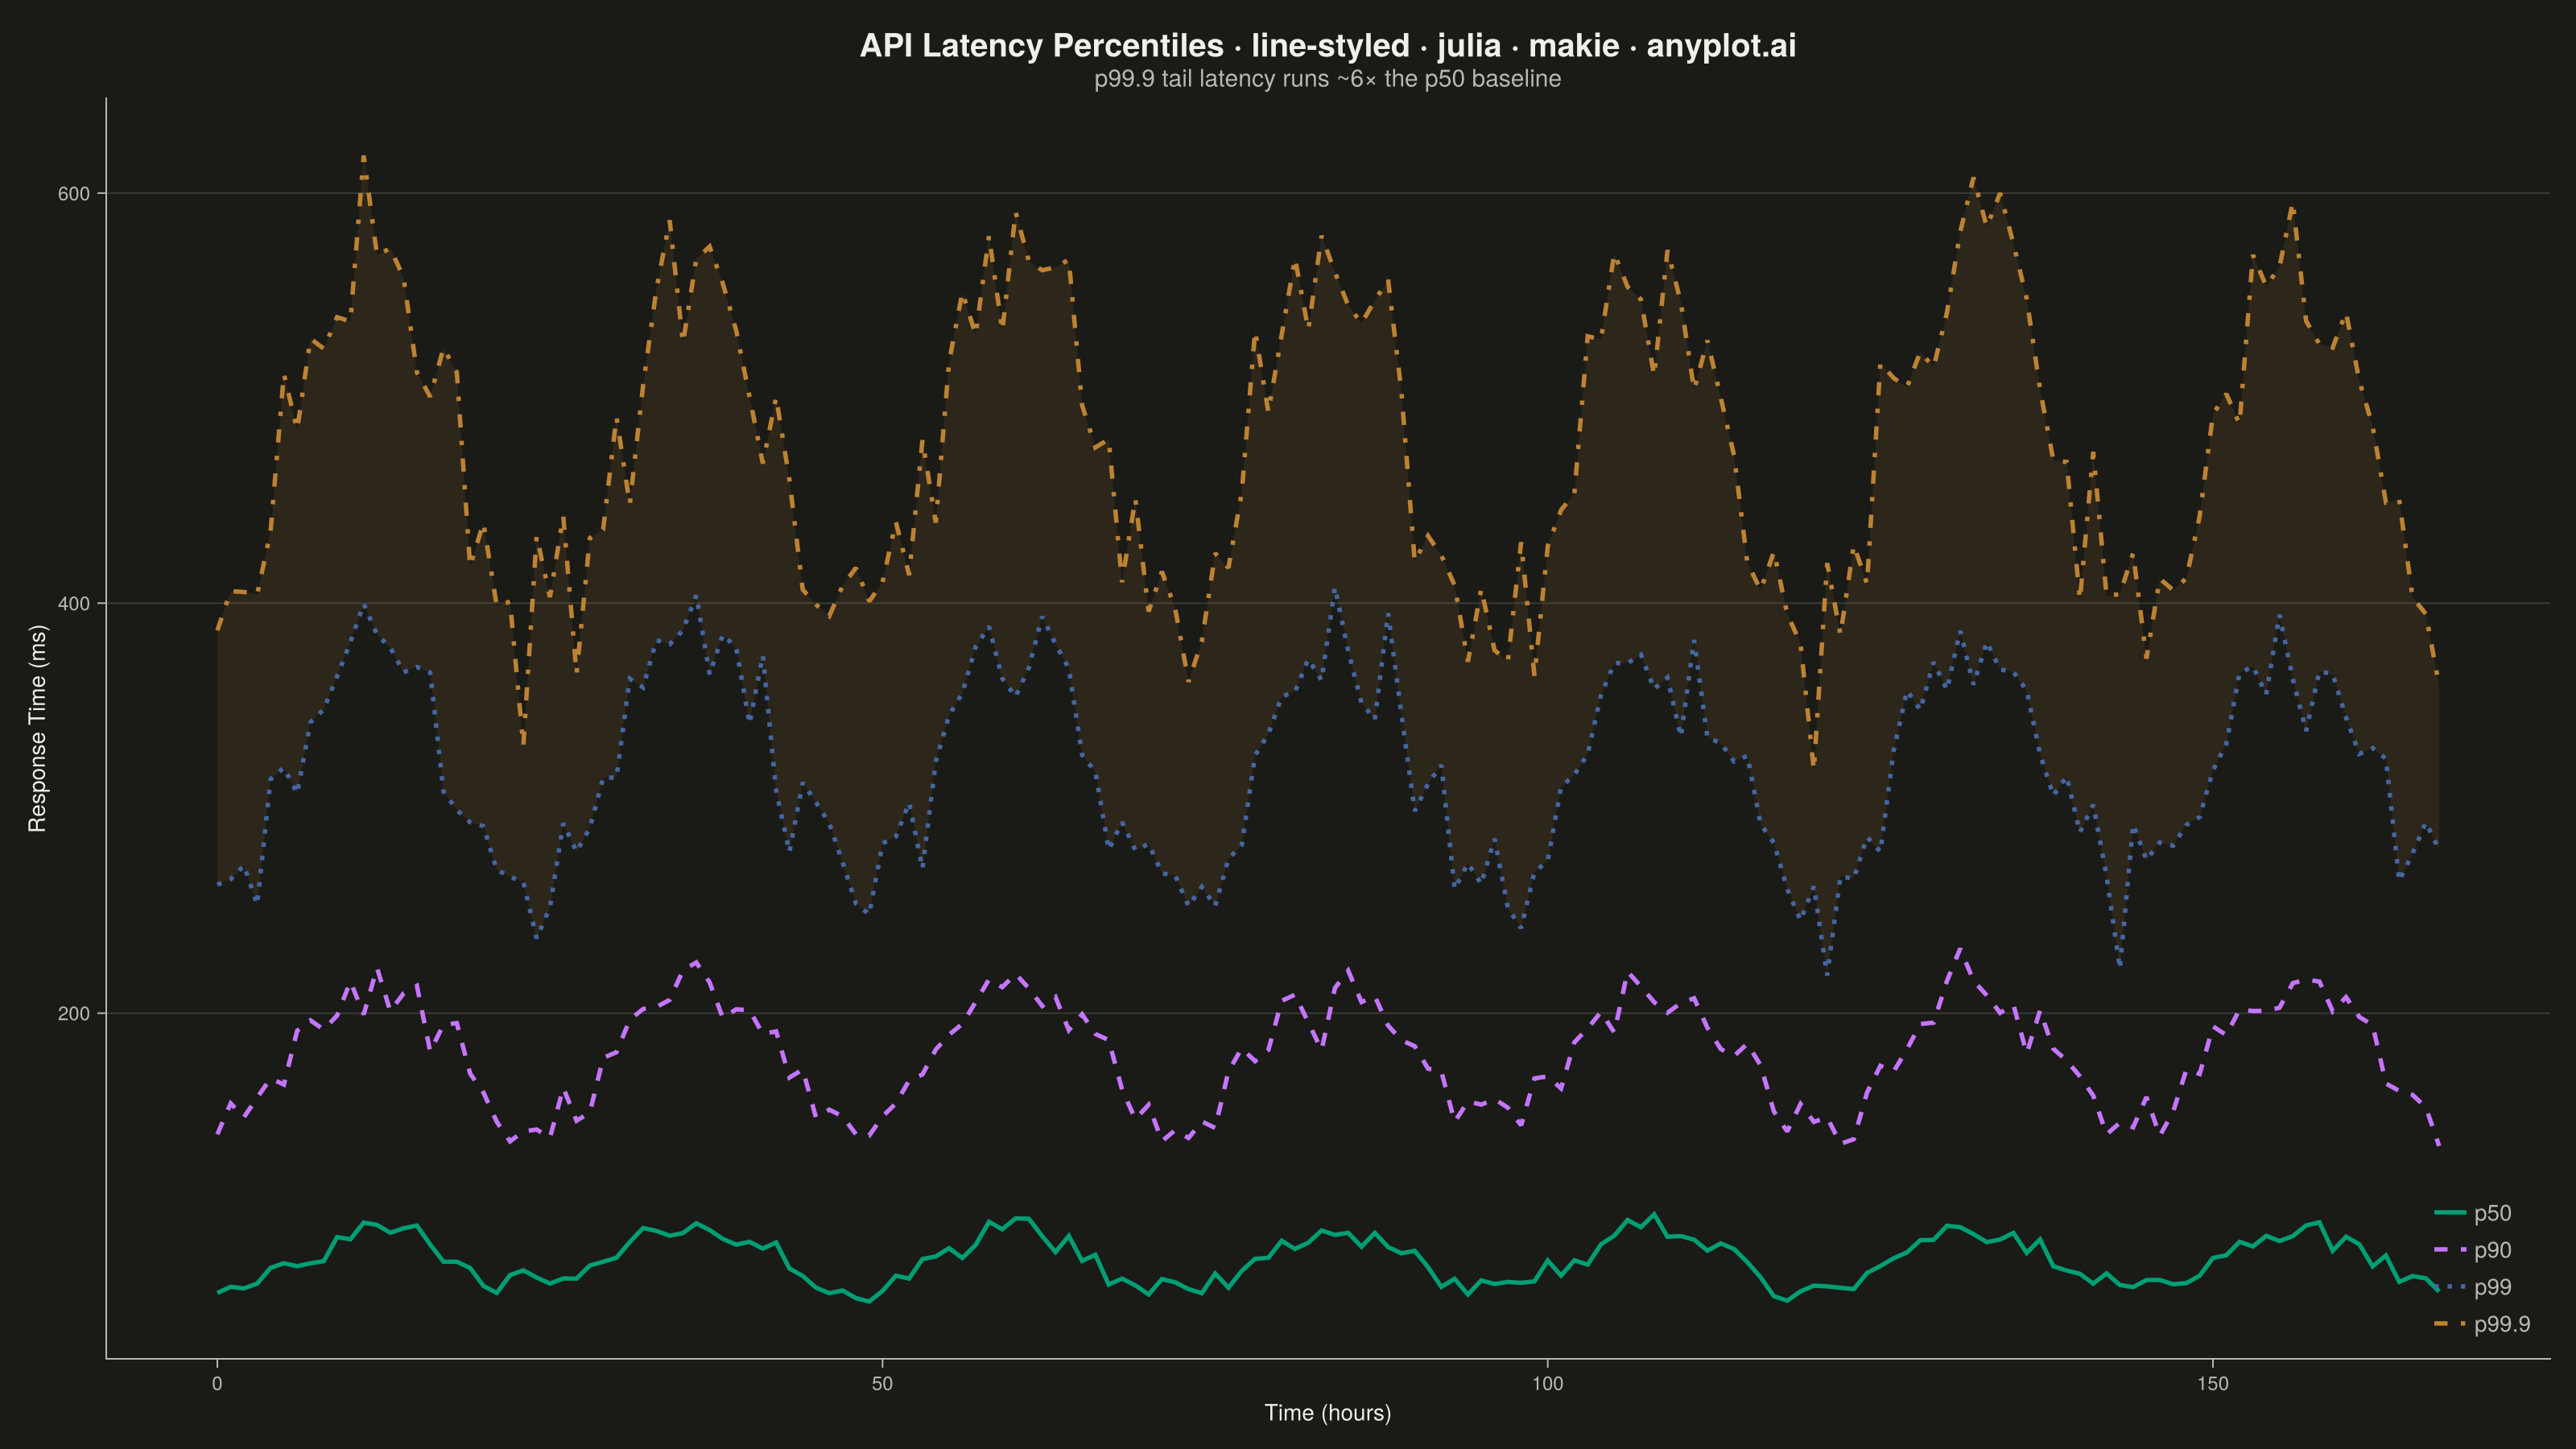
A line plot using different line styles (solid, dashed, dotted, dash-dot) to distinguish multiple data series. This is especially useful for black-and-white printing or when color distinction is insufficient.
# anyplot.ai
# line-styled: Styled Line Plot
# Library: makie 0.21.9 | Julia 1.11.9
# Quality: 89/100 | Created: 2026-09-05

using CairoMakie
using Colors
using Random

Random.seed!(42)

# --- Theme tokens (see prompts/default-style-guide.md "Theme-adaptive Chrome") ---
const THEME    = get(ENV, "ANYPLOT_THEME", "light")
const PAGE_BG  = THEME == "light" ? colorant"#FAF8F1" : colorant"#1A1A17"
const INK      = THEME == "light" ? colorant"#1A1A17" : colorant"#F0EFE8"
const INK_SOFT = THEME == "light" ? colorant"#4A4A44" : colorant"#B8B7B0"

# Imprint palette (position 1-4) — theme-independent
const IMPRINT_PALETTE = [
    colorant"#009E73",  # 1 — brand green
    colorant"#C475FD",  # 2 — lavender
    colorant"#4467A3",  # 3 — blue
    colorant"#BD8233",  # 4 — ochre
]

# --- Data: hourly latency percentiles over a week of web traffic ------------
hours = 0:167  # 7 days x 24h
daily_cycle = sin.(2π .* mod.(hours, 24) ./ 24 .- π / 2)  # peaks around midday

p50 = 80.0 .+ 15.0 .* daily_cycle .+ randn(length(hours)) .* 4.0
p90 = 180.0 .+ 35.0 .* daily_cycle .+ randn(length(hours)) .* 8.0
p99 = 320.0 .+ 60.0 .* daily_cycle .+ randn(length(hours)) .* 15.0
p999 = 480.0 .+ 90.0 .* daily_cycle .+ randn(length(hours)) .* 25.0

# --- Plot ---------------------------------------------------------------
fig = Figure(
    resolution      = (1600, 900),
    fontsize        = 14,
    backgroundcolor = PAGE_BG,
)

ax = Axis(
    fig[1, 1];
    title              = "API Latency Percentiles · line-styled · julia · makie · anyplot.ai",
    titlesize          = 20,
    titlecolor         = INK,
    subtitle           = "p99.9 tail latency runs ~6× the p50 baseline",
    subtitlesize       = 15,
    subtitlecolor      = INK_SOFT,
    xlabel             = "Time (hours)",
    ylabel             = "Response Time (ms)",
    xlabelsize         = 14,
    ylabelsize         = 14,
    xlabelcolor        = INK,
    ylabelcolor        = INK,
    xticklabelsize     = 12,
    yticklabelsize     = 12,
    xticklabelcolor    = INK_SOFT,
    yticklabelcolor    = INK_SOFT,
    xtickcolor         = INK_SOFT,
    ytickcolor         = INK_SOFT,
    backgroundcolor    = PAGE_BG,
    topspinevisible    = false,
    rightspinevisible  = false,
    leftspinecolor     = INK_SOFT,
    bottomspinecolor   = INK_SOFT,
    xgridvisible       = false,
    ygridcolor         = RGBAf(INK.r, INK.g, INK.b, 0.15),
)

# Distinctive Makie touch: shade the p99-p99.9 tail spread as a translucent
# band so the widening gap between the two most extreme percentiles reads at
# a glance, without darkening the whole canvas.
band!(ax, hours, p99, p999; color = (IMPRINT_PALETTE[4], 0.12))

lines!(ax, hours, p50; color = IMPRINT_PALETTE[1], linestyle = :solid, linewidth = 2.75, label = "p50")
lines!(ax, hours, p90; color = IMPRINT_PALETTE[2], linestyle = :dash, linewidth = 2.75, label = "p90")
lines!(ax, hours, p99; color = IMPRINT_PALETTE[3], linestyle = :dot, linewidth = 2.75, label = "p99")
lines!(ax, hours, p999; color = IMPRINT_PALETTE[4], linestyle = :dashdot, linewidth = 2.75, label = "p99.9")

axislegend(ax; position = :rb, labelcolor = INK_SOFT, framevisible = false)

# --- Save -----------------------------------------------------------------
save("plot-$(THEME).png", fig; px_per_unit = 2)
Runnable source as JSON, for any HTTP client: https://api.anyplot.ai/specs/line-styled/makie/code. Any spec id and library id listed in llms-full.txt fit the same URL shape; every URL below is complete and callable.
{
  "spec_id": "line-styled",
  "language": "julia",
  "library": "makie",
  "page": "https://anyplot.ai/line-styled/julia/makie",
  "hub": "https://anyplot.ai/line-styled",
  "code_json": "https://api.anyplot.ai/specs/line-styled/makie/code",
  "spec_json": "https://api.anyplot.ai/specs/line-styled",
  "render_light_png": "https://storage.googleapis.com/anyplot-images/plots/line-styled/julia/makie/plot-light.png",
  "render_dark_png": "https://storage.googleapis.com/anyplot-images/plots/line-styled/julia/makie/plot-dark.png",
  "quality_score": 89.0,
  "license": "MIT",
  "guide": "https://anyplot.ai/llms.txt"
}
Part of Styled Line Plot on anyplot.ai.