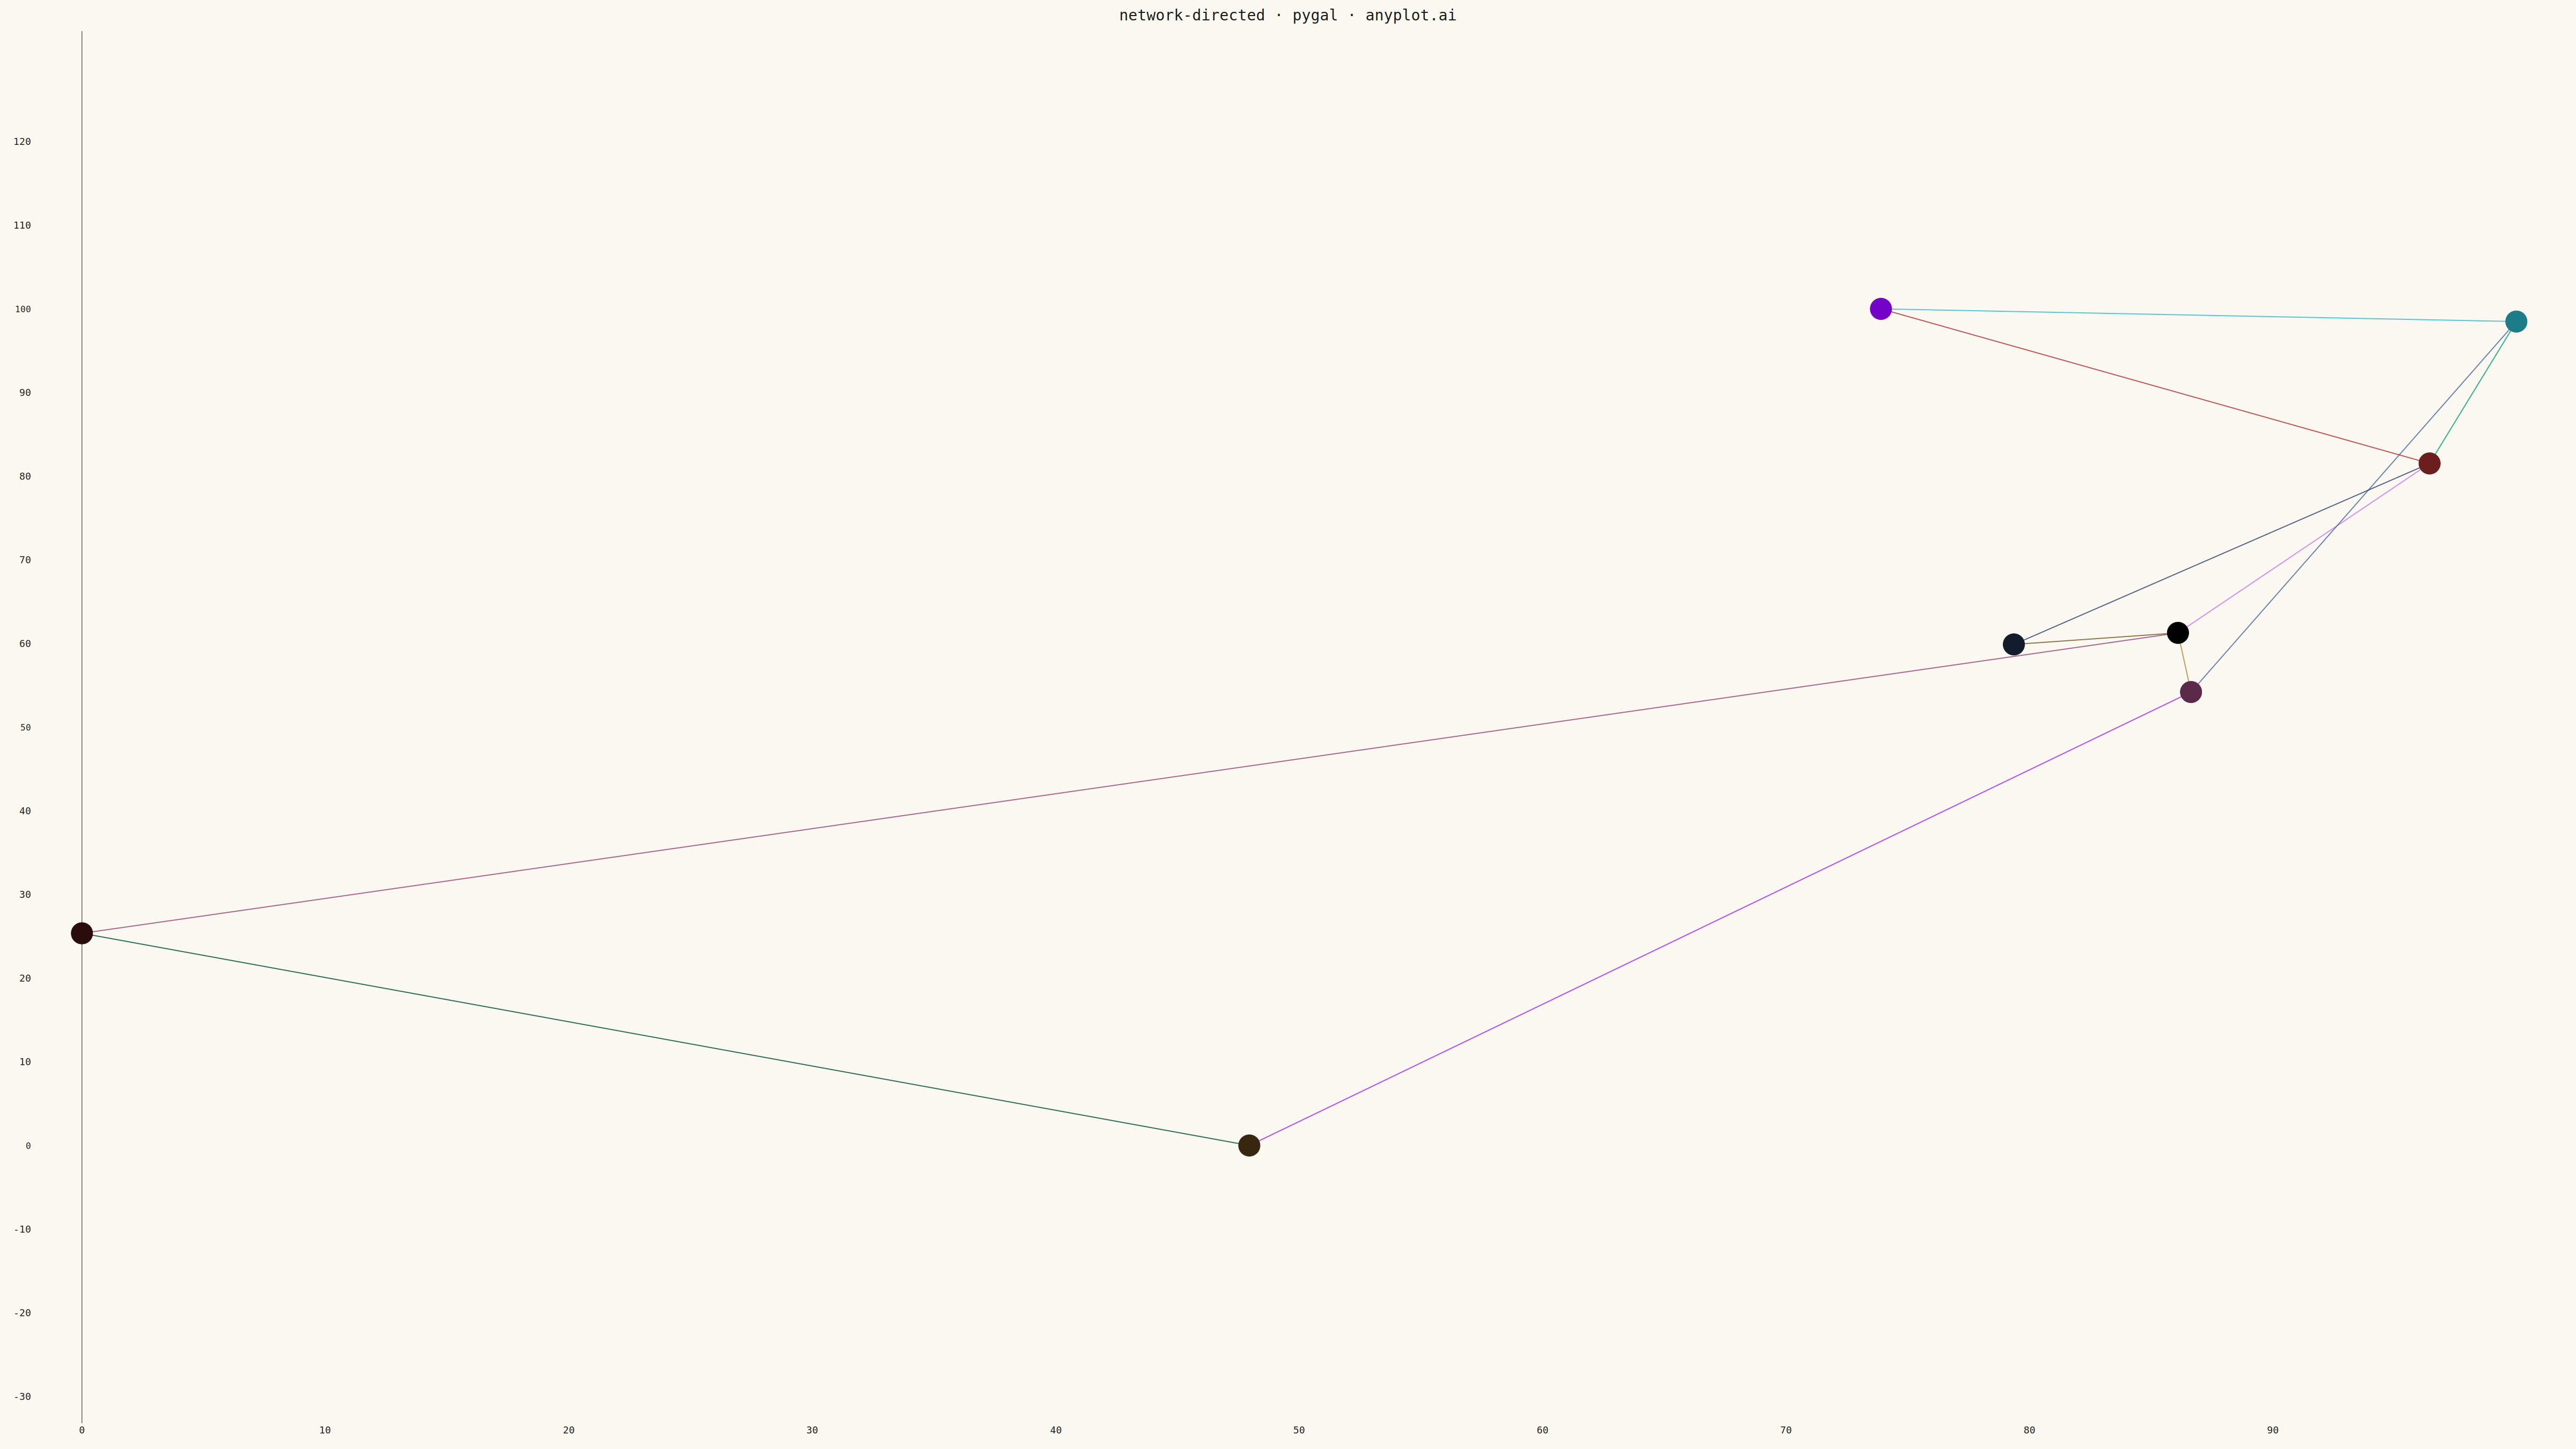
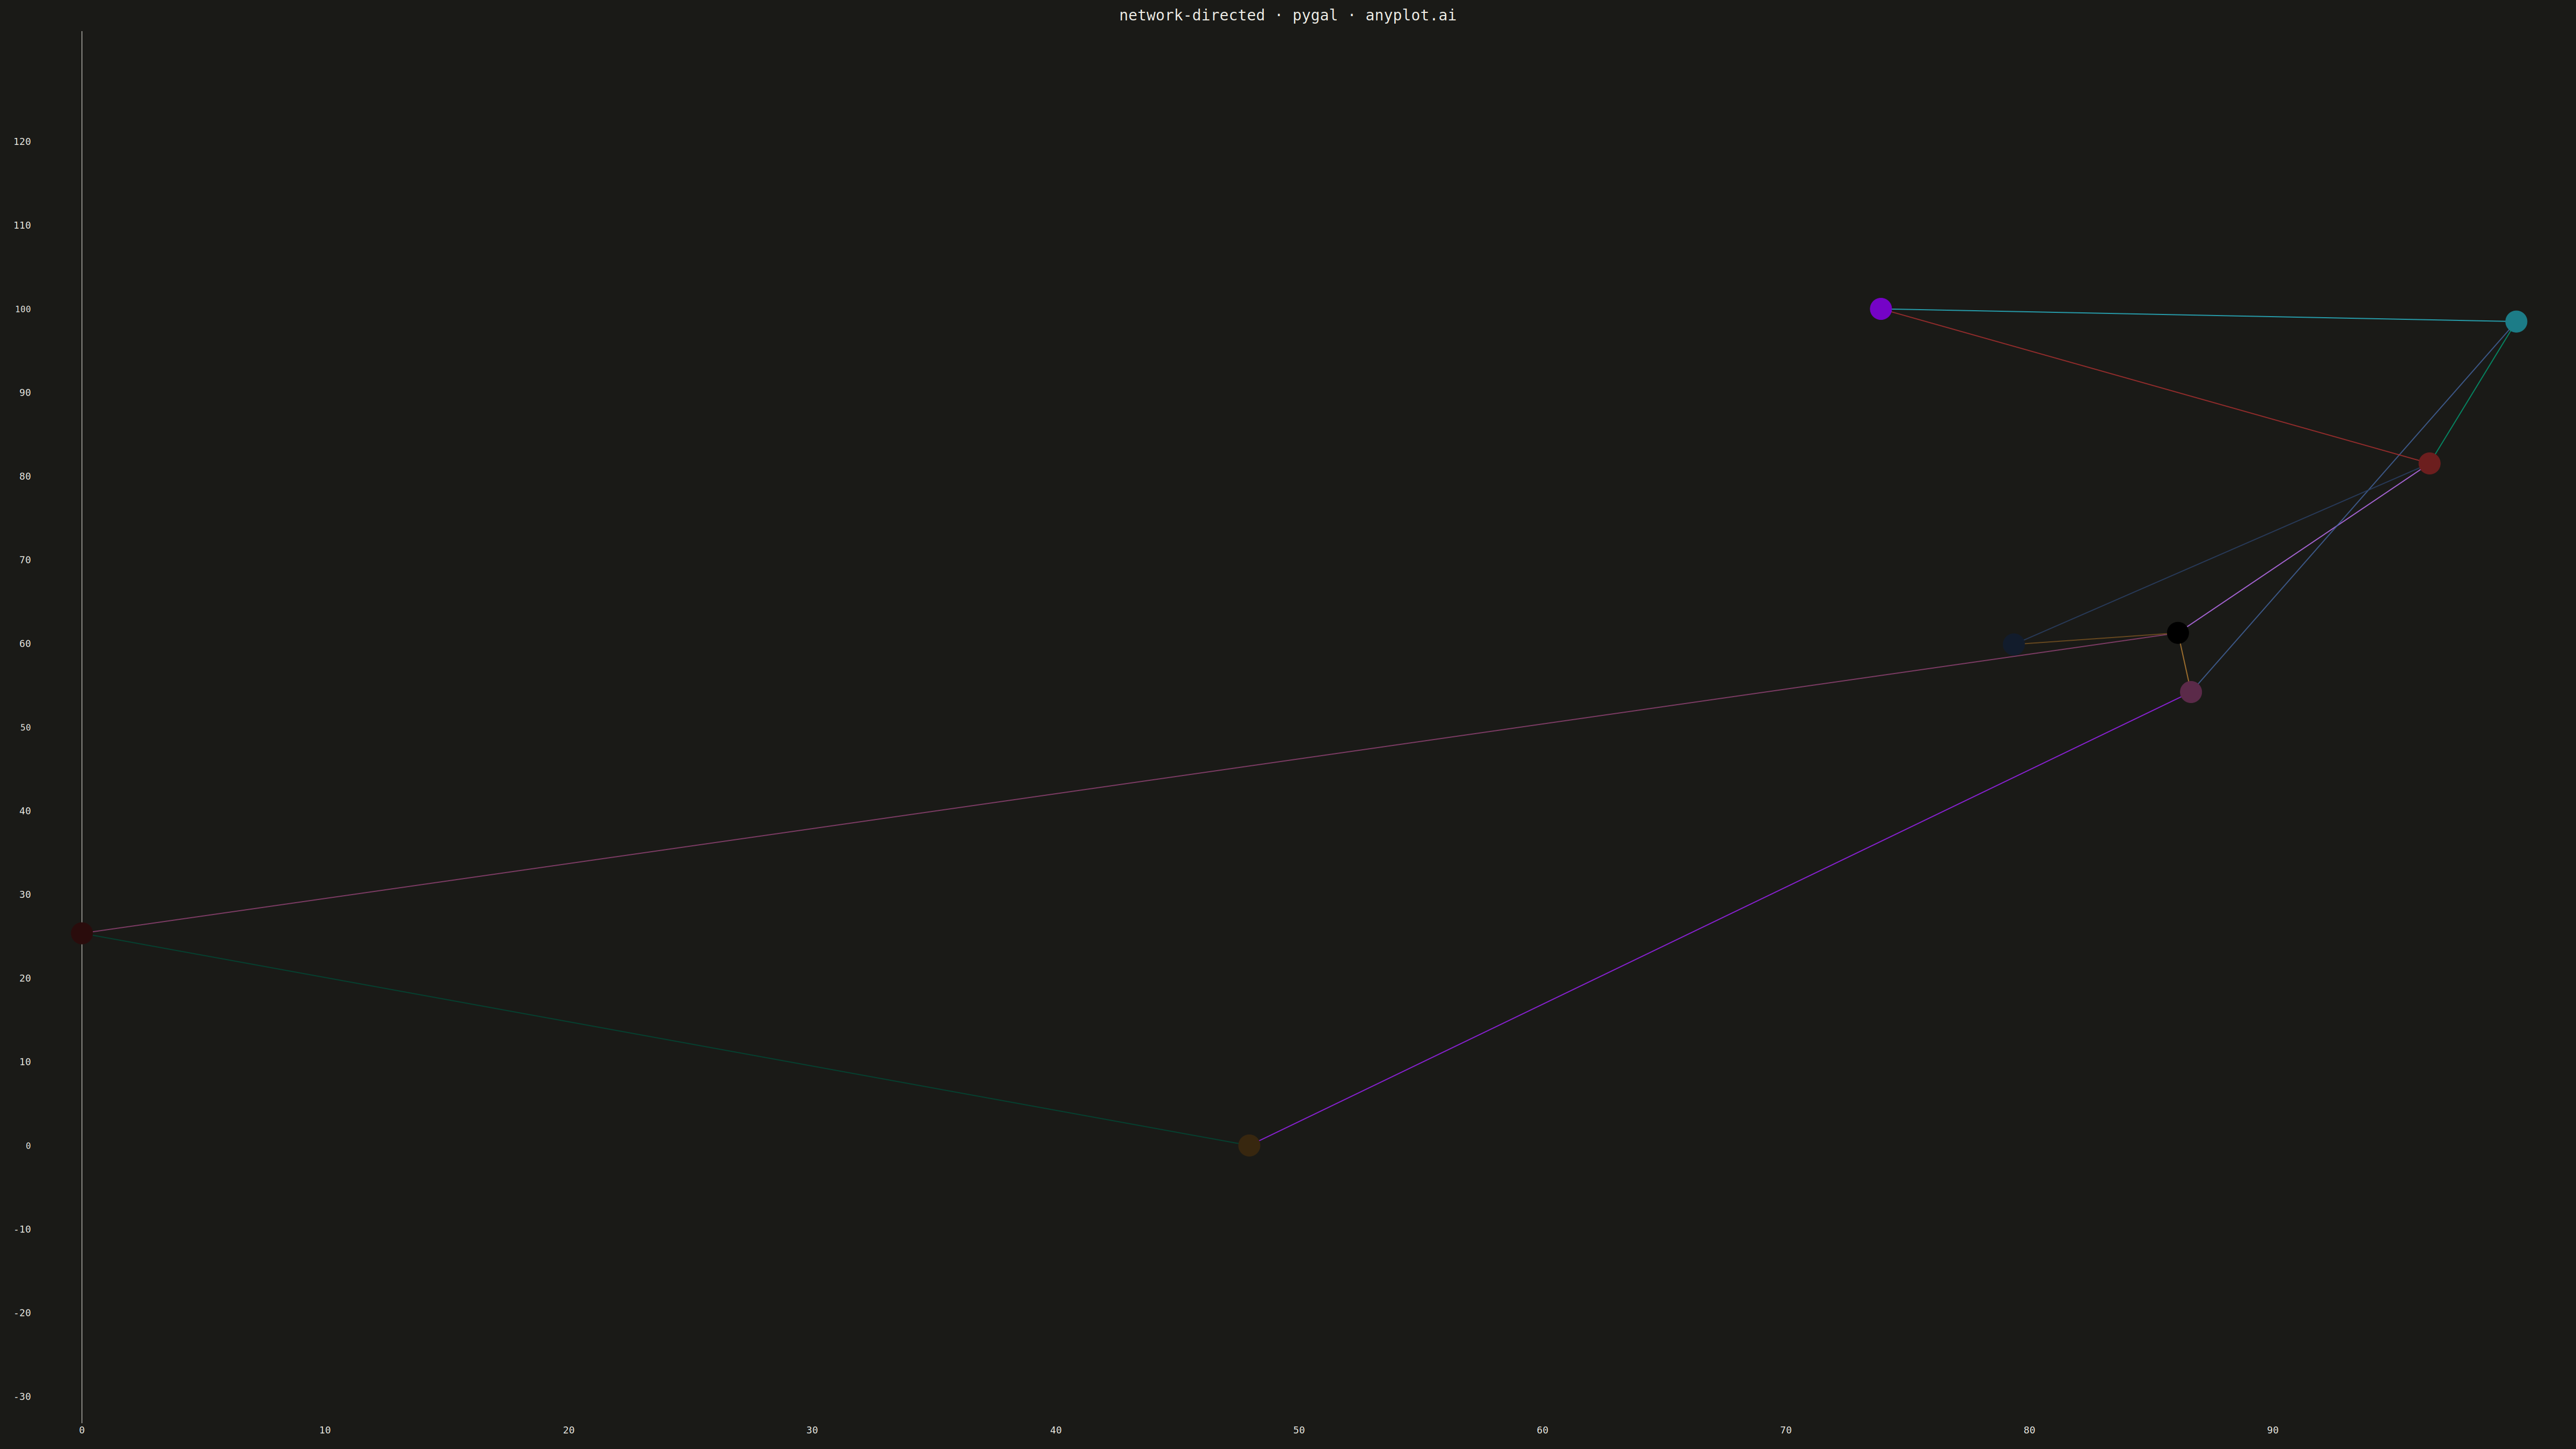
The same plot in 14 other libraries — Python: Altair, Bokeh, lets-plot, Matplotlib, Plotly, plotnine, Seaborn; R: ggplot2; Julia: Makie.jl; JavaScript: Chart.js, D3.js, Apache ECharts, Highcharts, MUI X Charts. Compare all 15 side by side: Directed Network Graph in Python, R, Julia and JavaScript.
A directed network graph visualizes relationships between entities using nodes connected by edges with arrows, indicating the direction of relationships or flow. Unlike undirected graphs, directed graphs reveal asymmetric relationships such as dependencies, hierarchies, or information flow. The arrows clearly communicate which entity points to which, making cause-and-effect relationships and directional dependencies immediately visible.
""" anyplot.ai
network-directed: Directed Network Graph
Library: pygal 3.1.0 | Python 3.13.13
Quality: 73/100 | Created: 2026-05-14
"""

import os

# Ensure we import the installed pygal, not this file
import site
import sys


sys.path.insert(0, site.getsitepackages()[0])

import numpy as np
import pygal
from pygal.style import Style


THEME = os.getenv("ANYPLOT_THEME", "light")
PAGE_BG = "#FAF8F1" if THEME == "light" else "#1A1A17"
INK = "#1A1A17" if THEME == "light" else "#F0EFE8"
INK_SOFT = "#4A4A44" if THEME == "light" else "#B8B7B0"
INK_MUTED = "#6B6A63" if THEME == "light" else "#A8A79F"

IMPRINT = ("#009E73", "#C475FD", "#4467A3", "#BD8233", "#AE3030", "#2ABCCD", "#954477")

# Data: Software module dependency network
edges = [
    ("api", "auth"),
    ("api", "database"),
    ("auth", "cache"),
    ("cache", "database"),
    ("frontend", "api"),
    ("frontend", "auth"),
    ("worker", "database"),
    ("worker", "queue"),
    ("queue", "cache"),
    ("monitoring", "api"),
    ("monitoring", "database"),
]

# Force-directed layout with numpy
np.random.seed(42)
nodes = sorted({src for src, _ in edges} | {dst for _, dst in edges})
node_idx = {node: i for i, node in enumerate(nodes)}
n_nodes = len(nodes)

# Initialize positions randomly
pos = np.random.randn(n_nodes, 2) * 50

# Simple force-directed layout algorithm
for _ in range(50):
    forces = np.zeros_like(pos)

    # Repulsive forces between all node pairs
    for i in range(n_nodes):
        for j in range(n_nodes):
            if i != j:
                delta = pos[i] - pos[j]
                dist = np.linalg.norm(delta) + 0.1
                forces[i] += delta / (dist**2) * 0.5

    # Attractive forces for edges
    for src, dst in edges:
        i, j = node_idx[src], node_idx[dst]
        delta = pos[j] - pos[i]
        dist = np.linalg.norm(delta) + 0.1
        forces[i] += delta * 0.1
        forces[j] -= delta * 0.1

    # Update positions
    pos += forces * 0.1

# Normalize and scale positions
pos = (pos - pos.min(axis=0)) / (pos.max(axis=0) - pos.min(axis=0) + 1e-8)
pos = pos * 100

pos_dict = {node: pos[node_idx[node]] for node in nodes}

custom_style = Style(
    background=PAGE_BG,
    plot_background=PAGE_BG,
    foreground=INK,
    foreground_strong=INK,
    foreground_subtle=INK_MUTED,
    colors=IMPRINT,
    title_font_size=28,
    label_font_size=18,
    major_label_font_size=16,
    legend_font_size=16,
    value_font_size=14,
    stroke_width=2,
)

# Create XY chart for nodes and edges
chart = pygal.XY(
    width=4800,
    height=2700,
    title="network-directed · pygal · anyplot.ai",
    x_title="",
    y_title="",
    show_legend=False,
    show_x_guides=False,
    show_y_guides=False,
    style=custom_style,
    explicit_size=True,
)

chart.title_style = {"font_size": 28, "font_family": "sans-serif", "fill": INK}

# Plot edges as thin lines
for source, target in edges:
    x1, y1 = pos_dict[source]
    x2, y2 = pos_dict[target]

    edge_series = [(x1, y1), (x2, y2)]
    chart.add(None, edge_series, stroke_style={"width": 2, "color": INK_MUTED, "opacity": 0.4})

# Plot nodes as points
for node in nodes:
    x, y = pos_dict[node]
    chart.add(node, [(x, y)], points_values_show=False, dots_size=20, stroke=False)

# Manually set x and y limits to ensure proper scaling
x_coords = [pos_dict[node][0] for node in nodes]
y_coords = [pos_dict[node][1] for node in nodes]
margin = 30
chart.range = (min(x_coords) - margin, max(x_coords) + margin)

chart.render_to_png(f"plot-{THEME}.png")
with open(f"plot-{THEME}.html", "wb") as f:
    f.write(chart.render())
Runnable source as JSON, for any HTTP client: https://api.anyplot.ai/specs/network-directed/pygal/code. Any spec id and library id listed in llms-full.txt fit the same URL shape; every URL below is complete and callable.
{
  "spec_id": "network-directed",
  "language": "python",
  "library": "pygal",
  "page": "https://anyplot.ai/network-directed/python/pygal",
  "hub": "https://anyplot.ai/network-directed",
  "code_json": "https://api.anyplot.ai/specs/network-directed/pygal/code",
  "spec_json": "https://api.anyplot.ai/specs/network-directed",
  "render_light_png": "https://storage.googleapis.com/anyplot-images/plots/network-directed/python/pygal/plot-light.png",
  "render_dark_png": "https://storage.googleapis.com/anyplot-images/plots/network-directed/python/pygal/plot-dark.png",
  "interactive_light_html": "https://storage.googleapis.com/anyplot-images/plots/network-directed/python/pygal/plot-light.html",
  "interactive_dark_html": "https://storage.googleapis.com/anyplot-images/plots/network-directed/python/pygal/plot-dark.html",
  "quality_score": 73.0,
  "license": "MIT",
  "guide": "https://anyplot.ai/llms.txt"
}
Part of Directed Network Graph on anyplot.ai.