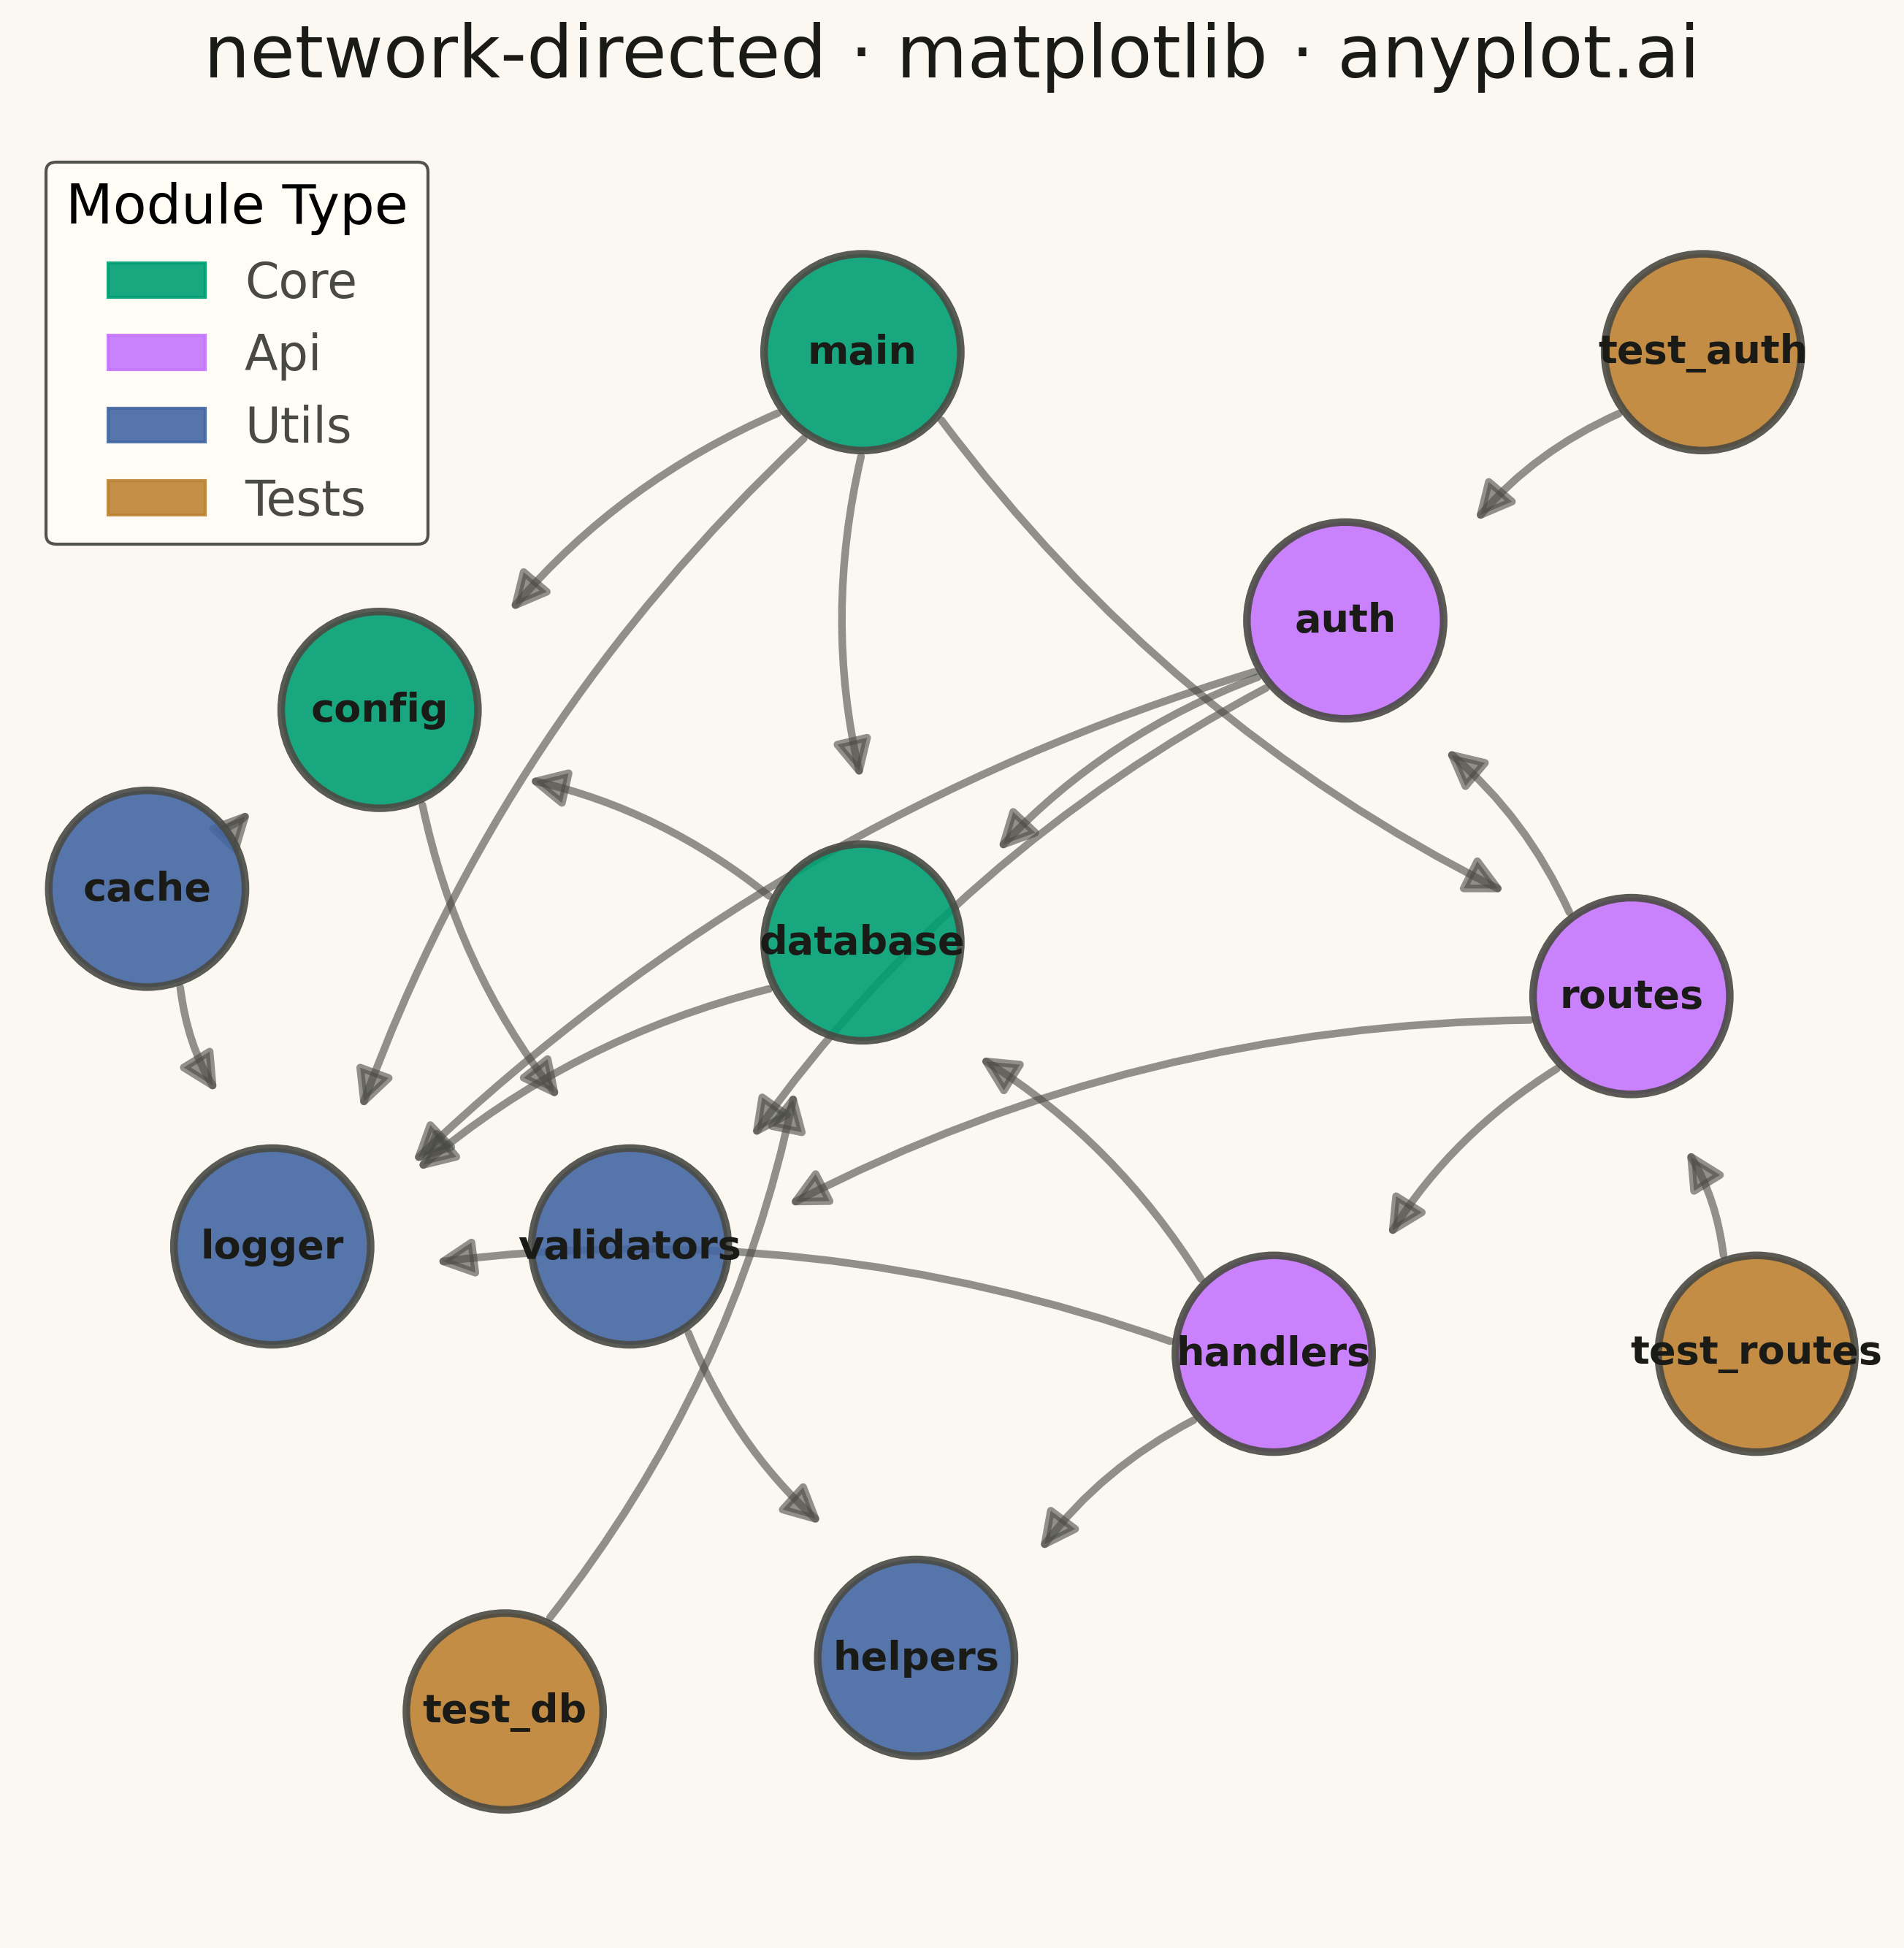
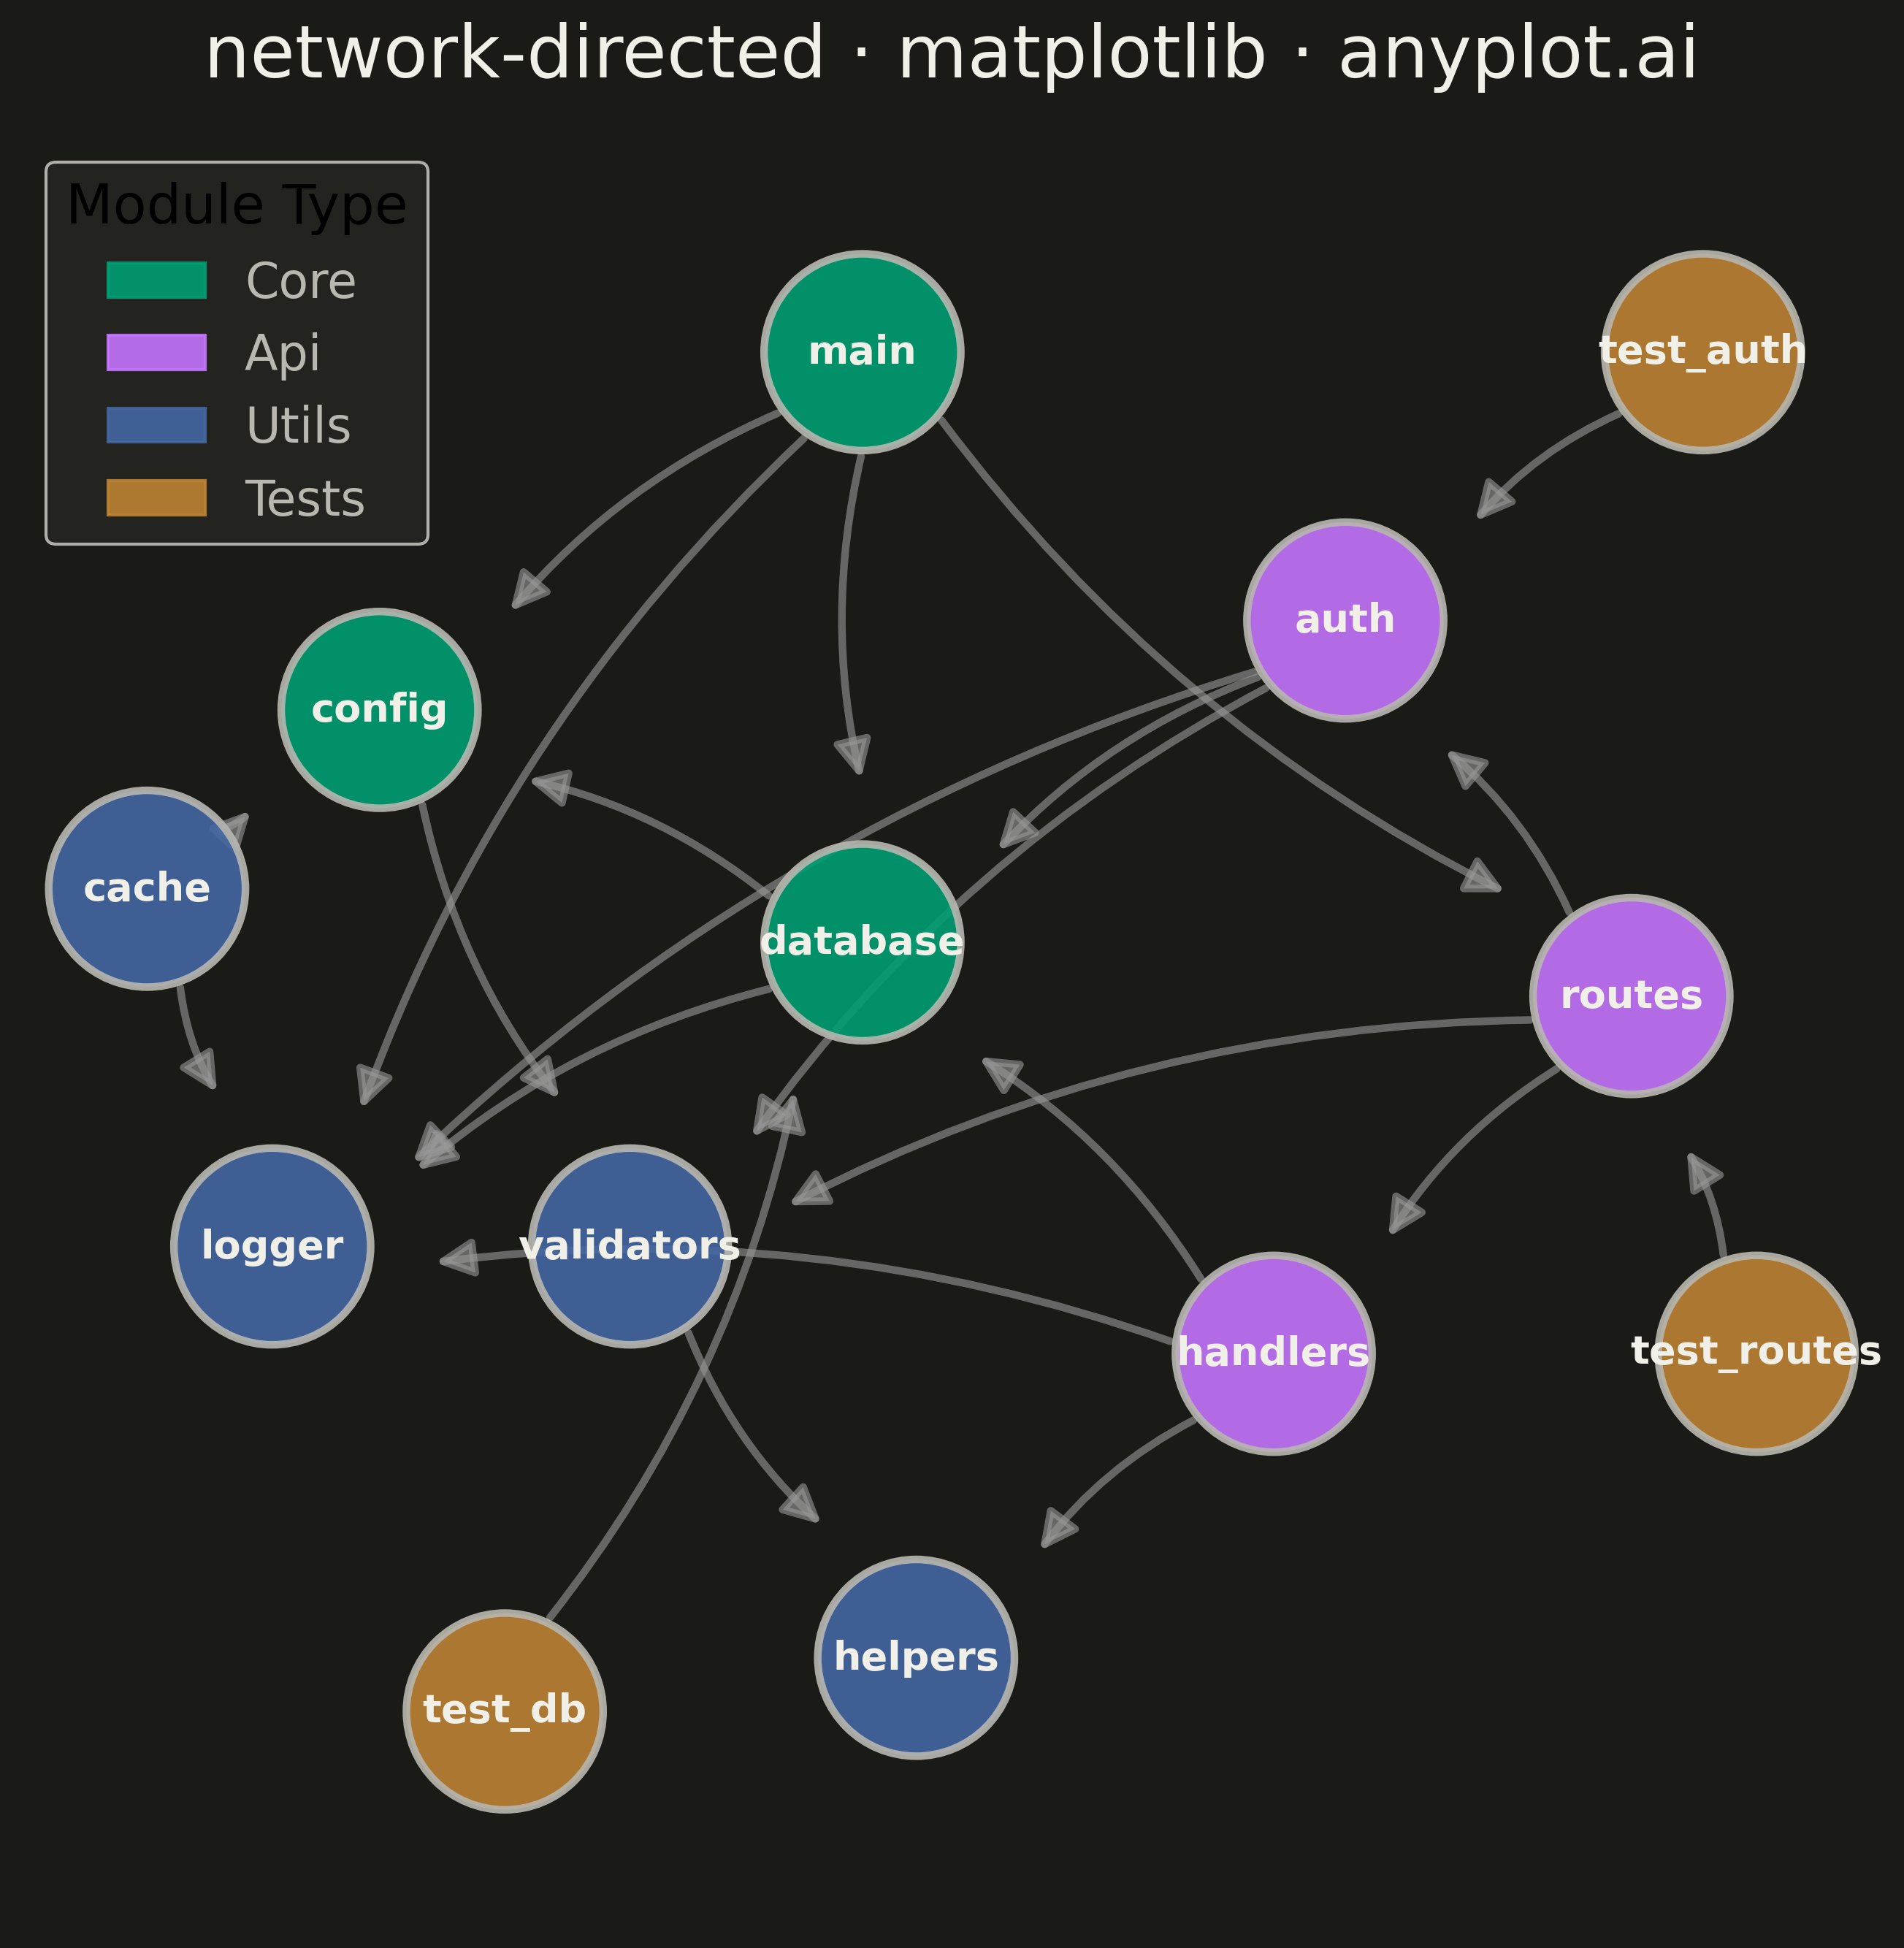
A directed network graph visualizes relationships between entities using nodes connected by edges with arrows, indicating the direction of relationships or flow. Unlike undirected graphs, directed graphs reveal asymmetric relationships such as dependencies, hierarchies, or information flow. The arrows clearly communicate which entity points to which, making cause-and-effect relationships and directional dependencies immediately visible.
""" anyplot.ai
network-directed: Directed Network Graph
Library: matplotlib 3.10.9 | Python 3.13.13
Quality: 91/100 | Updated: 2026-05-14
"""

import os

import matplotlib.patches as mpatches
import matplotlib.pyplot as plt
import numpy as np
from matplotlib.patches import Circle, FancyArrowPatch


THEME = os.getenv("ANYPLOT_THEME", "light")
PAGE_BG = "#FAF8F1" if THEME == "light" else "#1A1A17"
ELEVATED_BG = "#FFFDF6" if THEME == "light" else "#242420"
INK = "#1A1A17" if THEME == "light" else "#F0EFE8"
INK_SOFT = "#4A4A44" if THEME == "light" else "#B8B7B0"

# Okabe-Ito palette for group colors (first 4 positions)
IMPRINT = ["#009E73", "#C475FD", "#4467A3", "#BD8233"]

# Data: Software package dependencies (arrows show import direction)
np.random.seed(42)

# Define modules with groups (core, utils, api, tests)
nodes = {
    "main": {"group": "core", "pos": (0.45, 0.88)},
    "config": {"group": "core", "pos": (0.18, 0.68)},
    "database": {"group": "core", "pos": (0.45, 0.55)},
    "auth": {"group": "api", "pos": (0.72, 0.73)},
    "routes": {"group": "api", "pos": (0.88, 0.52)},
    "handlers": {"group": "api", "pos": (0.68, 0.32)},
    "validators": {"group": "utils", "pos": (0.32, 0.38)},
    "helpers": {"group": "utils", "pos": (0.48, 0.15)},
    "logger": {"group": "utils", "pos": (0.12, 0.38)},
    "cache": {"group": "utils", "pos": (0.05, 0.58)},
    "test_auth": {"group": "tests", "pos": (0.92, 0.88)},
    "test_routes": {"group": "tests", "pos": (0.95, 0.32)},
    "test_db": {"group": "tests", "pos": (0.25, 0.12)},
}

# Define dependencies (arrow from source to target means source imports target)
edges = [
    ("main", "config"),
    ("main", "database"),
    ("main", "routes"),
    ("main", "logger"),
    ("config", "validators"),
    ("database", "logger"),
    ("database", "config"),
    ("auth", "database"),
    ("auth", "validators"),
    ("auth", "logger"),
    ("routes", "auth"),
    ("routes", "handlers"),
    ("routes", "validators"),
    ("handlers", "database"),
    ("handlers", "helpers"),
    ("handlers", "logger"),
    ("validators", "helpers"),
    ("cache", "logger"),
    ("cache", "config"),
    ("test_auth", "auth"),
    ("test_routes", "routes"),
    ("test_db", "database"),
]

# Group colors (Okabe-Ito)
group_colors = {"core": IMPRINT[0], "api": IMPRINT[1], "utils": IMPRINT[2], "tests": IMPRINT[3]}

# Plot
fig, ax = plt.subplots(figsize=(16, 9), facecolor=PAGE_BG)
ax.set_facecolor(PAGE_BG)

# Node radius for arrow endpoint calculations
node_radius = 0.055

# Draw edges with arrows
edge_color = INK_SOFT if THEME == "light" else "#999999"
for source, target in edges:
    pos1 = nodes[source]["pos"]
    pos2 = nodes[target]["pos"]

    # Calculate edge start/end points outside node circles
    dx = pos2[0] - pos1[0]
    dy = pos2[1] - pos1[1]
    dist = np.sqrt(dx**2 + dy**2)
    dx_norm, dy_norm = dx / dist, dy / dist
    start = (pos1[0] + dx_norm * node_radius, pos1[1] + dy_norm * node_radius)
    end = (pos2[0] - dx_norm * node_radius * 1.6, pos2[1] - dy_norm * node_radius * 1.6)

    # Create curved arrow
    arrow = FancyArrowPatch(
        start,
        end,
        arrowstyle="-|>",
        mutation_scale=25,
        color=edge_color,
        linewidth=2.5,
        alpha=0.6,
        connectionstyle="arc3,rad=0.12",
    )
    ax.add_patch(arrow)

# Draw nodes
for name, props in nodes.items():
    pos = props["pos"]
    color = group_colors[props["group"]]

    # Draw node circle
    circle = Circle(pos, radius=node_radius, facecolor=color, edgecolor=INK_SOFT, linewidth=2.5, alpha=0.9, zorder=10)
    ax.add_patch(circle)

    # Draw label
    ax.text(pos[0], pos[1], name, ha="center", va="center", fontsize=13, fontweight="bold", color=INK, zorder=11)

# Legend
legend_handles = [
    mpatches.Patch(color=color, label=group.capitalize(), alpha=0.9) for group, color in group_colors.items()
]
leg = ax.legend(
    handles=legend_handles, loc="upper left", fontsize=16, framealpha=0.95, title="Module Type", title_fontsize=18
)
leg.get_frame().set_facecolor(ELEVATED_BG)
leg.get_frame().set_edgecolor(INK_SOFT)
for text in leg.get_texts():
    text.set_color(INK_SOFT)

# Style
ax.set_title("network-directed · matplotlib · anyplot.ai", fontsize=24, fontweight="medium", color=INK, pad=20)
ax.set_xlim(-0.02, 1.02)
ax.set_ylim(0.0, 1.0)
ax.set_aspect("equal")
ax.axis("off")

plt.tight_layout()
plt.savefig(f"plot-{THEME}.png", dpi=300, bbox_inches="tight", facecolor=PAGE_BG)
Runnable source as JSON, for any HTTP client: https://api.anyplot.ai/specs/network-directed/matplotlib/code. Any spec id and library id listed in llms-full.txt fit the same URL shape; every URL below is complete and callable.
{
  "spec_id": "network-directed",
  "language": "python",
  "library": "matplotlib",
  "page": "https://anyplot.ai/network-directed/python/matplotlib",
  "hub": "https://anyplot.ai/network-directed",
  "code_json": "https://api.anyplot.ai/specs/network-directed/matplotlib/code",
  "spec_json": "https://api.anyplot.ai/specs/network-directed",
  "render_light_png": "https://storage.googleapis.com/anyplot-images/plots/network-directed/python/matplotlib/plot-light.png",
  "render_dark_png": "https://storage.googleapis.com/anyplot-images/plots/network-directed/python/matplotlib/plot-dark.png",
  "quality_score": 91.0,
  "license": "MIT",
  "guide": "https://anyplot.ai/llms.txt"
}
Part of Directed Network Graph on anyplot.ai.