The same plot in 14 other libraries — JavaScript: Chart.js, D3.js, Highcharts, MUI X Charts; Python: Altair, Bokeh, lets-plot, Matplotlib, Plotly, plotnine, Pygal, Seaborn; R: ggplot2; Julia: Makie.jl. Compare all 15 side by side: Directed Network Graph in Python, R, Julia and JavaScript.
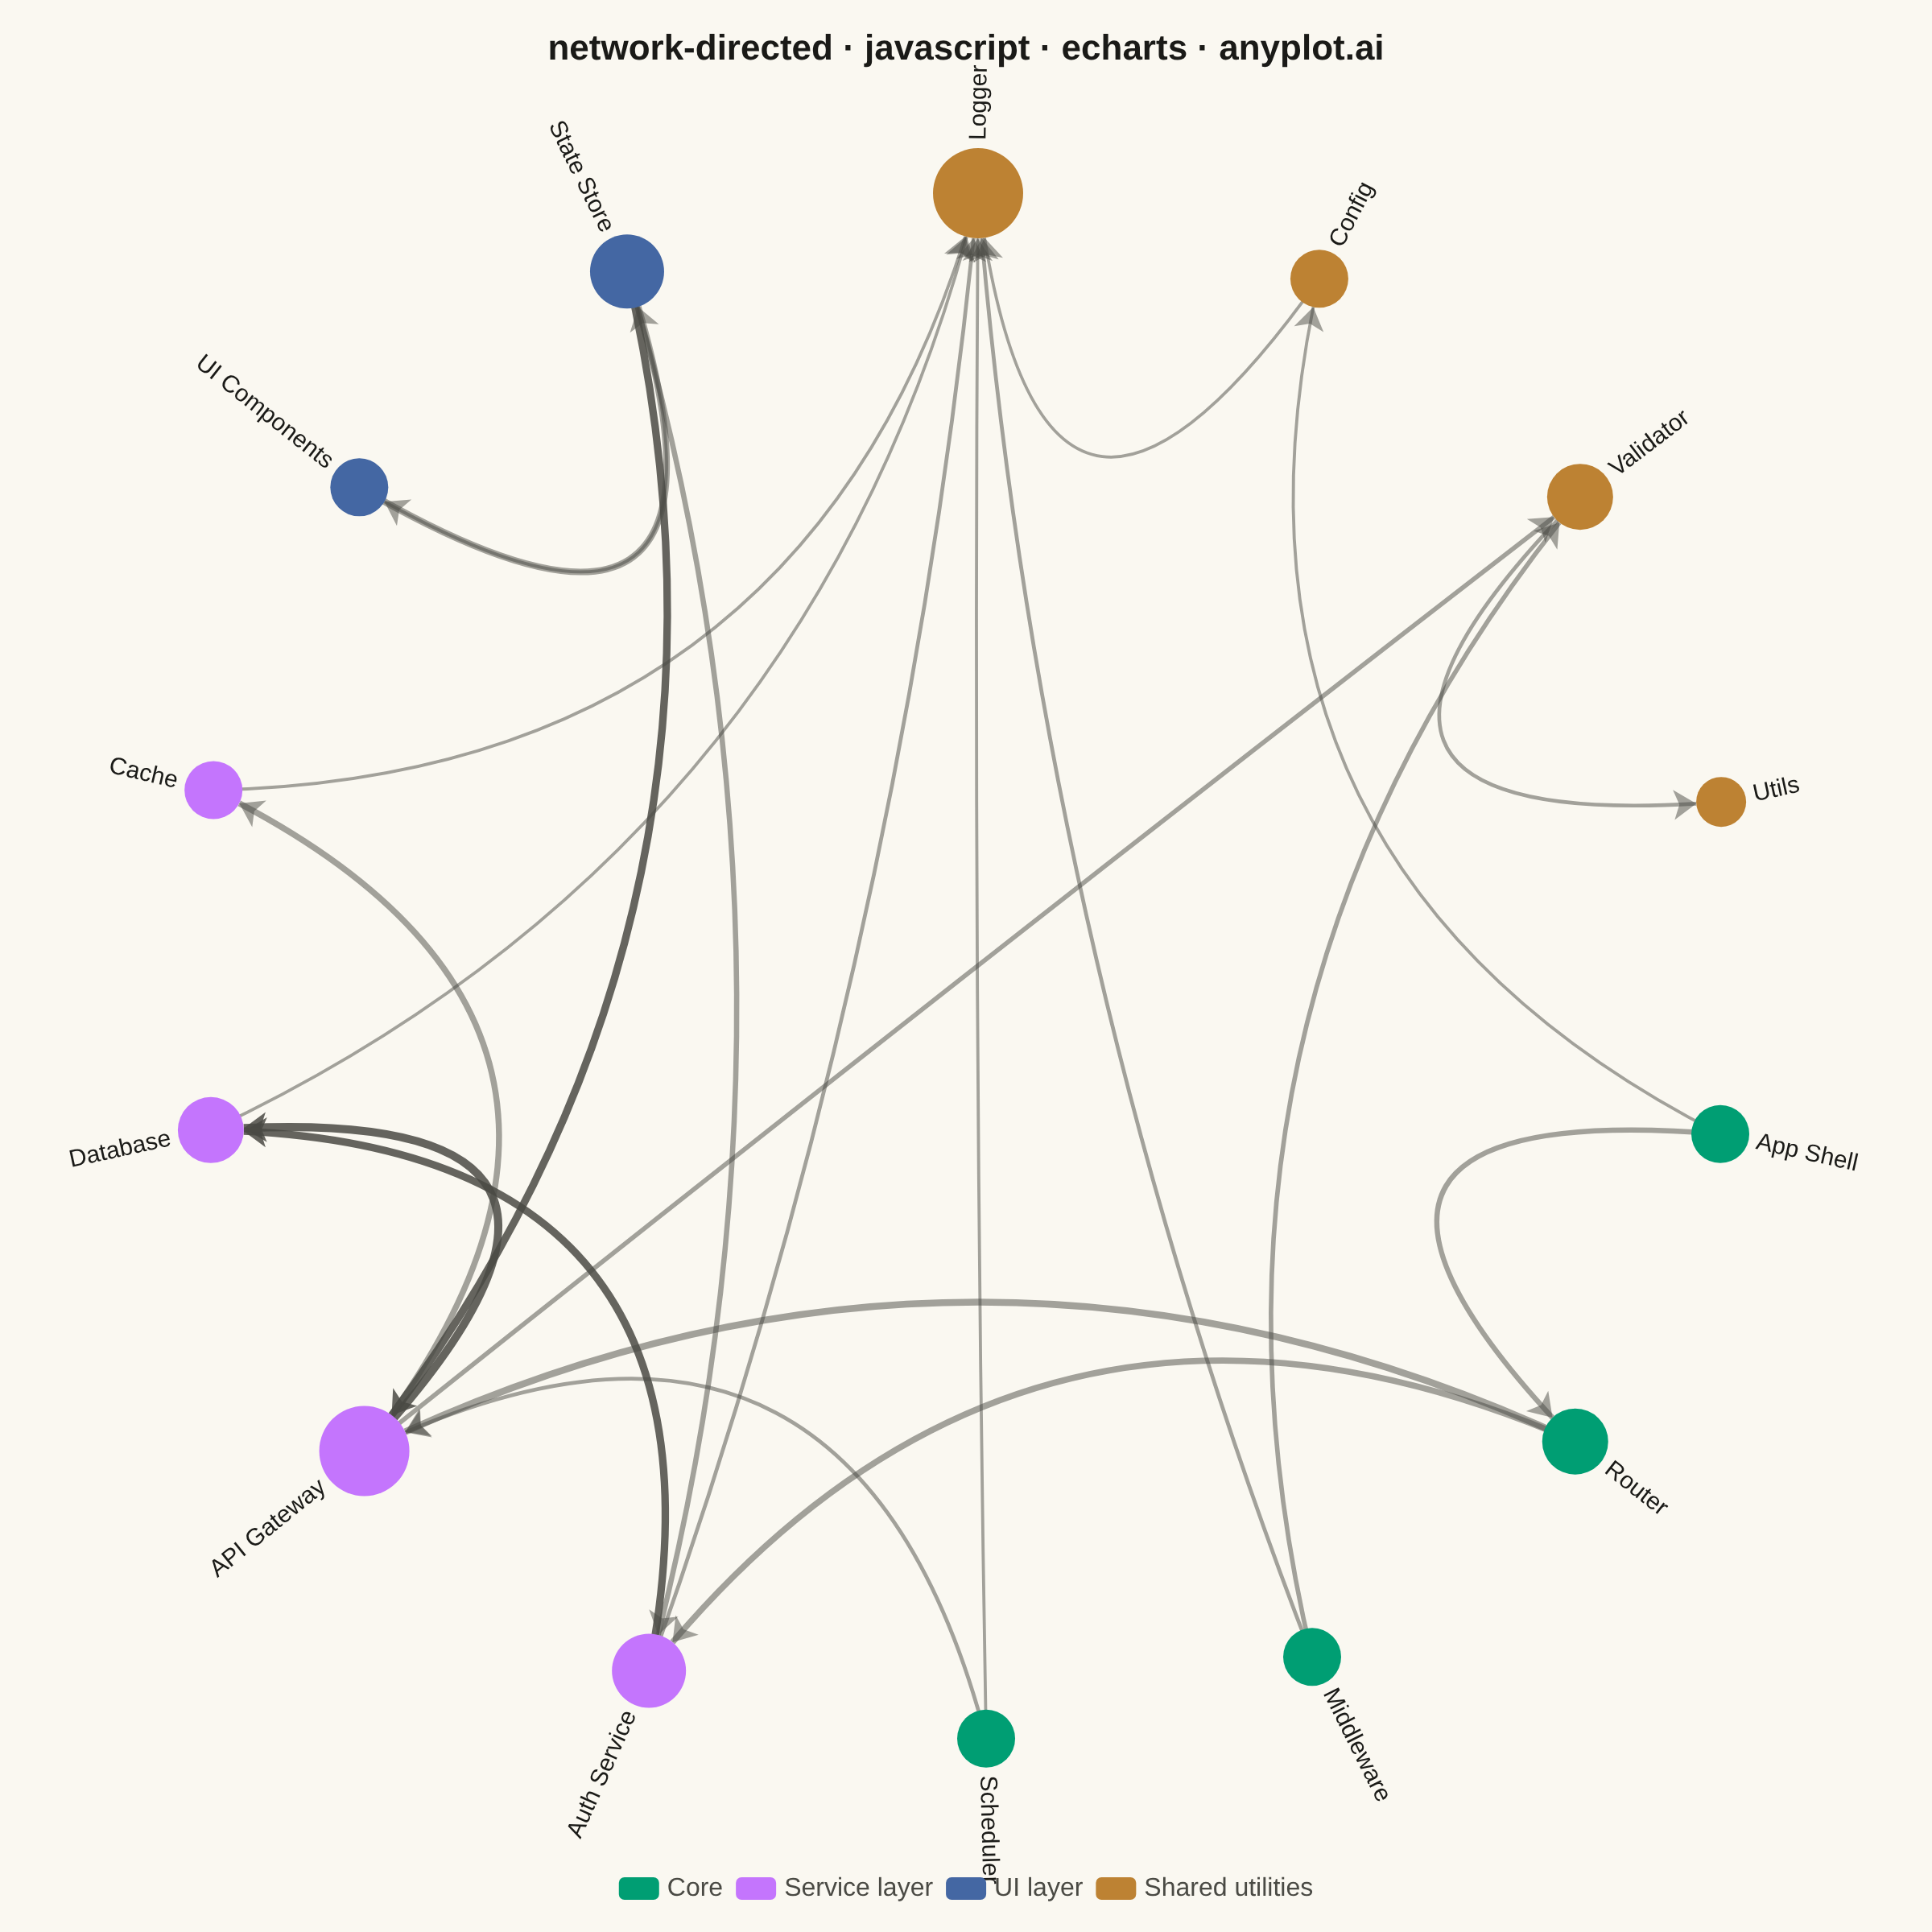
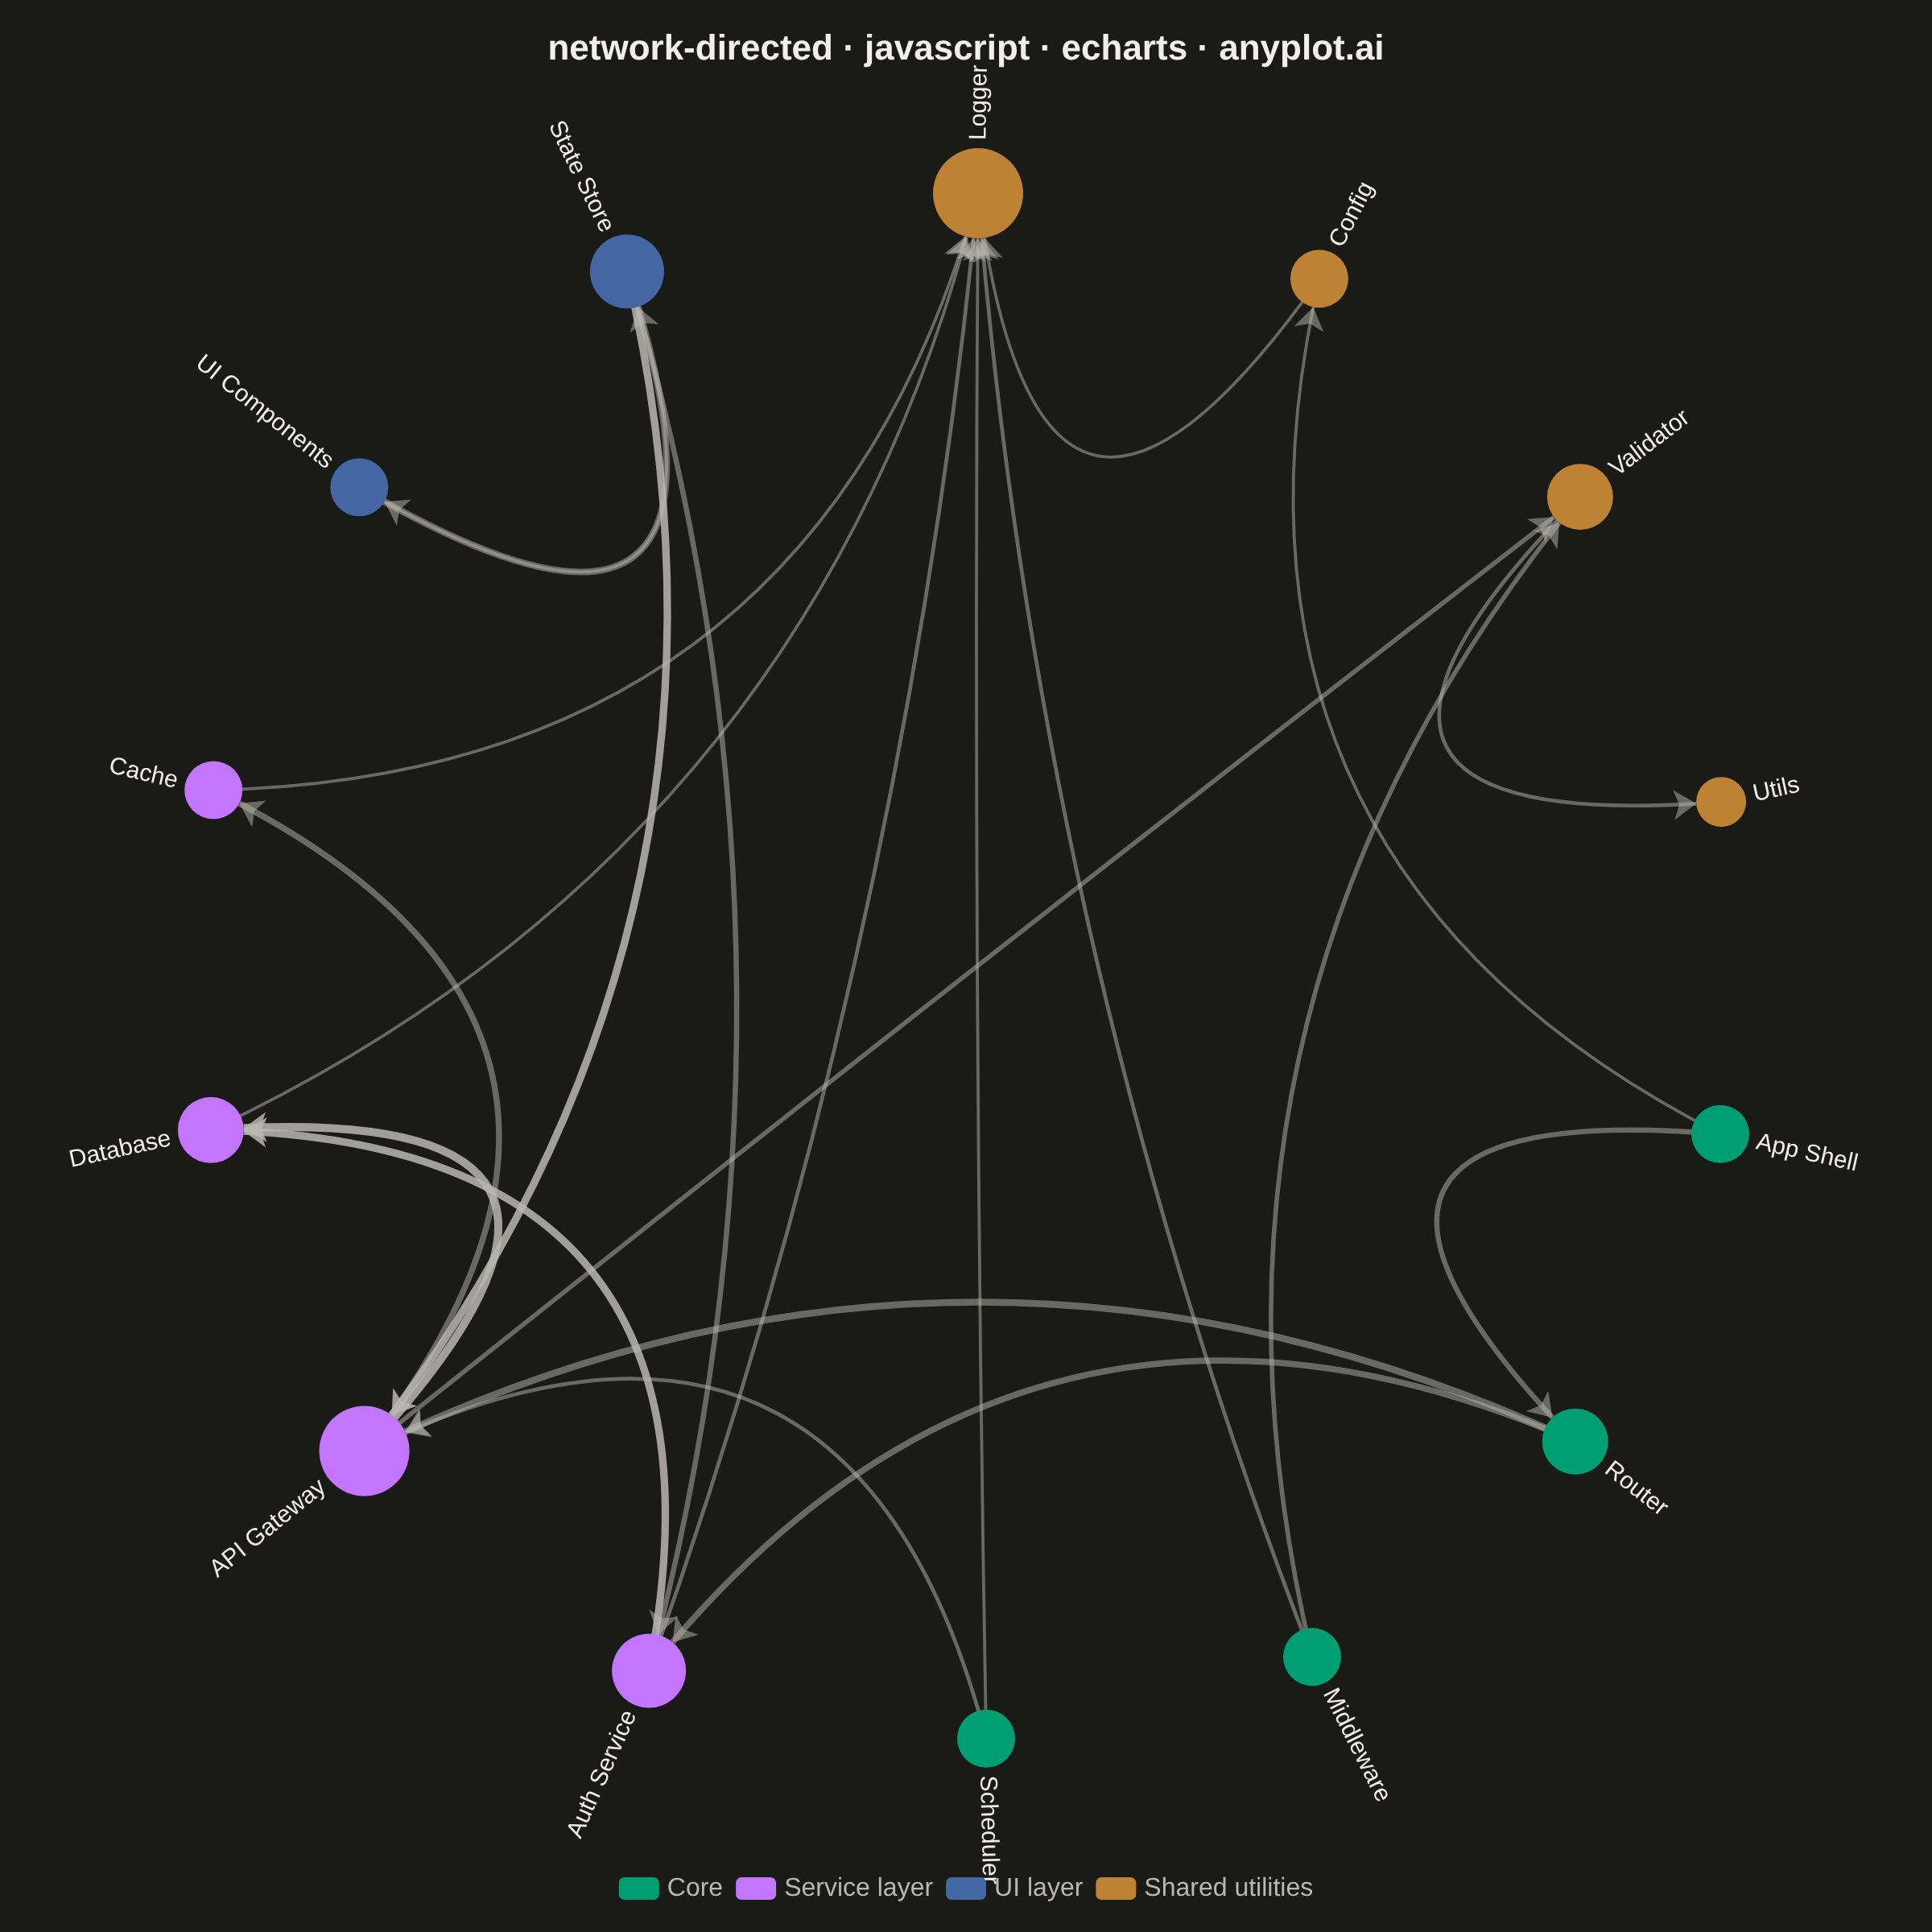
A directed network graph visualizes relationships between entities using nodes connected by edges with arrows, indicating the direction of relationships or flow. Unlike undirected graphs, directed graphs reveal asymmetric relationships such as dependencies, hierarchies, or information flow. The arrows clearly communicate which entity points to which, making cause-and-effect relationships and directional dependencies immediately visible.
// anyplot.ai
// network-directed: Directed Network Graph
// Library: echarts 6.1.0 | JavaScript 22.23.2
// Quality: 85/100 | Created: 2026-09-05

//# anyplot-orientation: square
const t = window.ANYPLOT_TOKENS;

// --- Data: internal module dependency graph (arrow = "imports") ------------
const CATEGORIES = ["Core", "Service layer", "UI layer", "Shared utilities"];

const moduleDefs = [
  ["App Shell", 0],
  ["Router", 0],
  ["Middleware", 0],
  ["Scheduler", 0],
  ["Auth Service", 1],
  ["API Gateway", 1],
  ["Database", 1],
  ["Cache", 1],
  ["UI Components", 2],
  ["State Store", 2],
  ["Logger", 3],
  ["Config", 3],
  ["Validator", 3],
  ["Utils", 3],
];

// [source, target, weight] — weight = number of imported symbols.
// The State Store -> UI Components edge closes a circular dependency with
// UI Components -> State Store below, the kind of accidental cycle this
// graph type is meant to surface.
const dependencies = [
  ["App Shell", "Router", 5],
  ["App Shell", "Config", 2],
  ["Router", "Auth Service", 6],
  ["Router", "API Gateway", 7],
  ["Middleware", "Logger", 3],
  ["Middleware", "Validator", 4],
  ["Scheduler", "API Gateway", 3],
  ["Scheduler", "Logger", 2],
  ["Auth Service", "Database", 8],
  ["Auth Service", "Logger", 3],
  ["API Gateway", "Database", 9],
  ["API Gateway", "Cache", 6],
  ["API Gateway", "Validator", 4],
  ["Database", "Logger", 2],
  ["Cache", "Logger", 2],
  ["UI Components", "State Store", 7],
  ["State Store", "API Gateway", 8],
  ["State Store", "Auth Service", 5],
  ["Validator", "Utils", 3],
  ["Config", "Logger", 2],
  ["State Store", "UI Components", 2],
];

const degree = {};
moduleDefs.forEach(([name]) => (degree[name] = 0));
dependencies.forEach(([source, target]) => {
  degree[source] += 1;
  degree[target] += 1;
});

const nodes = moduleDefs.map(([name, category]) => ({
  name,
  category,
  symbolSize: 26 + degree[name] * 5,
  label: { color: t.ink },
}));

// Heaviest-weight edges (the most-imported-from modules) get a stronger
// stroke so the busiest dependencies stand out from the general crisscross.
const edges = dependencies.map(([source, target, weight]) => ({
  source,
  target,
  lineStyle: { width: 1 + weight / 2.2, opacity: weight >= 8 ? 0.85 : 0.5 },
}));

// --- Init --------------------------------------------------------------------
const chart = echarts.init(document.getElementById("container"));

// --- Option -------------------------------------------------------------------
chart.setOption({
  animation: false,
  color: t.palette,
  backgroundColor: "transparent",
  title: {
    text: "network-directed · javascript · echarts · anyplot.ai",
    left: "center",
    textStyle: { color: t.ink, fontSize: 22 },
  },
  legend: {
    data: CATEGORIES,
    bottom: 14,
    left: "center",
    textStyle: { color: t.inkSoft, fontSize: 16 },
  },
  series: [
    {
      type: "graph",
      layout: "circular",
      circular: { rotateLabel: true },
      center: ["50%", "50%"],
      radius: 185,
      categories: CATEGORIES.map((name) => ({ name })),
      data: nodes,
      edges,
      roam: false,
      edgeSymbol: ["none", "arrow"],
      edgeSymbolSize: [0, 14],
      label: { show: true, position: "right", fontSize: 15 },
      lineStyle: { color: t.inkSoft, curveness: 0.2 },
      emphasis: { disabled: true },
    },
  ],
});
Runnable source as JSON, for any HTTP client: https://api.anyplot.ai/specs/network-directed/echarts/code. Any spec id and library id listed in llms-full.txt fit the same URL shape; every URL below is complete and callable.
{
  "spec_id": "network-directed",
  "language": "javascript",
  "library": "echarts",
  "page": "https://anyplot.ai/network-directed/javascript/echarts",
  "hub": "https://anyplot.ai/network-directed",
  "code_json": "https://api.anyplot.ai/specs/network-directed/echarts/code",
  "spec_json": "https://api.anyplot.ai/specs/network-directed",
  "render_light_png": "https://storage.googleapis.com/anyplot-images/plots/network-directed/javascript/echarts/plot-light.png",
  "render_dark_png": "https://storage.googleapis.com/anyplot-images/plots/network-directed/javascript/echarts/plot-dark.png",
  "interactive_light_html": "https://storage.googleapis.com/anyplot-images/plots/network-directed/javascript/echarts/plot-light.html",
  "interactive_dark_html": "https://storage.googleapis.com/anyplot-images/plots/network-directed/javascript/echarts/plot-dark.html",
  "quality_score": 85.0,
  "license": "MIT",
  "guide": "https://anyplot.ai/llms.txt"
}
Part of Directed Network Graph on anyplot.ai.