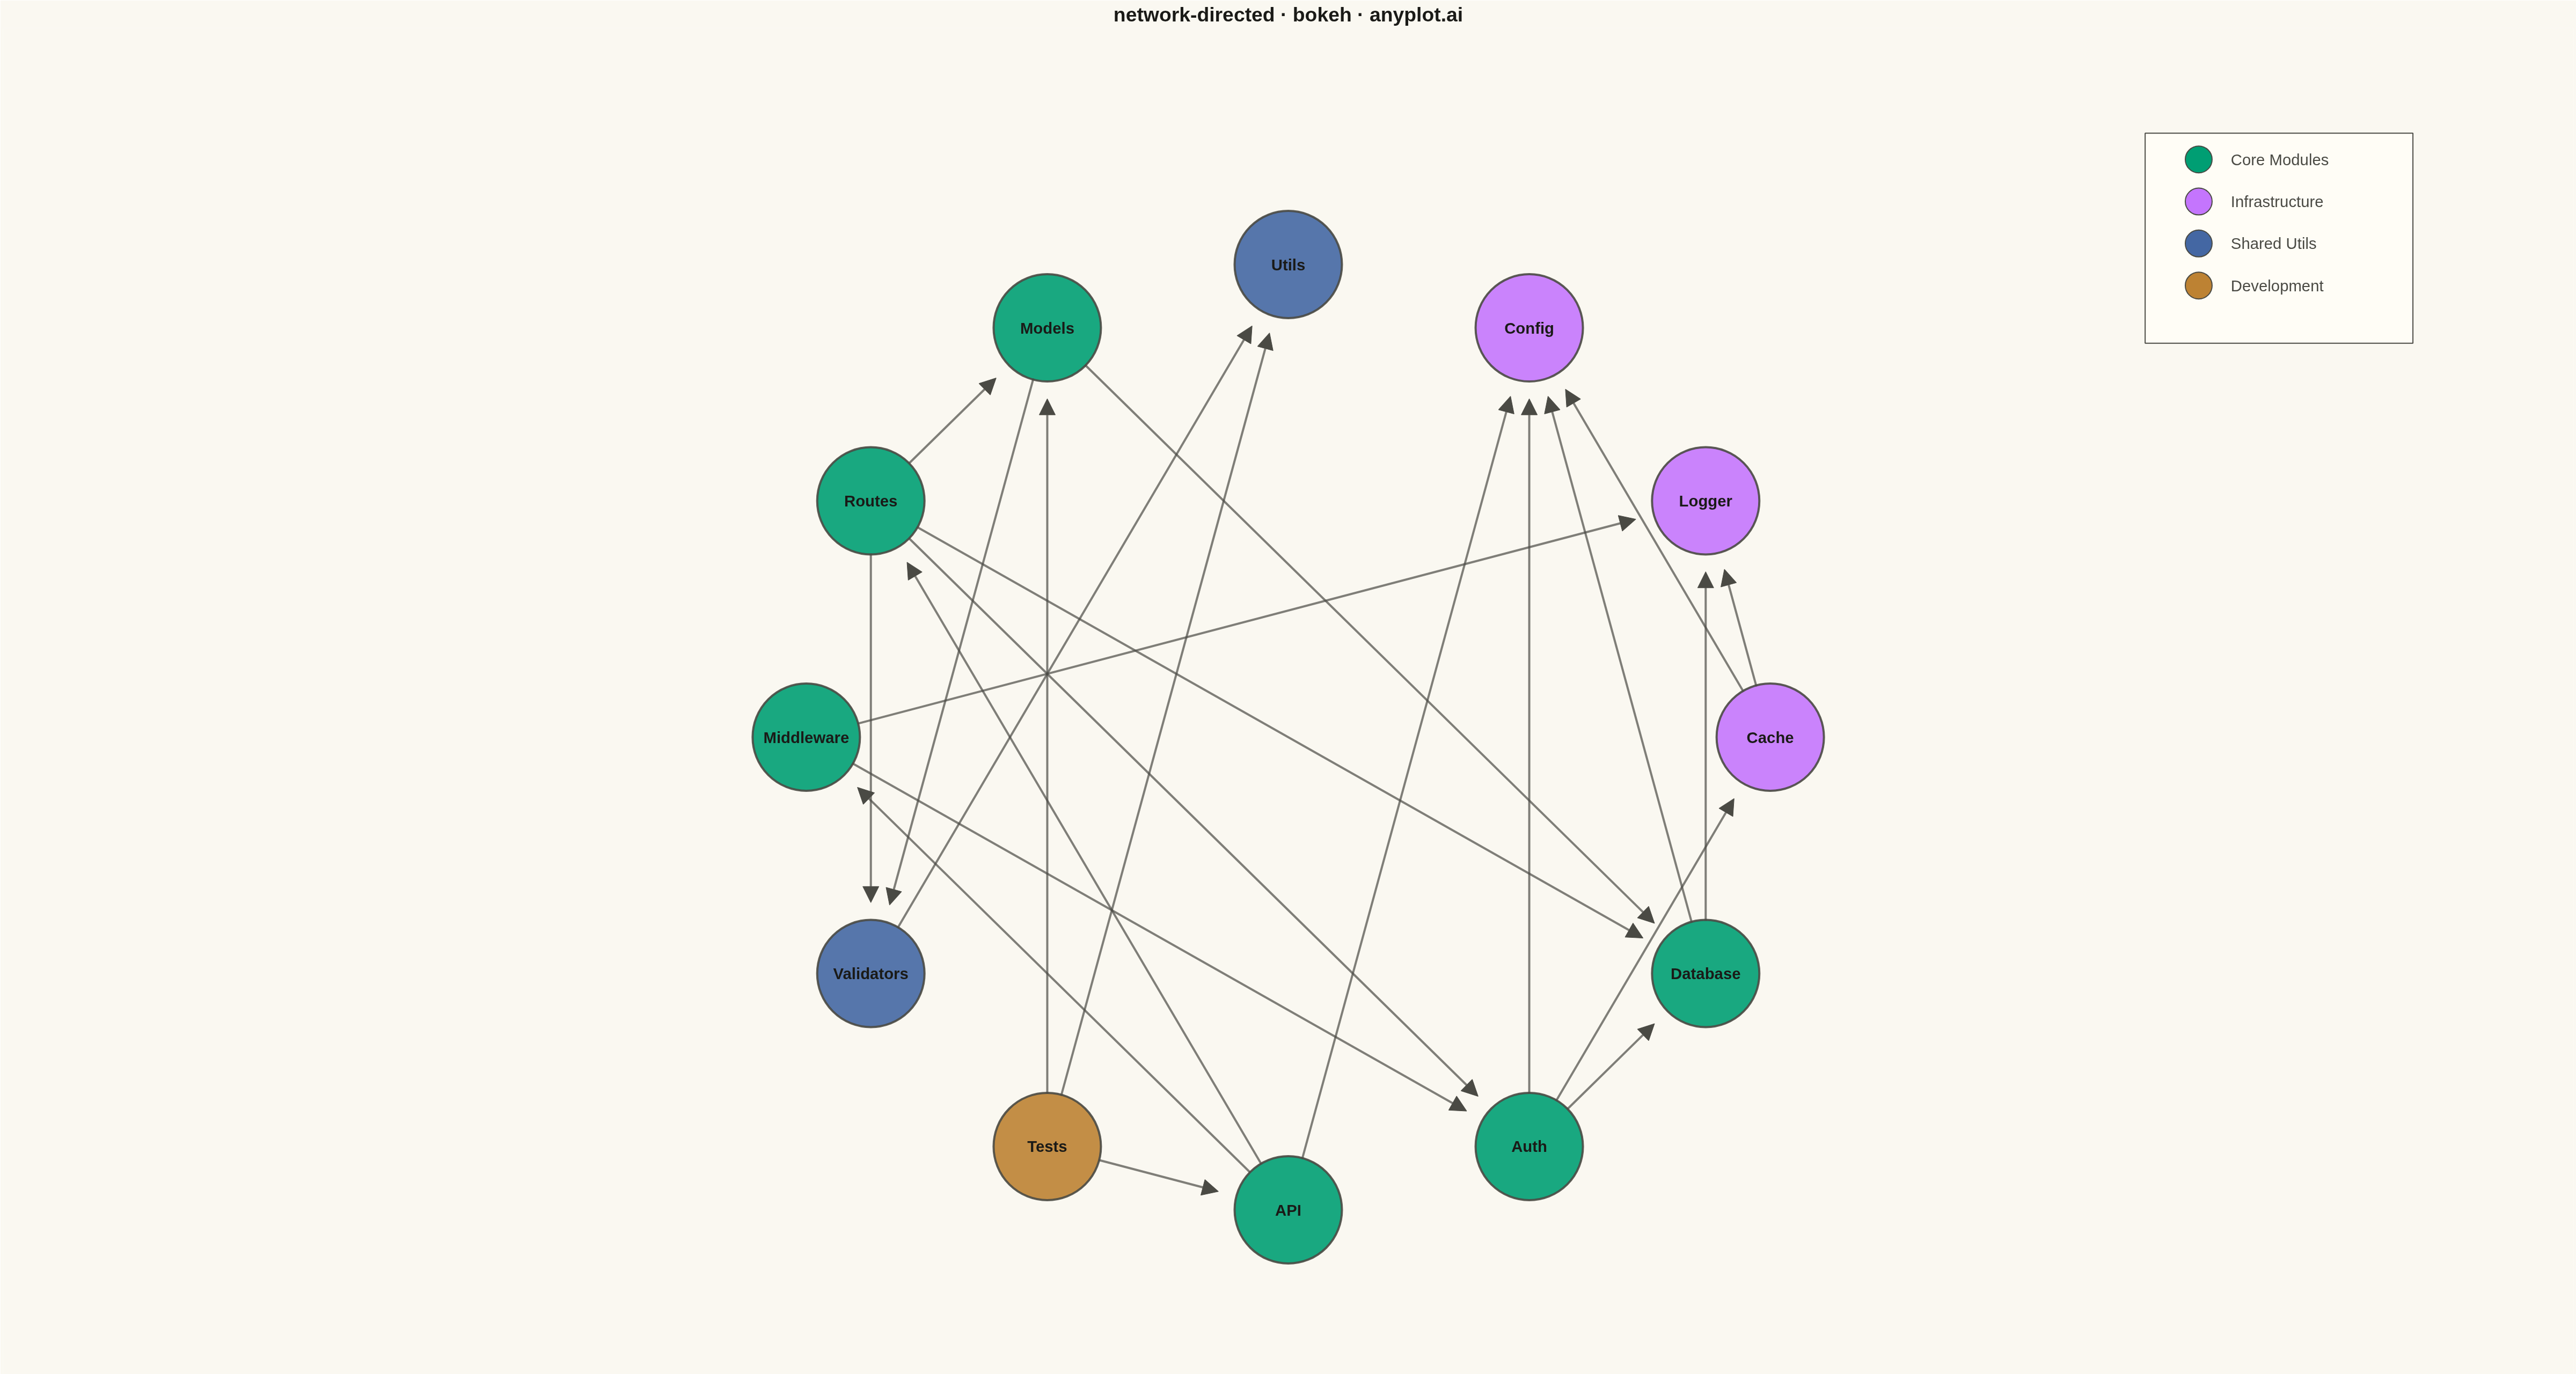
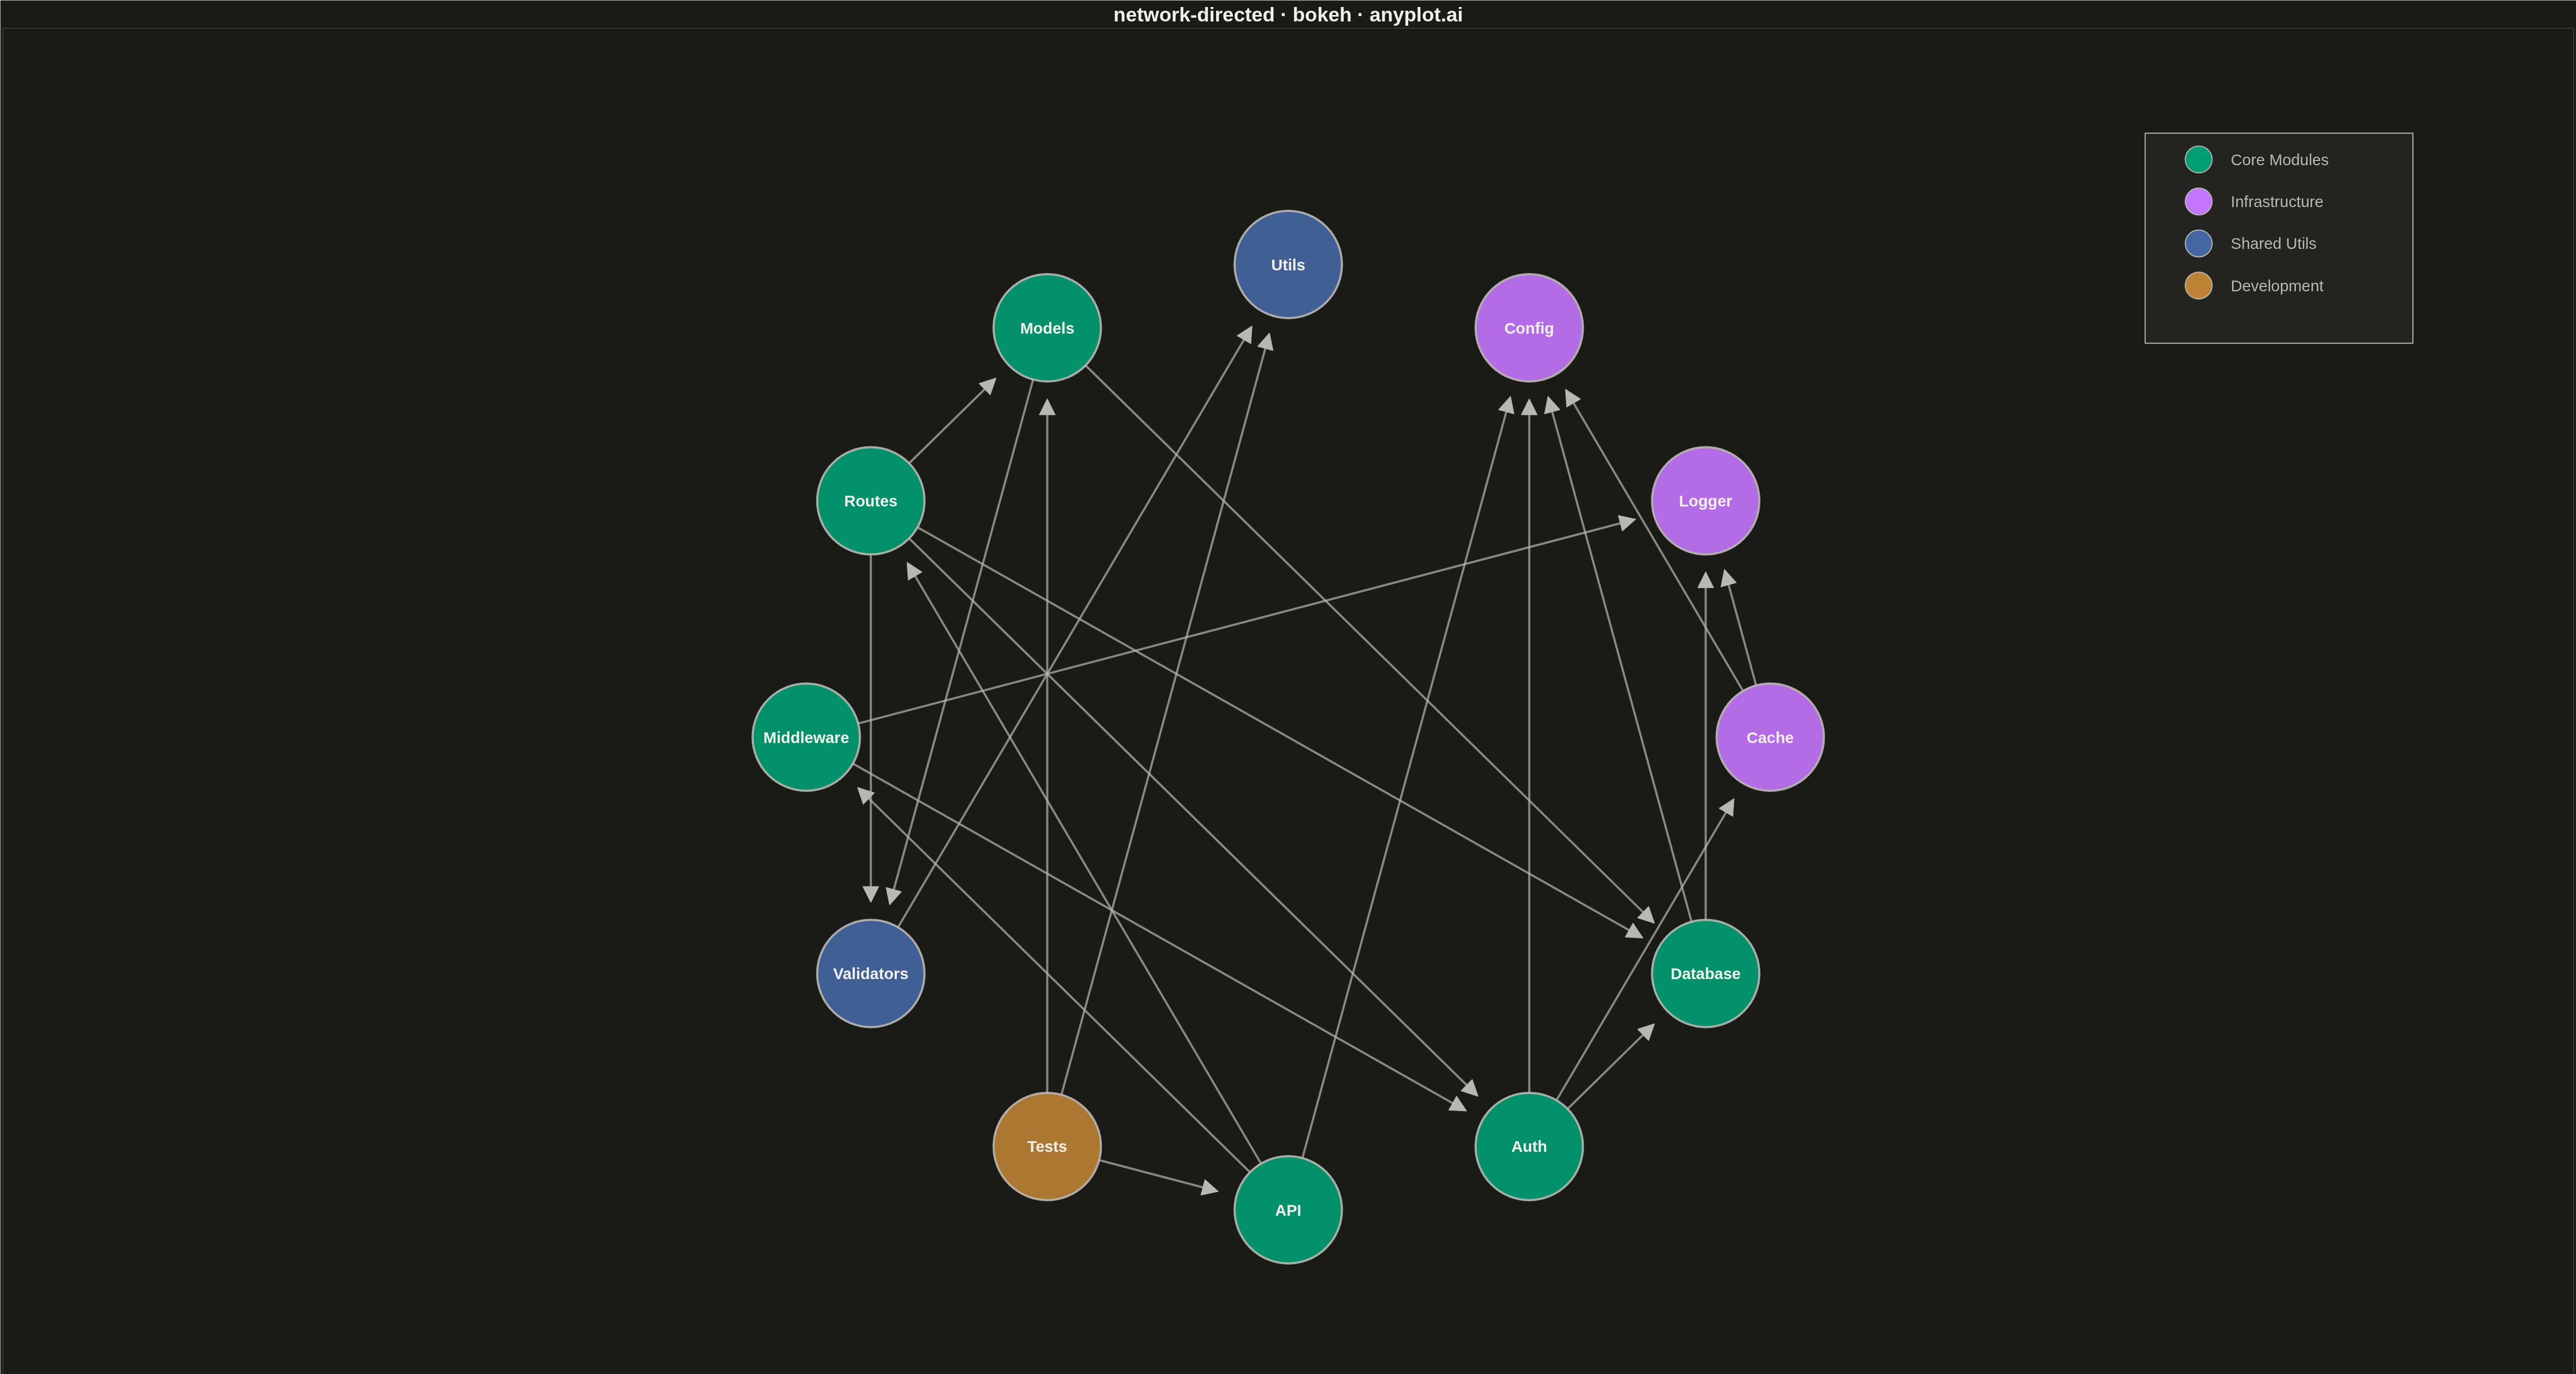
A directed network graph visualizes relationships between entities using nodes connected by edges with arrows, indicating the direction of relationships or flow. Unlike undirected graphs, directed graphs reveal asymmetric relationships such as dependencies, hierarchies, or information flow. The arrows clearly communicate which entity points to which, making cause-and-effect relationships and directional dependencies immediately visible.
""" anyplot.ai
network-directed: Directed Network Graph
Library: bokeh 3.9.0 | Python 3.13.13
Quality: 91/100 | Updated: 2026-05-14
"""

import os
import time
from pathlib import Path

import numpy as np
from bokeh.io import output_file, save
from bokeh.models import Arrow, ColumnDataSource, LabelSet, NormalHead
from bokeh.plotting import figure
from selenium import webdriver
from selenium.webdriver.chrome.options import Options


# Theme tokens
THEME = os.getenv("ANYPLOT_THEME", "light")
PAGE_BG = "#FAF8F1" if THEME == "light" else "#1A1A17"
ELEVATED_BG = "#FFFDF6" if THEME == "light" else "#242420"
INK = "#1A1A17" if THEME == "light" else "#F0EFE8"
INK_SOFT = "#4A4A44" if THEME == "light" else "#B8B7B0"
BRAND = "#009E73"

# Data: Software module dependencies
np.random.seed(42)

# Define nodes (software modules)
nodes = {
    "api": {"label": "API", "group": "core"},
    "auth": {"label": "Auth", "group": "core"},
    "database": {"label": "Database", "group": "core"},
    "cache": {"label": "Cache", "group": "infra"},
    "logger": {"label": "Logger", "group": "infra"},
    "config": {"label": "Config", "group": "infra"},
    "utils": {"label": "Utils", "group": "shared"},
    "models": {"label": "Models", "group": "core"},
    "routes": {"label": "Routes", "group": "core"},
    "middleware": {"label": "Middleware", "group": "core"},
    "validators": {"label": "Validators", "group": "shared"},
    "tests": {"label": "Tests", "group": "dev"},
}

# Define directed edges (dependencies: source imports target)
edges = [
    ("api", "routes"),
    ("api", "middleware"),
    ("api", "config"),
    ("routes", "auth"),
    ("routes", "database"),
    ("routes", "models"),
    ("routes", "validators"),
    ("middleware", "auth"),
    ("middleware", "logger"),
    ("auth", "database"),
    ("auth", "cache"),
    ("auth", "config"),
    ("database", "config"),
    ("database", "logger"),
    ("cache", "config"),
    ("cache", "logger"),
    ("models", "database"),
    ("models", "validators"),
    ("validators", "utils"),
    ("tests", "api"),
    ("tests", "models"),
    ("tests", "utils"),
]

# Use circular layout for clear visualization - scaled for 4800x2700 canvas
n_nodes = len(nodes)
node_ids = list(nodes.keys())
angles = np.linspace(0, 2 * np.pi, n_nodes, endpoint=False)

# Position nodes in a circle - use larger scale for canvas
radius = 900
center_x, center_y = 2400, 1350

positions = {}
for i, node_id in enumerate(node_ids):
    # Offset angle to have 'api' at the top
    angle = angles[i] - np.pi / 2
    positions[node_id] = {"x": center_x + radius * np.cos(angle), "y": center_y + radius * np.sin(angle)}

# Okabe-Ito color palette for groups
group_colors = {
    "core": BRAND,  # #009E73 - bluish green (Okabe-Ito position 1)
    "infra": "#C475FD",  # vermillion
    "shared": "#4467A3",  # blue
    "dev": "#BD8233",  # reddish purple
}

# Prepare node data
node_x = [positions[n]["x"] for n in node_ids]
node_y = [positions[n]["y"] for n in node_ids]
node_labels = [nodes[n]["label"] for n in node_ids]
node_colors = [group_colors[nodes[n]["group"]] for n in node_ids]

node_source = ColumnDataSource(data={"x": node_x, "y": node_y, "label": node_labels, "color": node_colors})

# Create figure with proper canvas size
p = figure(
    width=4800,
    height=2700,
    title="network-directed · bokeh · anyplot.ai",
    x_range=(0, 4800),
    y_range=(0, 2700),
    tools="",
    toolbar_location=None,
)

# Theme styling
p.background_fill_color = PAGE_BG
p.border_fill_color = PAGE_BG
p.outline_line_color = None
p.axis.visible = False
p.grid.visible = False

# Style title
p.title.text_font_size = "28pt"
p.title.text_color = INK
p.title.align = "center"

# Draw edges with arrows
arrow_color = INK_SOFT
for source_node, target_node in edges:
    sx, sy = positions[source_node]["x"], positions[source_node]["y"]
    tx, ty = positions[target_node]["x"], positions[target_node]["y"]

    # Calculate direction vector
    dx = tx - sx
    dy = ty - sy
    length = np.sqrt(dx**2 + dy**2)

    # Shorten edges to not overlap with nodes
    node_radius = 100  # Visual node radius scaled for canvas
    start_offset = node_radius / length
    end_offset = (node_radius + 35) / length  # Extra space for arrow head

    # Adjusted start and end points
    start_x = sx + dx * start_offset
    start_y = sy + dy * start_offset
    end_x = tx - dx * end_offset
    end_y = ty - dy * end_offset

    # Add arrow
    p.add_layout(
        Arrow(
            end=NormalHead(size=30, fill_color=arrow_color, line_color=arrow_color),
            x_start=start_x,
            y_start=start_y,
            x_end=end_x,
            y_end=end_y,
            line_color=arrow_color,
            line_width=4,
            line_alpha=0.7,
        )
    )

# Draw nodes - larger size for visibility
p.scatter(x="x", y="y", source=node_source, size=200, fill_color="color", line_color=INK_SOFT, line_width=4, alpha=0.9)

# Add labels on nodes
labels = LabelSet(
    x="x",
    y="y",
    text="label",
    source=node_source,
    text_font_size="22pt",
    text_color=INK,
    text_align="center",
    text_baseline="middle",
    text_font_style="bold",
)
p.add_layout(labels)

# Add legend in upper right
legend_x = 4100
legend_y = 2450
legend_items = [
    ("Core Modules", group_colors["core"]),
    ("Infrastructure", group_colors["infra"]),
    ("Shared Utils", group_colors["shared"]),
    ("Development", group_colors["dev"]),
]

# Legend background
p.rect(
    x=4250, y=2300, width=500, height=400, fill_color=ELEVATED_BG, fill_alpha=0.95, line_color=INK_SOFT, line_width=2
)

for i, (label, color) in enumerate(legend_items):
    y_pos = legend_y - i * 80
    p.scatter(x=[legend_x], y=[y_pos], size=50, fill_color=color, line_color=INK_SOFT, line_width=2)
    p.text(
        x=[legend_x + 60], y=[y_pos], text=[label], text_font_size="22pt", text_baseline="middle", text_color=INK_SOFT
    )

# Write the interactive HTML (also a required catalog artifact)
output_file(f"plot-{THEME}.html")
save(p)

# Screenshot it with headless Chrome — Selenium 4 / Selenium Manager
# auto-resolves a working driver for the system Chrome.
W, H = 4800, 2700
opts = Options()
for arg in (
    "--headless=new",
    "--no-sandbox",
    "--disable-dev-shm-usage",
    "--disable-gpu",
    f"--window-size={W},{H}",
    "--hide-scrollbars",
):
    opts.add_argument(arg)
driver = webdriver.Chrome(options=opts)
driver.set_window_size(W, H)
driver.get(f"file://{Path(f'plot-{THEME}.html').resolve()}")
time.sleep(3)  # let bokeh's JS render the canvas
driver.save_screenshot(f"plot-{THEME}.png")
driver.quit()
Runnable source as JSON, for any HTTP client: https://api.anyplot.ai/specs/network-directed/bokeh/code. Any spec id and library id listed in llms-full.txt fit the same URL shape; every URL below is complete and callable.
{
  "spec_id": "network-directed",
  "language": "python",
  "library": "bokeh",
  "page": "https://anyplot.ai/network-directed/python/bokeh",
  "hub": "https://anyplot.ai/network-directed",
  "code_json": "https://api.anyplot.ai/specs/network-directed/bokeh/code",
  "spec_json": "https://api.anyplot.ai/specs/network-directed",
  "render_light_png": "https://storage.googleapis.com/anyplot-images/plots/network-directed/python/bokeh/plot-light.png",
  "render_dark_png": "https://storage.googleapis.com/anyplot-images/plots/network-directed/python/bokeh/plot-dark.png",
  "interactive_light_html": "https://storage.googleapis.com/anyplot-images/plots/network-directed/python/bokeh/plot-light.html",
  "interactive_dark_html": "https://storage.googleapis.com/anyplot-images/plots/network-directed/python/bokeh/plot-dark.html",
  "quality_score": 91.0,
  "license": "MIT",
  "guide": "https://anyplot.ai/llms.txt"
}
Part of Directed Network Graph on anyplot.ai.