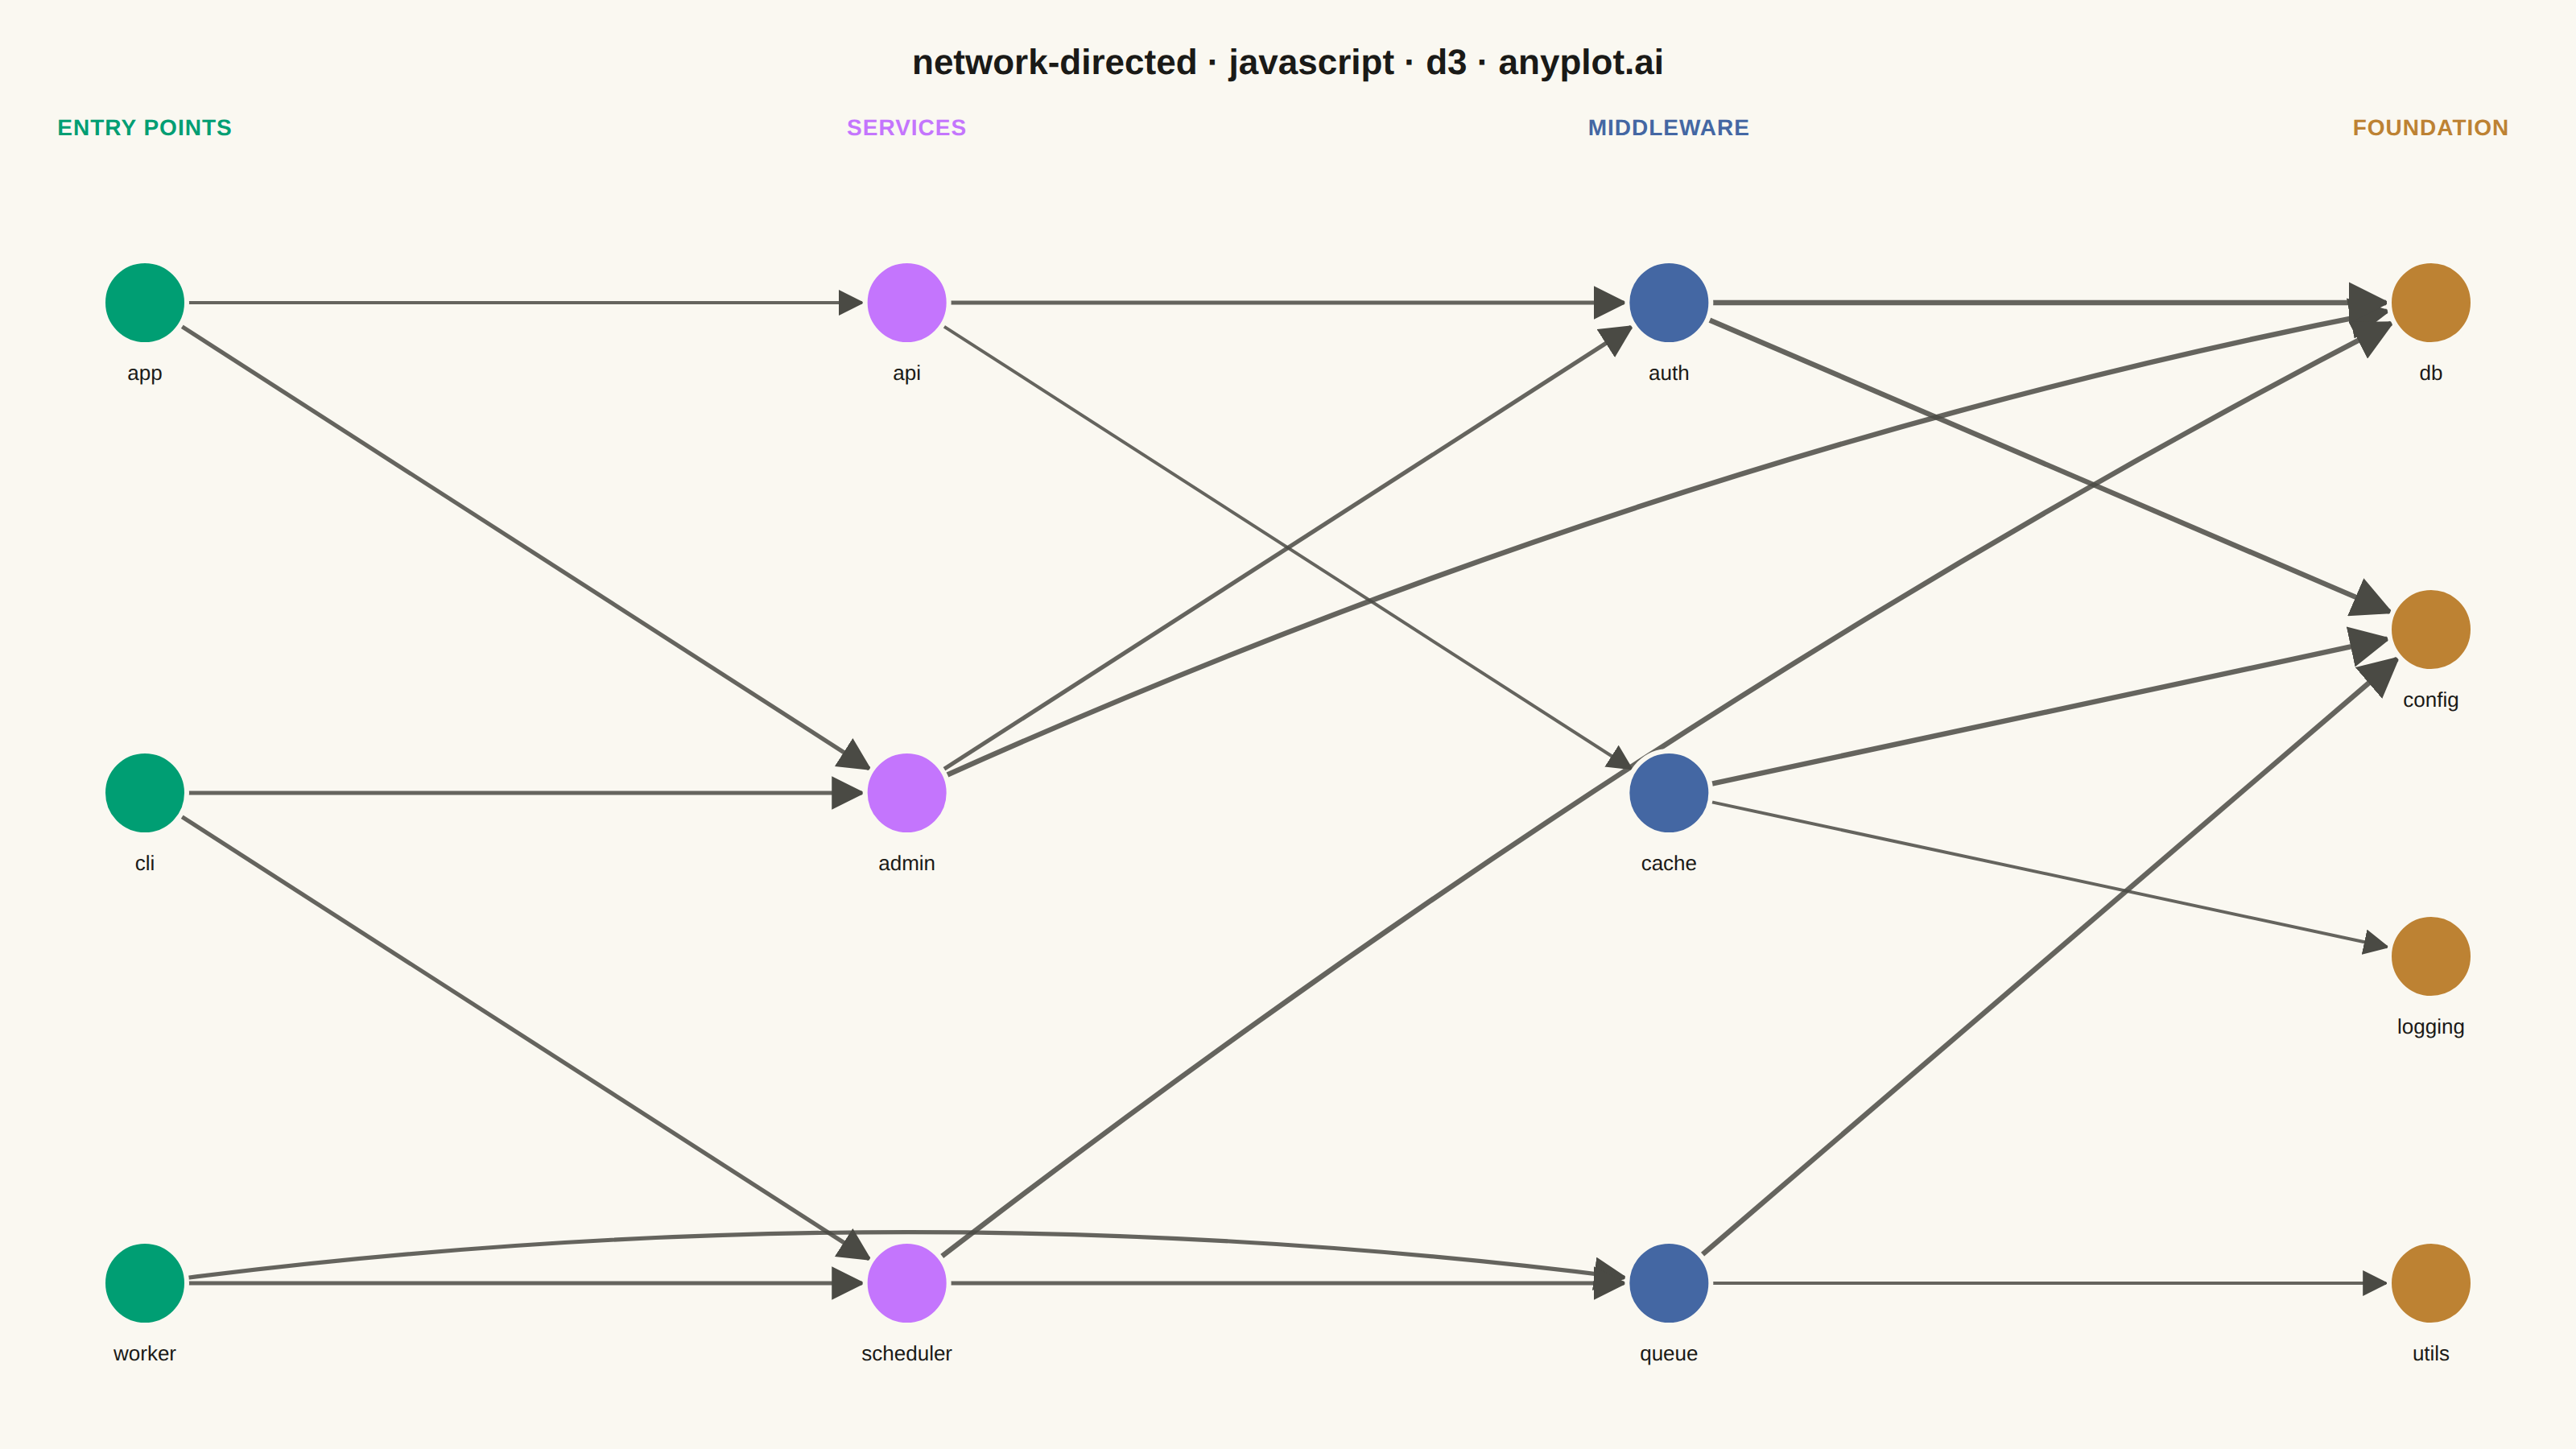
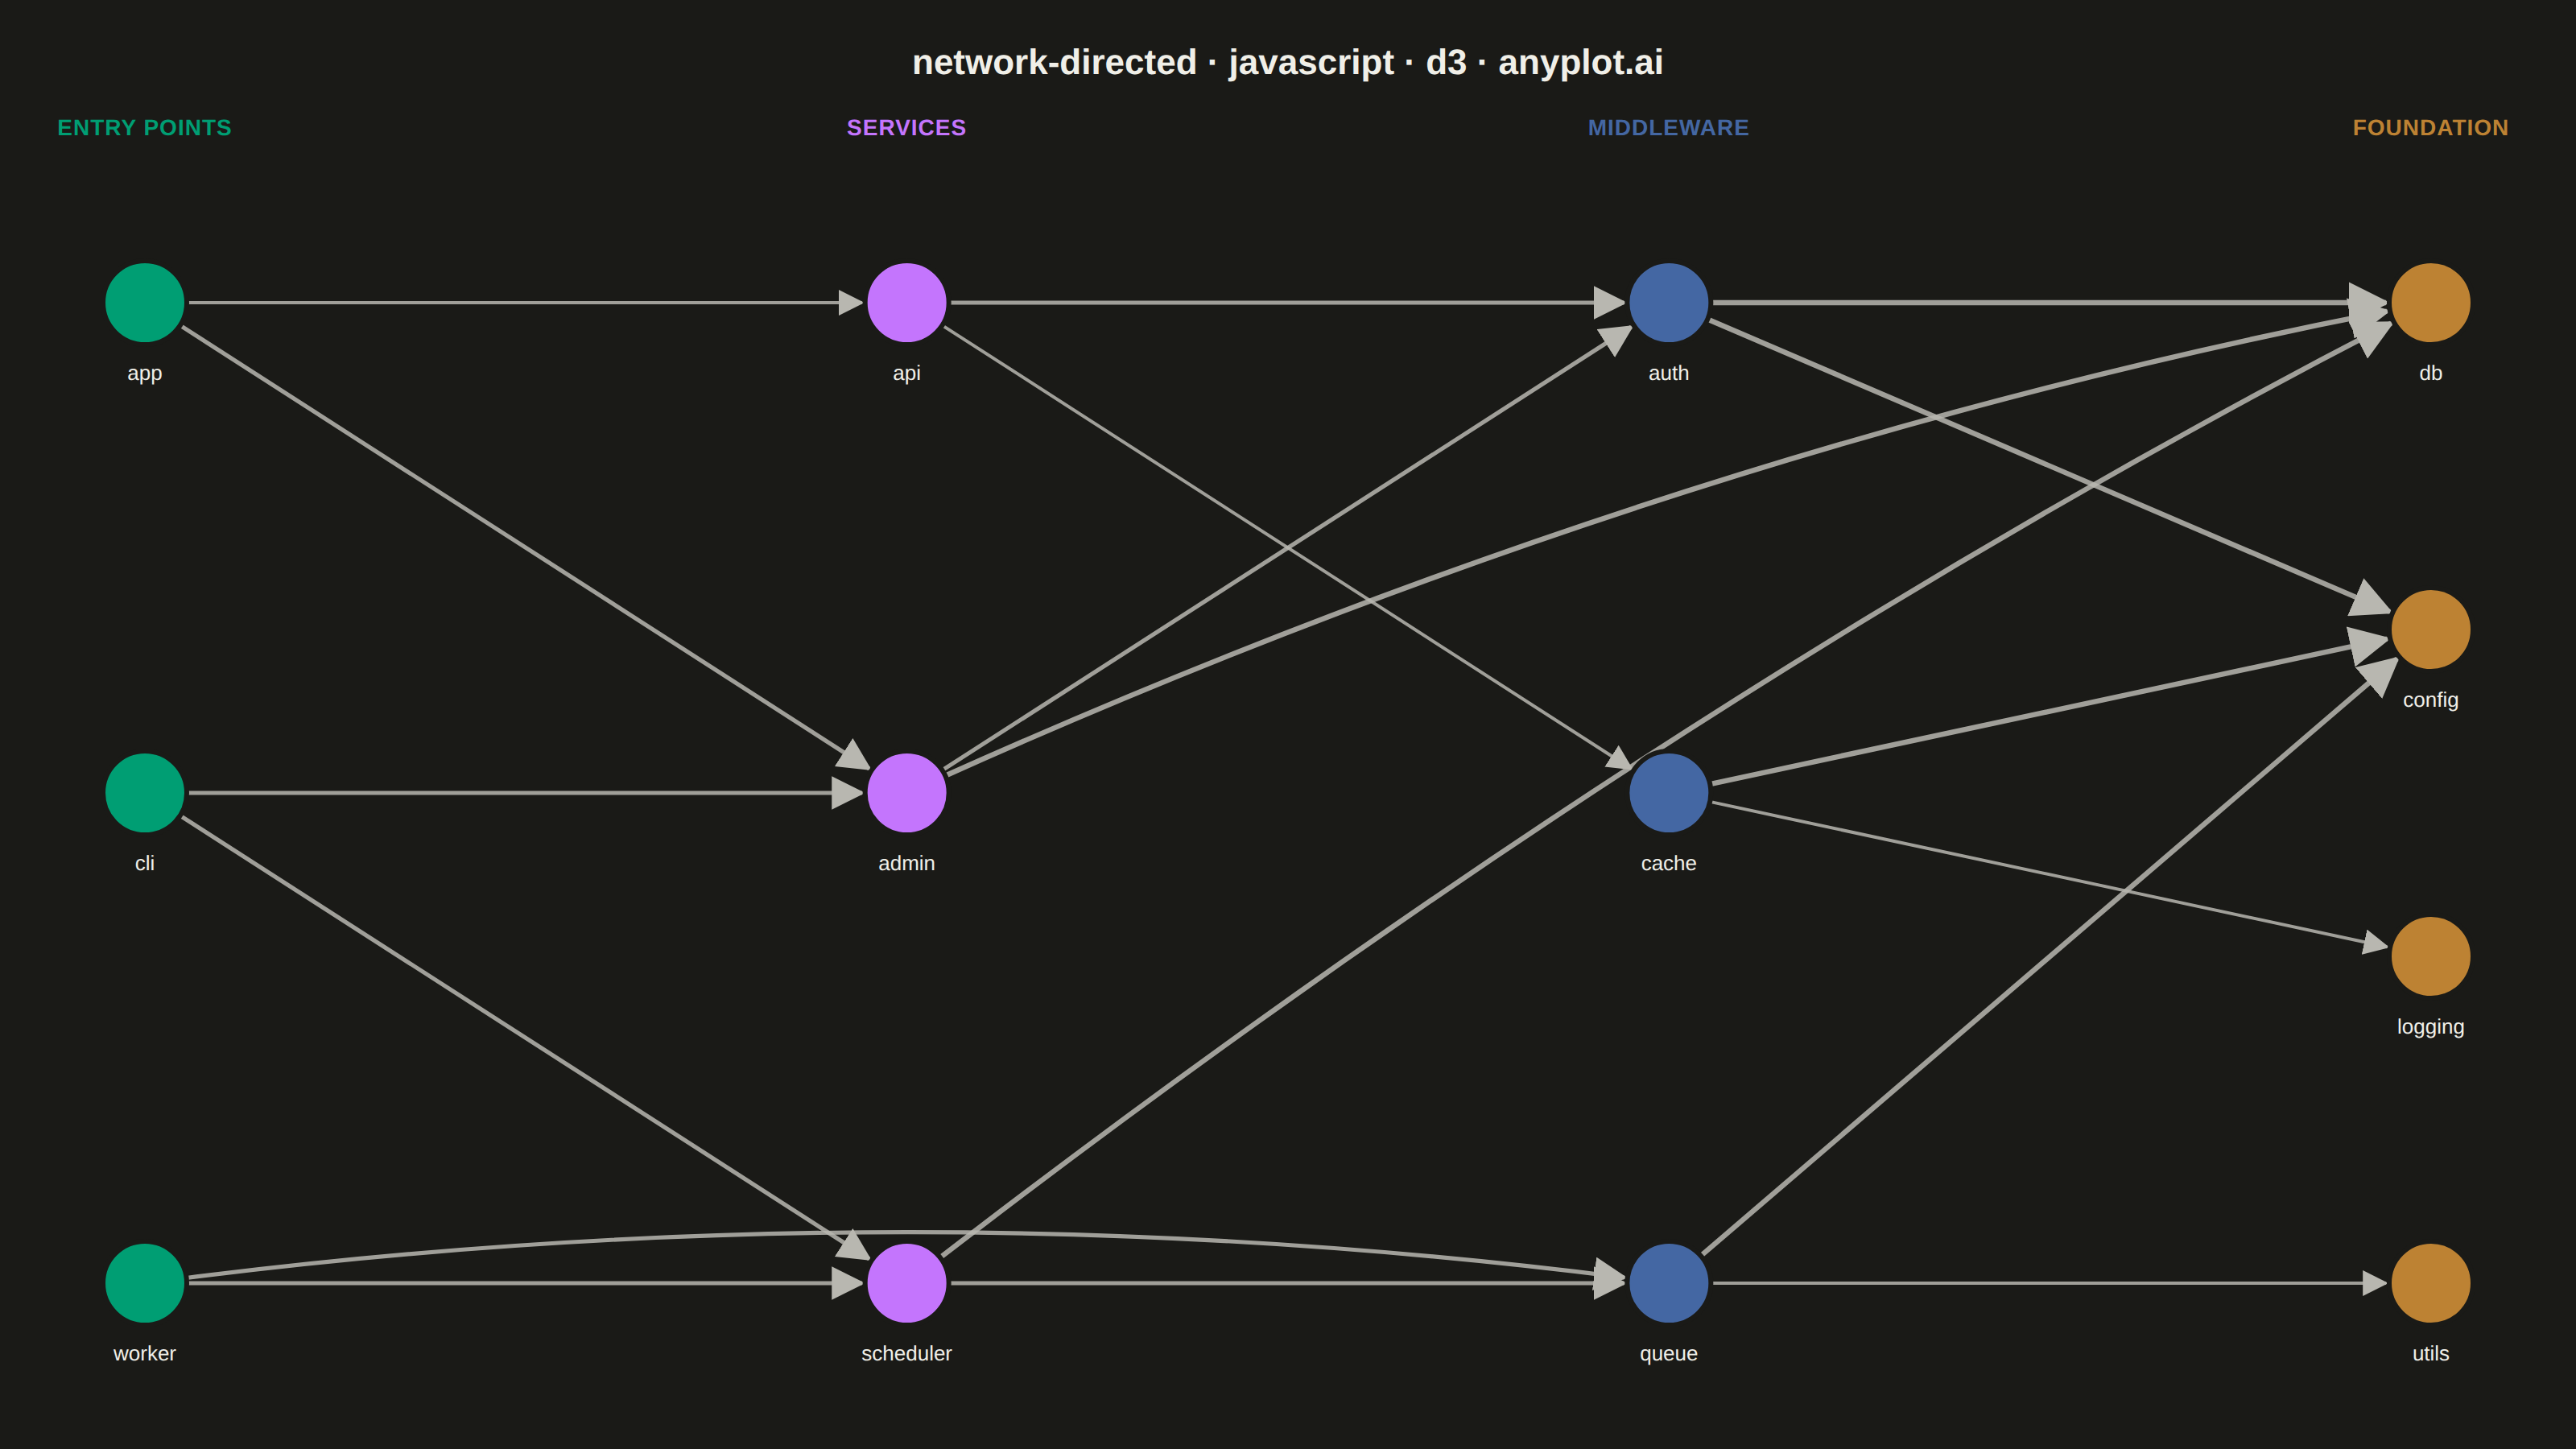
The same plot in 14 other libraries — JavaScript: Chart.js, Apache ECharts, Highcharts, MUI X Charts; Python: Altair, Bokeh, lets-plot, Matplotlib, Plotly, plotnine, Pygal, Seaborn; R: ggplot2; Julia: Makie.jl. Compare all 15 side by side: Directed Network Graph in Python, R, Julia and JavaScript.
A directed network graph visualizes relationships between entities using nodes connected by edges with arrows, indicating the direction of relationships or flow. Unlike undirected graphs, directed graphs reveal asymmetric relationships such as dependencies, hierarchies, or information flow. The arrows clearly communicate which entity points to which, making cause-and-effect relationships and directional dependencies immediately visible.
// anyplot.ai
// network-directed: Directed Network Graph
// Library: d3 7.9.0 | JavaScript 22.23.2
// Quality: 92/100 | Created: 2026-09-05

const t = window.ANYPLOT_TOKENS;
const { width, height } = window.ANYPLOT_SIZE;
const margin = { top: 130, right: 90, bottom: 45, left: 90 };
const iw = width - margin.left - margin.right;
const ih = height - margin.top - margin.bottom;
const radius = 26;

// --- Data: a software package dependency graph (in-memory, deterministic) --
// Four build tiers, left-to-right; arrows point from a package to the
// package it imports (its dependency).
const tiers = [
  { name: "Entry points", color: t.palette[0], ids: ["app", "cli", "worker"] },
  { name: "Services", color: t.palette[1], ids: ["api", "admin", "scheduler"] },
  { name: "Middleware", color: t.palette[2], ids: ["auth", "cache", "queue"] },
  { name: "Foundation", color: t.palette[3], ids: ["db", "config", "logging", "utils"] },
];

const rawEdges = [
  ["app", "api"], ["app", "admin"],
  ["cli", "scheduler"], ["cli", "admin"],
  ["worker", "scheduler"], ["worker", "queue"],
  ["api", "auth"], ["api", "cache"],
  ["admin", "auth"], ["admin", "db"],
  ["scheduler", "queue"], ["scheduler", "db"],
  ["auth", "db"], ["auth", "config"],
  ["cache", "config"], ["cache", "logging"],
  ["queue", "config"], ["queue", "utils"],
];

// Weight each edge by its target's in-degree: packages many others depend on
// ("db", "config") read as thicker, more prominent arrows — a data-driven
// stand-in for the spec's optional edge-weight attribute.
const inDegree = d3.rollup(rawEdges, (v) => v.length, ([, target]) => target);
const weightScale = d3
  .scaleLinear()
  .domain([1, d3.max(inDegree.values())])
  .range([2, 3.2])
  .clamp(true);
const edges = rawEdges.map(([source, target]) => ({
  source,
  target,
  weight: weightScale(inDegree.get(target)),
}));

// --- Layout: fixed layered columns; every tier's node row spans the same
// fraction of the plot height regardless of node count, so all four columns
// use the canvas evenly instead of the shortest tier leaving slack below it.
const yScale = d3.scaleLinear().domain([0, 1]).range([margin.top + ih * 0.08, margin.top + ih * 0.92]);

const nodeById = new Map();
tiers.forEach((tier, ti) => {
  const x = margin.left + ti * (iw / (tiers.length - 1));
  tier.ids.forEach((id, i) => {
    const frac = tier.ids.length > 1 ? i / (tier.ids.length - 1) : 0.5;
    nodeById.set(id, { id, x, y: yScale(frac), tier: ti, color: tier.color });
  });
});

// Trim a quadratic curve to the circle boundary at both ends so the
// arrowhead lands right at the node edge instead of under the fill.
function edgePath(source, target, bow) {
  const mx = (source.x + target.x) / 2;
  const my = (source.y + target.y) / 2 + bow;
  const d1x = mx - source.x, d1y = my - source.y;
  const len1 = Math.hypot(d1x, d1y) || 1;
  const sx = source.x + (d1x / len1) * radius;
  const sy = source.y + (d1y / len1) * radius;
  const d2x = target.x - mx, d2y = target.y - my;
  const len2 = Math.hypot(d2x, d2y) || 1;
  const ex = target.x - (d2x / len2) * (radius + 2);
  const ey = target.y - (d2y / len2) * (radius + 2);
  return `M${sx},${sy} Q${mx},${my} ${ex},${ey}`;
}

// --- SVG mount ---------------------------------------------------------------
const svg = d3.select("#container").append("svg").attr("width", width).attr("height", height);

svg
  .append("defs")
  .append("marker")
  .attr("id", "arrowhead")
  .attr("viewBox", "0 0 10 10")
  .attr("refX", 9)
  .attr("refY", 5)
  .attr("markerWidth", 8)
  .attr("markerHeight", 8)
  .attr("orient", "auto")
  .append("path")
  .attr("d", "M0,0 L10,5 L0,10 Z")
  .attr("fill", t.inkSoft);

// --- Edges (drawn first, so nodes sit on top) --------------------------------
svg
  .selectAll("path.edge")
  .data(edges)
  .join("path")
  .attr("class", "edge")
  .attr("d", (d, i) => {
    const source = nodeById.get(d.source);
    const target = nodeById.get(d.target);
    const skipsTier = target.tier - source.tier > 1;
    const bow = skipsTier ? (i % 2 === 0 ? 60 : -60) : 0;
    return edgePath(source, target, bow);
  })
  .attr("fill", "none")
  .attr("stroke", t.inkSoft)
  .attr("stroke-opacity", 0.85)
  .attr("stroke-width", (d) => d.weight)
  .attr("marker-end", "url(#arrowhead)");

// --- Nodes --------------------------------------------------------------------
const node = svg
  .selectAll("g.node")
  .data([...nodeById.values()])
  .join("g")
  .attr("class", "node")
  .attr("transform", (d) => `translate(${d.x},${d.y})`);

node
  .append("circle")
  .attr("r", radius)
  .attr("fill", (d) => d.color)
  .attr("stroke", t.pageBg)
  .attr("stroke-width", 3);

node
  .append("text")
  .attr("y", radius + 22)
  .attr("text-anchor", "middle")
  .attr("fill", t.ink)
  .style("font-size", "13px")
  .style("font-weight", 500)
  .text((d) => d.id);

// --- Tier headers (double as the color legend) -------------------------------
svg
  .selectAll("text.tier")
  .data(tiers)
  .join("text")
  .attr("class", "tier")
  .attr("x", (d, i) => margin.left + i * (iw / (tiers.length - 1)))
  .attr("y", margin.top - 46)
  .attr("text-anchor", "middle")
  .attr("fill", (d) => d.color)
  .style("font-size", "14px")
  .style("font-weight", 700)
  .style("letter-spacing", "0.5px")
  .text((d) => d.name.toUpperCase());

// --- Title ---------------------------------------------------------------------
svg
  .append("text")
  .attr("x", width / 2)
  .attr("y", 46)
  .attr("text-anchor", "middle")
  .attr("fill", t.ink)
  .style("font-size", "22px")
  .style("font-weight", 600)
  .text("network-directed · javascript · d3 · anyplot.ai");
Runnable source as JSON, for any HTTP client: https://api.anyplot.ai/specs/network-directed/d3/code. Any spec id and library id listed in llms-full.txt fit the same URL shape; every URL below is complete and callable.
{
  "spec_id": "network-directed",
  "language": "javascript",
  "library": "d3",
  "page": "https://anyplot.ai/network-directed/javascript/d3",
  "hub": "https://anyplot.ai/network-directed",
  "code_json": "https://api.anyplot.ai/specs/network-directed/d3/code",
  "spec_json": "https://api.anyplot.ai/specs/network-directed",
  "render_light_png": "https://storage.googleapis.com/anyplot-images/plots/network-directed/javascript/d3/plot-light.png",
  "render_dark_png": "https://storage.googleapis.com/anyplot-images/plots/network-directed/javascript/d3/plot-dark.png",
  "interactive_light_html": "https://storage.googleapis.com/anyplot-images/plots/network-directed/javascript/d3/plot-light.html",
  "interactive_dark_html": "https://storage.googleapis.com/anyplot-images/plots/network-directed/javascript/d3/plot-dark.html",
  "quality_score": 92.0,
  "license": "MIT",
  "guide": "https://anyplot.ai/llms.txt"
}
Part of Directed Network Graph on anyplot.ai.