The same plot in 14 other libraries — JavaScript: Chart.js, D3.js, Apache ECharts, MUI X Charts; Python: Altair, Bokeh, lets-plot, Matplotlib, Plotly, plotnine, Pygal, Seaborn; R: ggplot2; Julia: Makie.jl. Compare all 15 side by side: Directed Network Graph in Python, R, Julia and JavaScript.
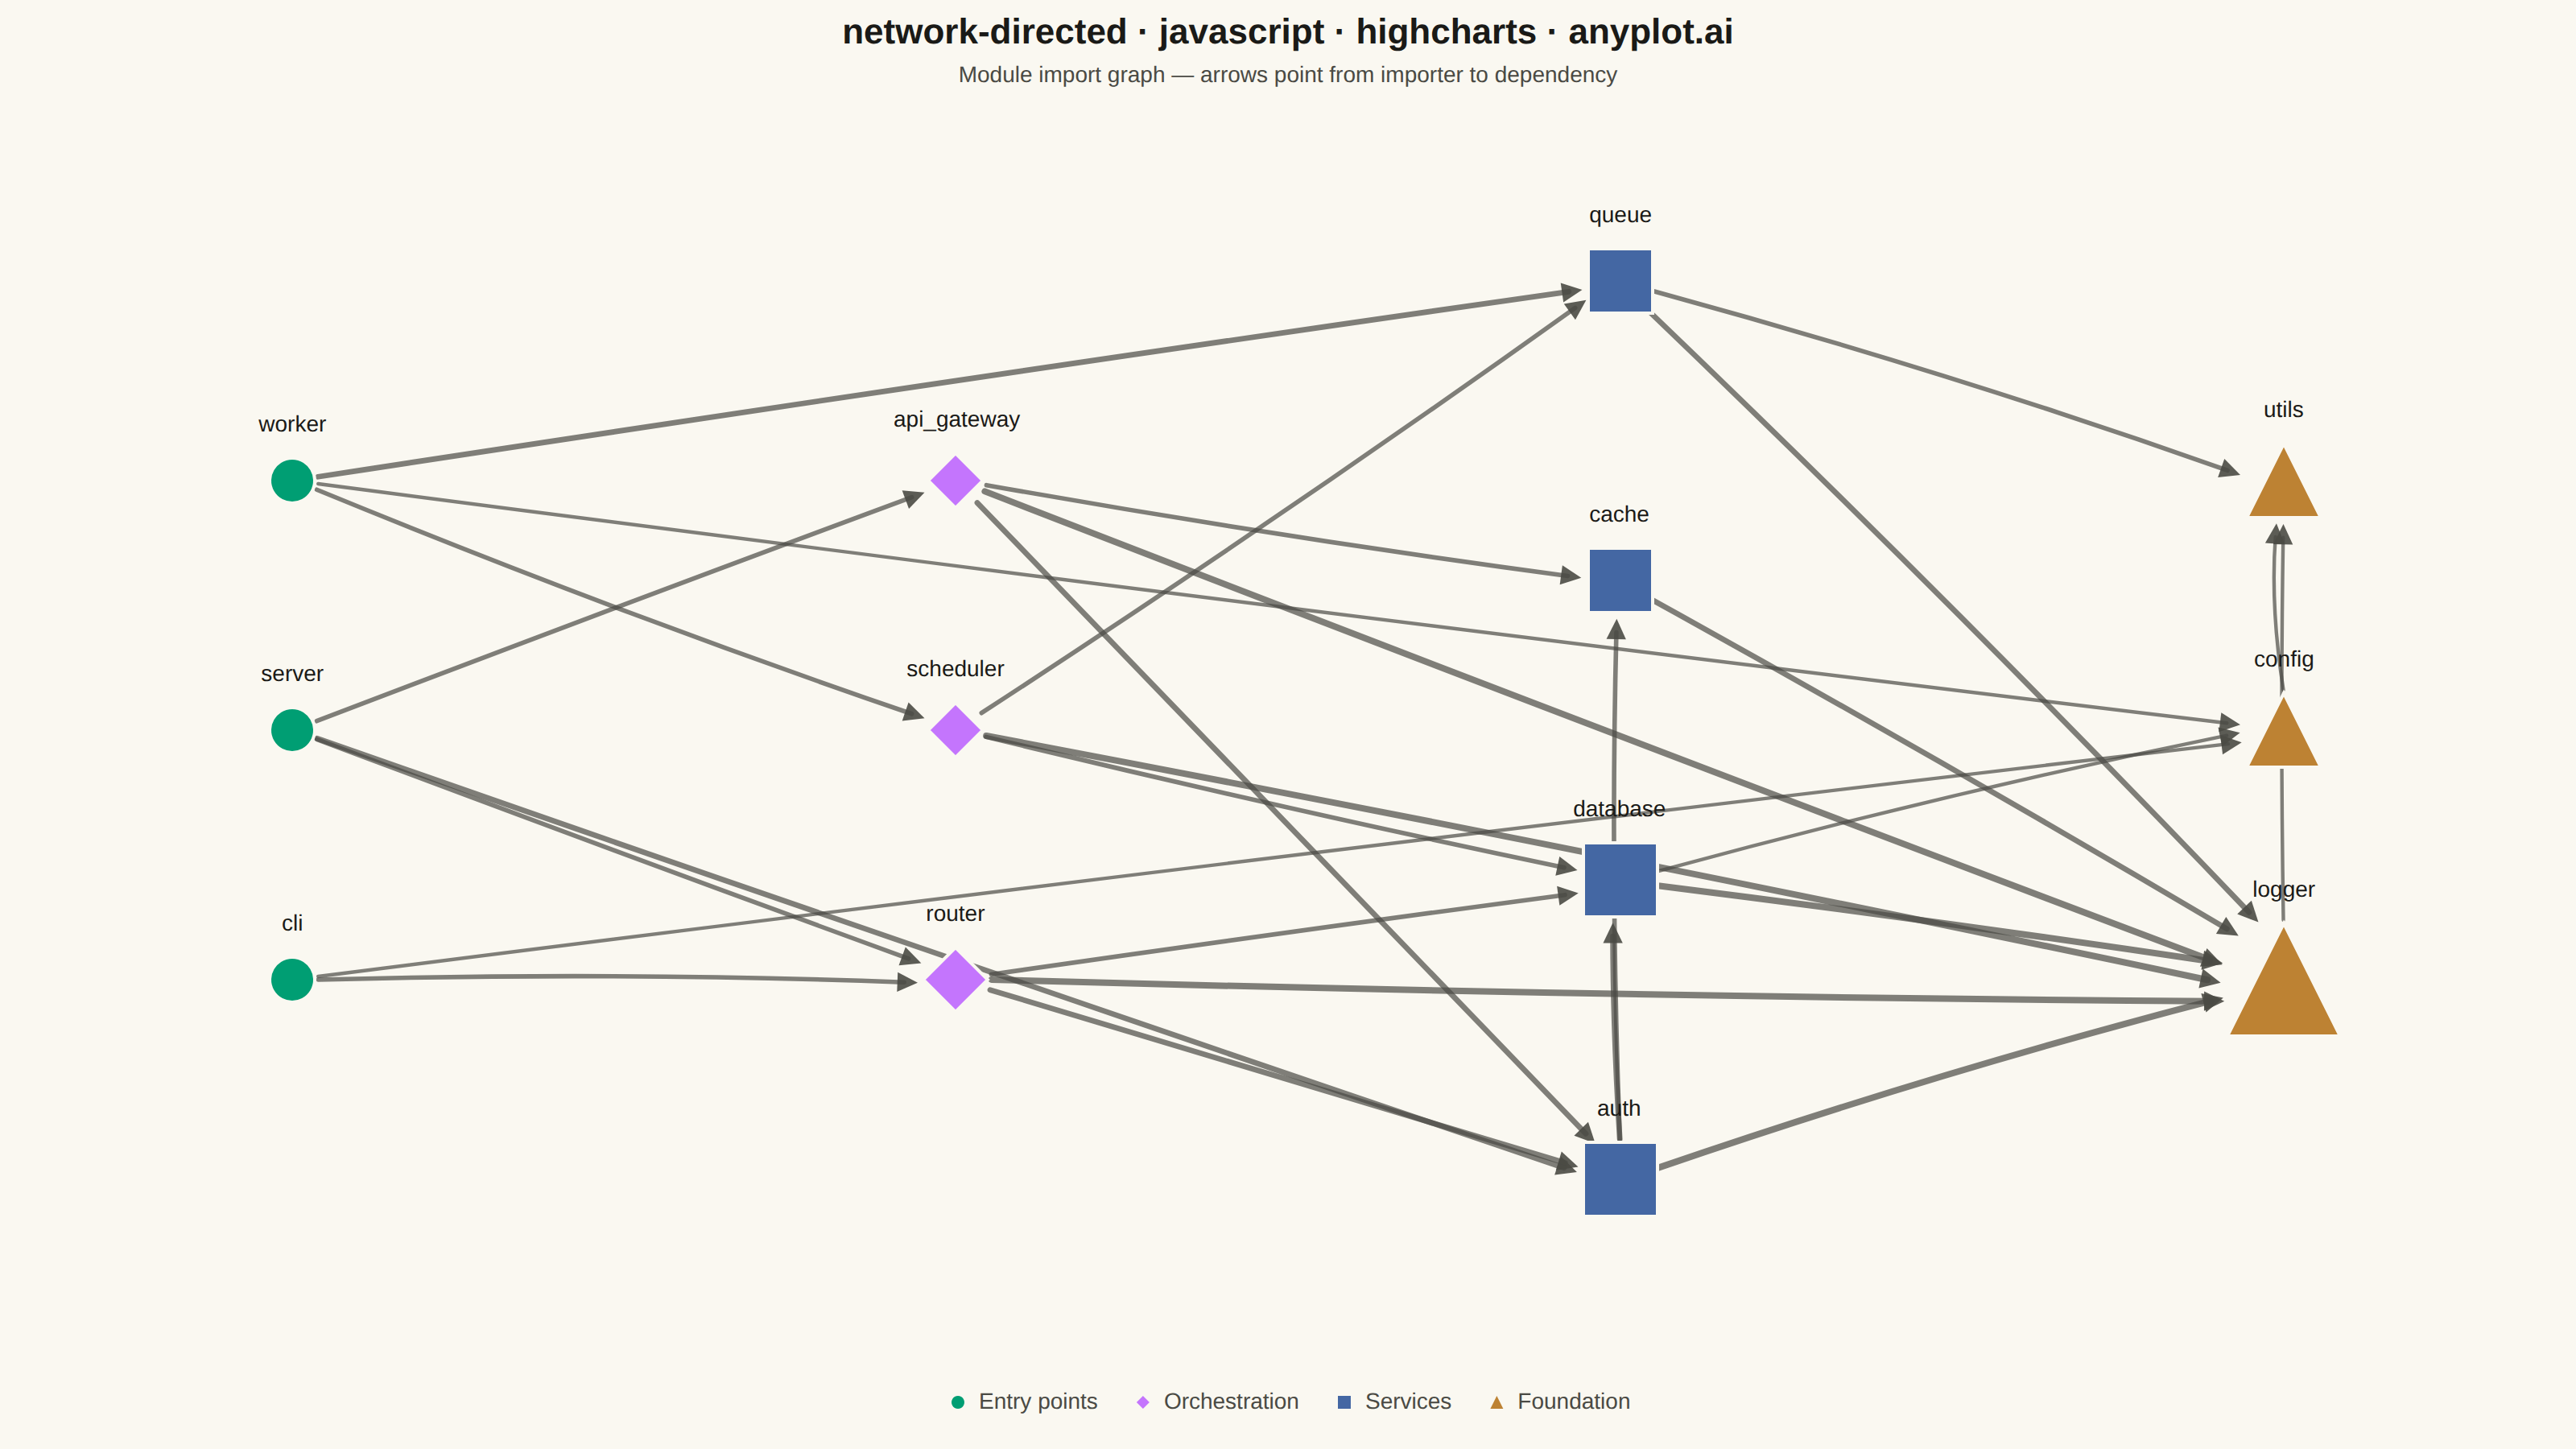
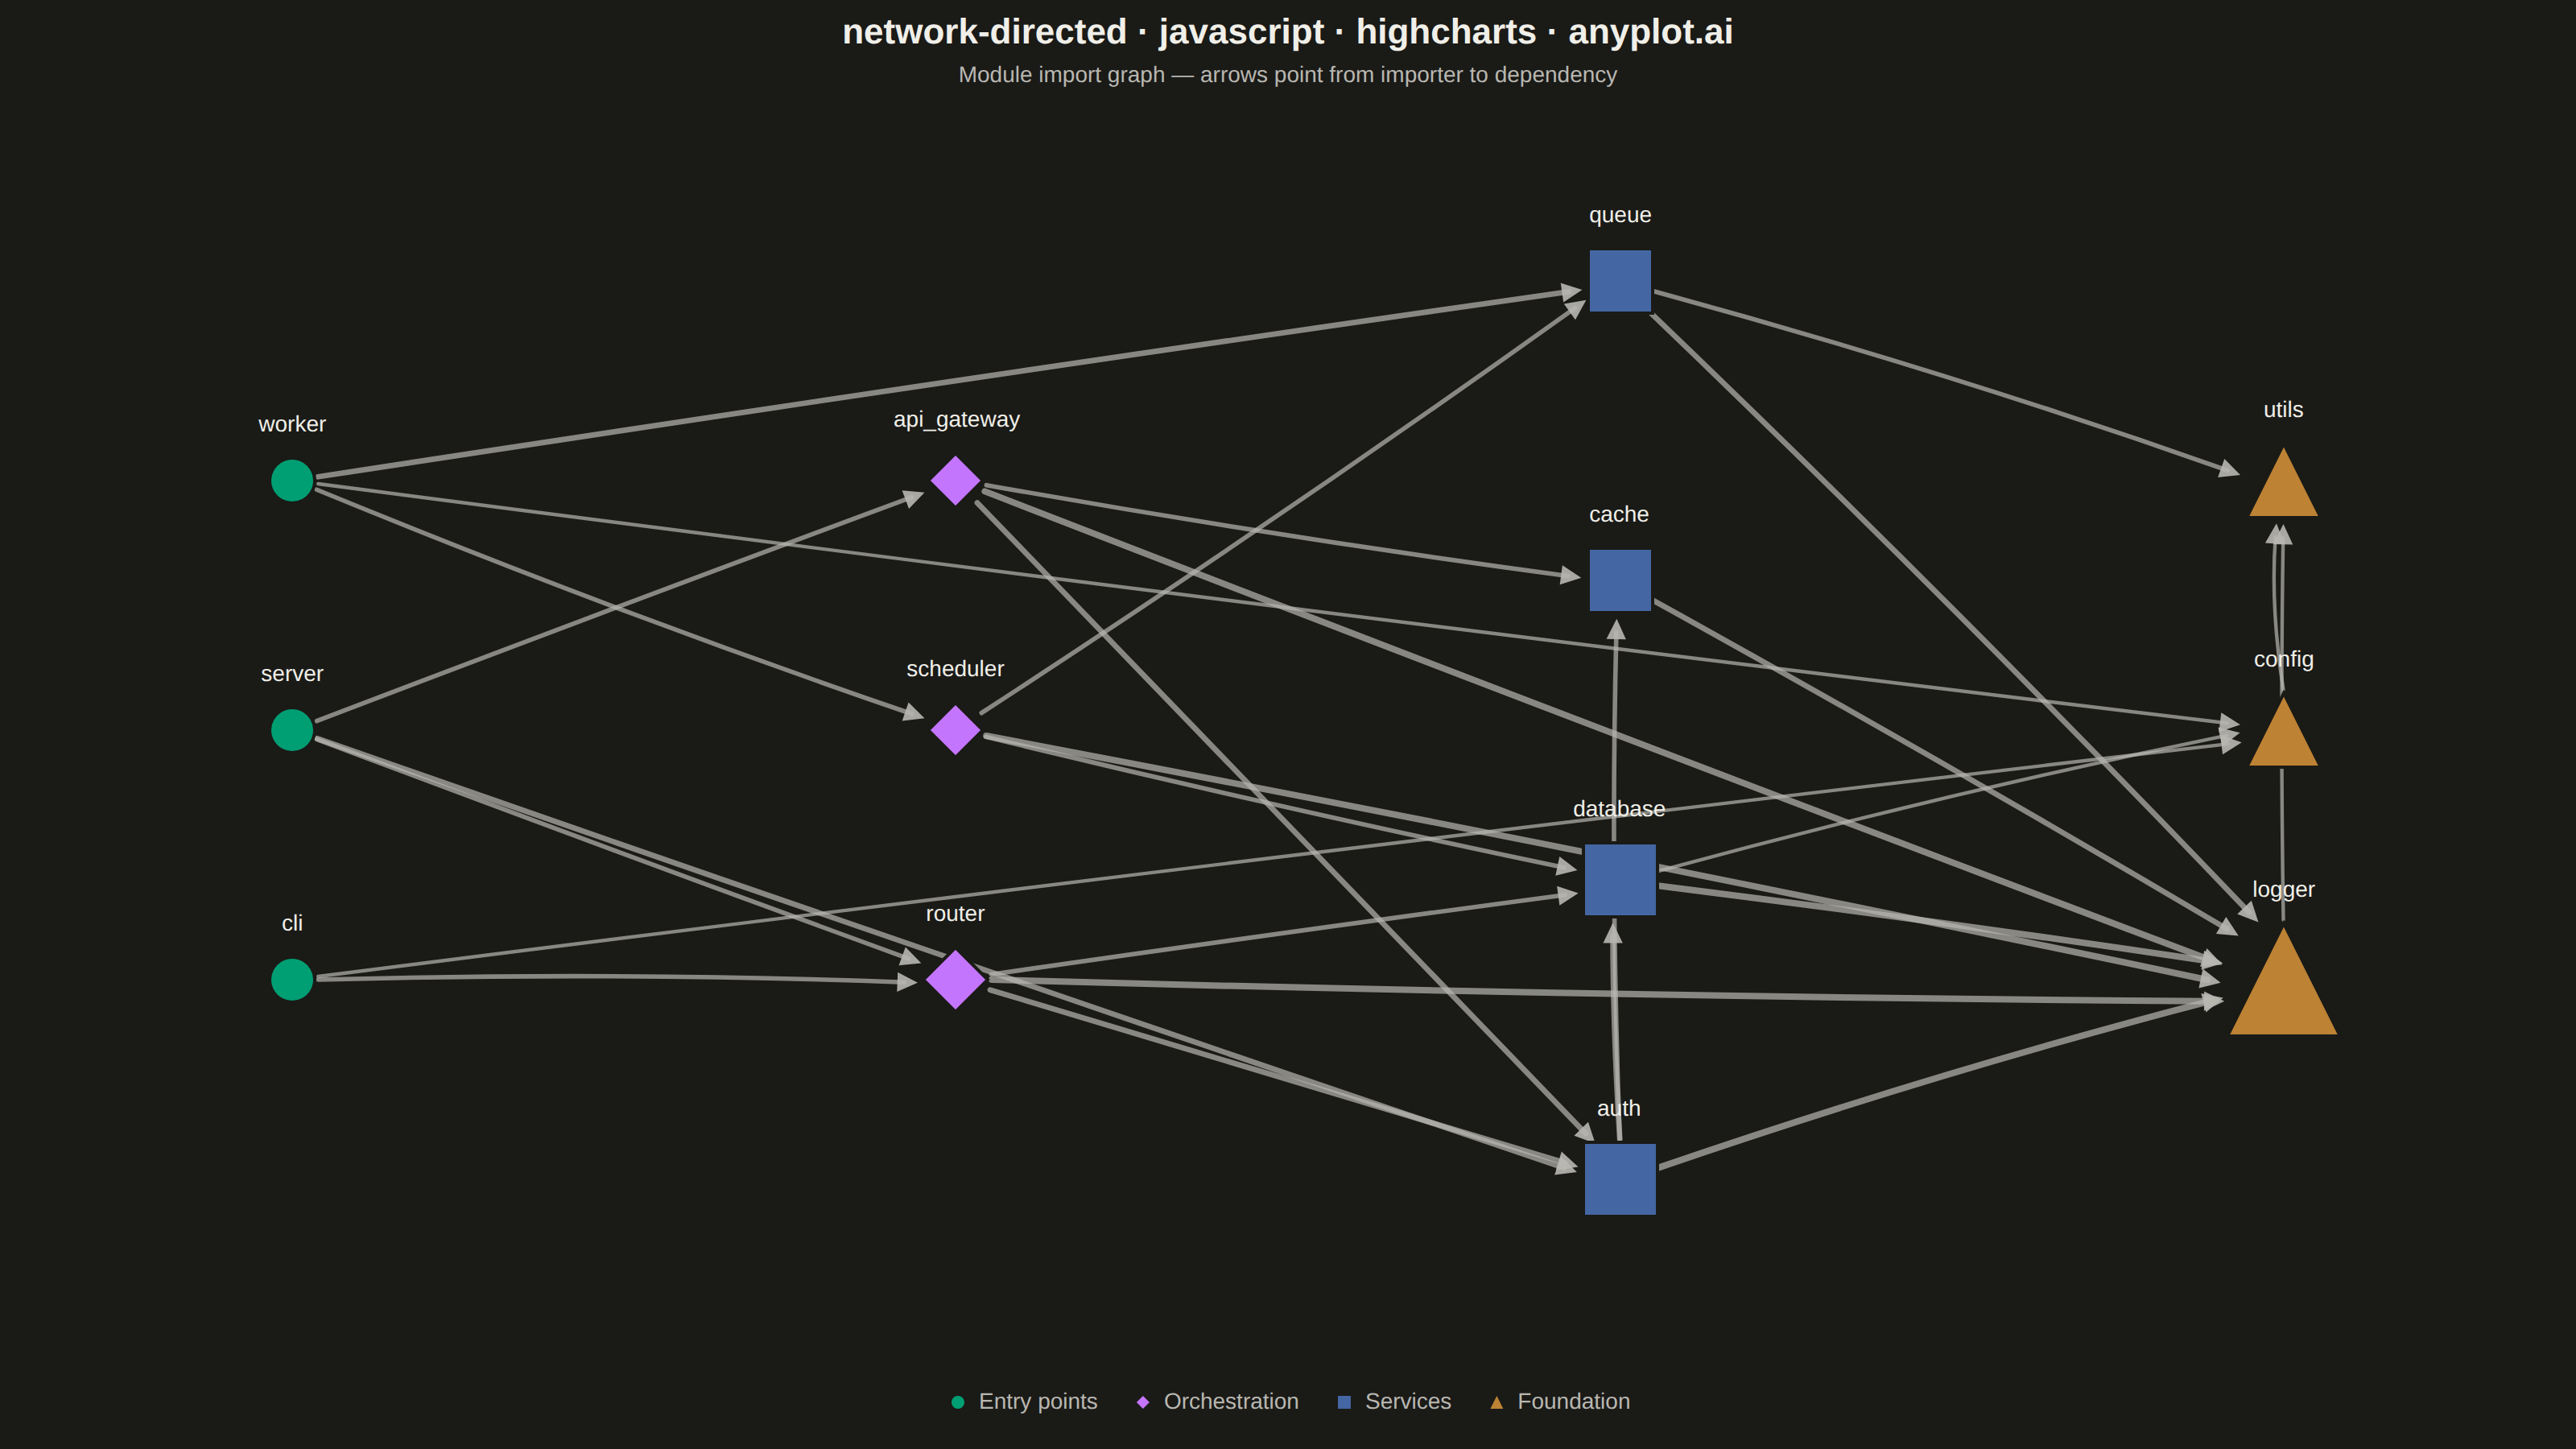
A directed network graph visualizes relationships between entities using nodes connected by edges with arrows, indicating the direction of relationships or flow. Unlike undirected graphs, directed graphs reveal asymmetric relationships such as dependencies, hierarchies, or information flow. The arrows clearly communicate which entity points to which, making cause-and-effect relationships and directional dependencies immediately visible.
// anyplot.ai
// network-directed: Directed Network Graph
// Library: highcharts 12.6.0 | JavaScript 22.23.2
// Quality: 89/100 | Created: 2026-09-05

const t = window.ANYPLOT_TOKENS;

// --- Data: a software module import graph, laid out in dependency tiers ----
// Arrows point from an importing module to the module it imports. Node radius
// encodes in-degree (how many other modules import it), so the shared
// foundation modules read as visual hubs.
const TIERS = [
  {
    name: "Entry points",
    color: t.palette[0],
    nodes: [
      { id: "cli", name: "cli", y: 1, indeg: 0 },
      { id: "server", name: "server", y: 2, indeg: 0 },
      { id: "worker", name: "worker", y: 3, indeg: 0 },
    ],
  },
  {
    name: "Orchestration",
    color: t.palette[1],
    nodes: [
      { id: "router", name: "router", y: 1, indeg: 2 },
      { id: "scheduler", name: "scheduler", y: 2, indeg: 1 },
      { id: "api_gateway", name: "api_gateway", y: 3, indeg: 1 },
    ],
  },
  {
    name: "Services",
    color: t.palette[2],
    nodes: [
      { id: "auth", name: "auth", y: 0.2, indeg: 3 },
      { id: "database", name: "database", y: 1.4, indeg: 3 },
      { id: "cache", name: "cache", y: 2.6, indeg: 2 },
      { id: "queue", name: "queue", y: 3.8, indeg: 2 },
    ],
  },
  {
    name: "Foundation",
    color: t.palette[3],
    nodes: [
      { id: "logger", name: "logger", y: 1, indeg: 7 },
      { id: "config", name: "config", y: 2, indeg: 3 },
      { id: "utils", name: "utils", y: 3, indeg: 3 },
    ],
  },
];

// Third element is the call-frequency weight (spec's optional `weight`
// attribute), rendered as edge line thickness.
const EDGES = [
  ["cli", "router", 3],
  ["cli", "config", 2],
  ["server", "router", 3],
  ["server", "auth", 4],
  ["server", "api_gateway", 3],
  ["worker", "scheduler", 3],
  ["worker", "queue", 4],
  ["worker", "config", 2],
  ["router", "auth", 4],
  ["router", "database", 3],
  ["router", "logger", 5],
  ["scheduler", "queue", 3],
  ["scheduler", "database", 3],
  ["scheduler", "logger", 5],
  ["api_gateway", "auth", 4],
  ["api_gateway", "cache", 3],
  ["api_gateway", "logger", 5],
  ["auth", "database", 4],
  ["auth", "cache", 3],
  ["auth", "logger", 5],
  ["database", "logger", 5],
  ["database", "config", 2],
  ["cache", "logger", 4],
  ["queue", "logger", 4],
  ["queue", "utils", 3],
  ["logger", "utils", 2],
  ["config", "utils", 2],
];

const nodeRadius = (indeg) => 14 + indeg * 3;

// --- Chart -------------------------------------------------------------
const series = TIERS.map((tier, i) => ({
  name: tier.name,
  color: tier.color,
  data: tier.nodes.map((n) => ({
    id: n.id,
    x: i * 3.6,
    y: n.y,
    name: n.name,
    marker: { radius: nodeRadius(n.indeg), lineColor: t.pageBg, lineWidth: 2 },
    dataLabels: { format: n.name, y: -(nodeRadius(n.indeg) + 10) },
  })),
}));

Highcharts.chart("container", {
  chart: {
    type: "scatter",
    backgroundColor: "transparent",
    animation: false,
    style: { fontFamily: "inherit" },
    events: {
      load() {
        drawEdges(this);
      },
    },
  },
  credits: { enabled: false },
  title: {
    text: "network-directed · javascript · highcharts · anyplot.ai",
    style: { color: t.ink, fontSize: "22px", fontWeight: "600" },
  },
  subtitle: {
    text: "Module import graph — arrows point from importer to dependency",
    style: { color: t.inkSoft, fontSize: "14px" },
  },
  xAxis: {
    min: -1.5,
    max: 12.3,
    lineWidth: 0,
    tickLength: 0,
    gridLineWidth: 0,
    labels: { enabled: false },
    title: { text: null },
  },
  yAxis: {
    min: -0.3,
    max: 4.3,
    lineWidth: 0,
    tickLength: 0,
    gridLineWidth: 0,
    labels: { enabled: false },
    title: { text: null },
  },
  legend: {
    itemStyle: { color: t.inkSoft, fontSize: "14px" },
    itemHoverStyle: { color: t.ink },
  },
  tooltip: { enabled: false },
  plotOptions: {
    series: {
      animation: false,
      dataLabels: {
        enabled: true,
        style: {
          color: t.ink,
          fontSize: "14px",
          fontWeight: "normal",
          textOutline: "none",
        },
      },
    },
  },
  series,
});

// Edges are drawn once with the core SVGRenderer, behind the node markers —
// the core `highcharts` bundle has no networkgraph module (add-on only), so
// node-link edges with arrowheads are composed by hand from point coordinates.
// Deterministic per-edge signed offset (source/target ids -> stable hash) used
// both to bow the edge slightly and to fan out where it lands on a crowded
// target's perimeter, so parallel/converging paths stay distinguishable.
function edgeHash(fromId, toId) {
  const key = `${fromId}>${toId}`;
  let h = 0;
  for (let i = 0; i < key.length; i++) h = (h * 31 + key.charCodeAt(i)) | 0;
  return h;
}

function drawEdges(c) {
  const group = c.renderer.g("edges").attr({ zIndex: 1 }).add();
  const strokeColor = t.inkSoft;

  const incomingTotal = {};
  EDGES.forEach(([, toId]) => {
    incomingTotal[toId] = (incomingTotal[toId] || 0) + 1;
  });
  const incomingSeen = {};

  EDGES.forEach(([fromId, toId, weight]) => {
    const from = c.get(fromId);
    const to = c.get(toId);
    if (!from || !to) return;

    const sx = c.plotLeft + from.plotX;
    const sy = c.plotTop + from.plotY;
    const tx = c.plotLeft + to.plotX;
    const ty = c.plotTop + to.plotY;

    const dx = tx - sx;
    const dy = ty - sy;
    const dist = Math.sqrt(dx * dx + dy * dy) || 1;
    const ux = dx / dist;
    const uy = dy / dist;

    // Fan incoming arrows around the target node's perimeter instead of all
    // landing on the same point (VQ-03: converging edges were hard to tell
    // apart at hub nodes like "logger" / "database").
    const total = incomingTotal[toId];
    const seen = incomingSeen[toId] || 0;
    incomingSeen[toId] = seen + 1;
    const spread = Math.min(0.7, (total - 1) * 0.16);
    const fanOffset = total > 1 ? -spread / 2 + (spread / (total - 1)) * seen : 0;
    const baseAngleAtTarget = Math.atan2(sy - ty, sx - tx) + fanOffset;

    const rFrom = from.marker.radius + 2;
    const rTo = to.marker.radius + 4;
    const x1 = sx + ux * rFrom;
    const y1 = sy + uy * rFrom;
    const x2 = tx + Math.cos(baseAngleAtTarget) * rTo;
    const y2 = ty + Math.sin(baseAngleAtTarget) * rTo;

    // Slight deterministic curvature so overlapping straight paths through
    // the dense middle tiers stay traceable (DE-03), echoing the spec's own
    // "consider curved edges" guidance.
    const curve = (Math.abs(edgeHash(fromId, toId)) % 14) - 7;
    const midX = (x1 + x2) / 2 - uy * curve;
    const midY = (y1 + y2) / 2 + ux * curve;

    const lineWidth = 1 + (weight || 1) * 0.6;
    drawArrow(c.renderer, group, x1, y1, midX, midY, x2, y2, strokeColor, lineWidth);
  });

  c.series.forEach((s) => s.group.toFront());
  c.series.forEach((s) => s.dataLabelsGroup && s.dataLabelsGroup.toFront());
}

function drawArrow(renderer, group, x1, y1, cx, cy, x2, y2, color, lineWidth) {
  // Tangent of the quadratic curve at its endpoint points from the control
  // point to the endpoint — use it to orient the arrowhead correctly.
  const angle = Math.atan2(y2 - cy, x2 - cx);
  const headLen = 14;
  const headAngle = Math.PI / 7;

  const shaftEndX = x2 - Math.cos(angle) * headLen * 0.6;
  const shaftEndY = y2 - Math.sin(angle) * headLen * 0.6;

  renderer
    .path(["M", x1, y1, "Q", cx, cy, shaftEndX, shaftEndY])
    .attr({
      stroke: color,
      "stroke-width": lineWidth,
      "stroke-linecap": "round",
      fill: "none",
      opacity: 0.7,
    })
    .add(group);

  const p1x = x2 - Math.cos(angle - headAngle) * headLen;
  const p1y = y2 - Math.sin(angle - headAngle) * headLen;
  const p2x = x2 - Math.cos(angle + headAngle) * headLen;
  const p2y = y2 - Math.sin(angle + headAngle) * headLen;

  renderer
    .path(["M", x2, y2, "L", p1x, p1y, "L", p2x, p2y, "Z"])
    .attr({ fill: color, stroke: "none", opacity: 0.9 })
    .add(group);
}
Runnable source as JSON, for any HTTP client: https://api.anyplot.ai/specs/network-directed/highcharts/code. Any spec id and library id listed in llms-full.txt fit the same URL shape; every URL below is complete and callable.
{
  "spec_id": "network-directed",
  "language": "javascript",
  "library": "highcharts",
  "page": "https://anyplot.ai/network-directed/javascript/highcharts",
  "hub": "https://anyplot.ai/network-directed",
  "code_json": "https://api.anyplot.ai/specs/network-directed/highcharts/code",
  "spec_json": "https://api.anyplot.ai/specs/network-directed",
  "render_light_png": "https://storage.googleapis.com/anyplot-images/plots/network-directed/javascript/highcharts/plot-light.png",
  "render_dark_png": "https://storage.googleapis.com/anyplot-images/plots/network-directed/javascript/highcharts/plot-dark.png",
  "interactive_light_html": "https://storage.googleapis.com/anyplot-images/plots/network-directed/javascript/highcharts/plot-light.html",
  "interactive_dark_html": "https://storage.googleapis.com/anyplot-images/plots/network-directed/javascript/highcharts/plot-dark.html",
  "quality_score": 89.0,
  "license": "MIT",
  "guide": "https://anyplot.ai/llms.txt"
}
Part of Directed Network Graph on anyplot.ai.