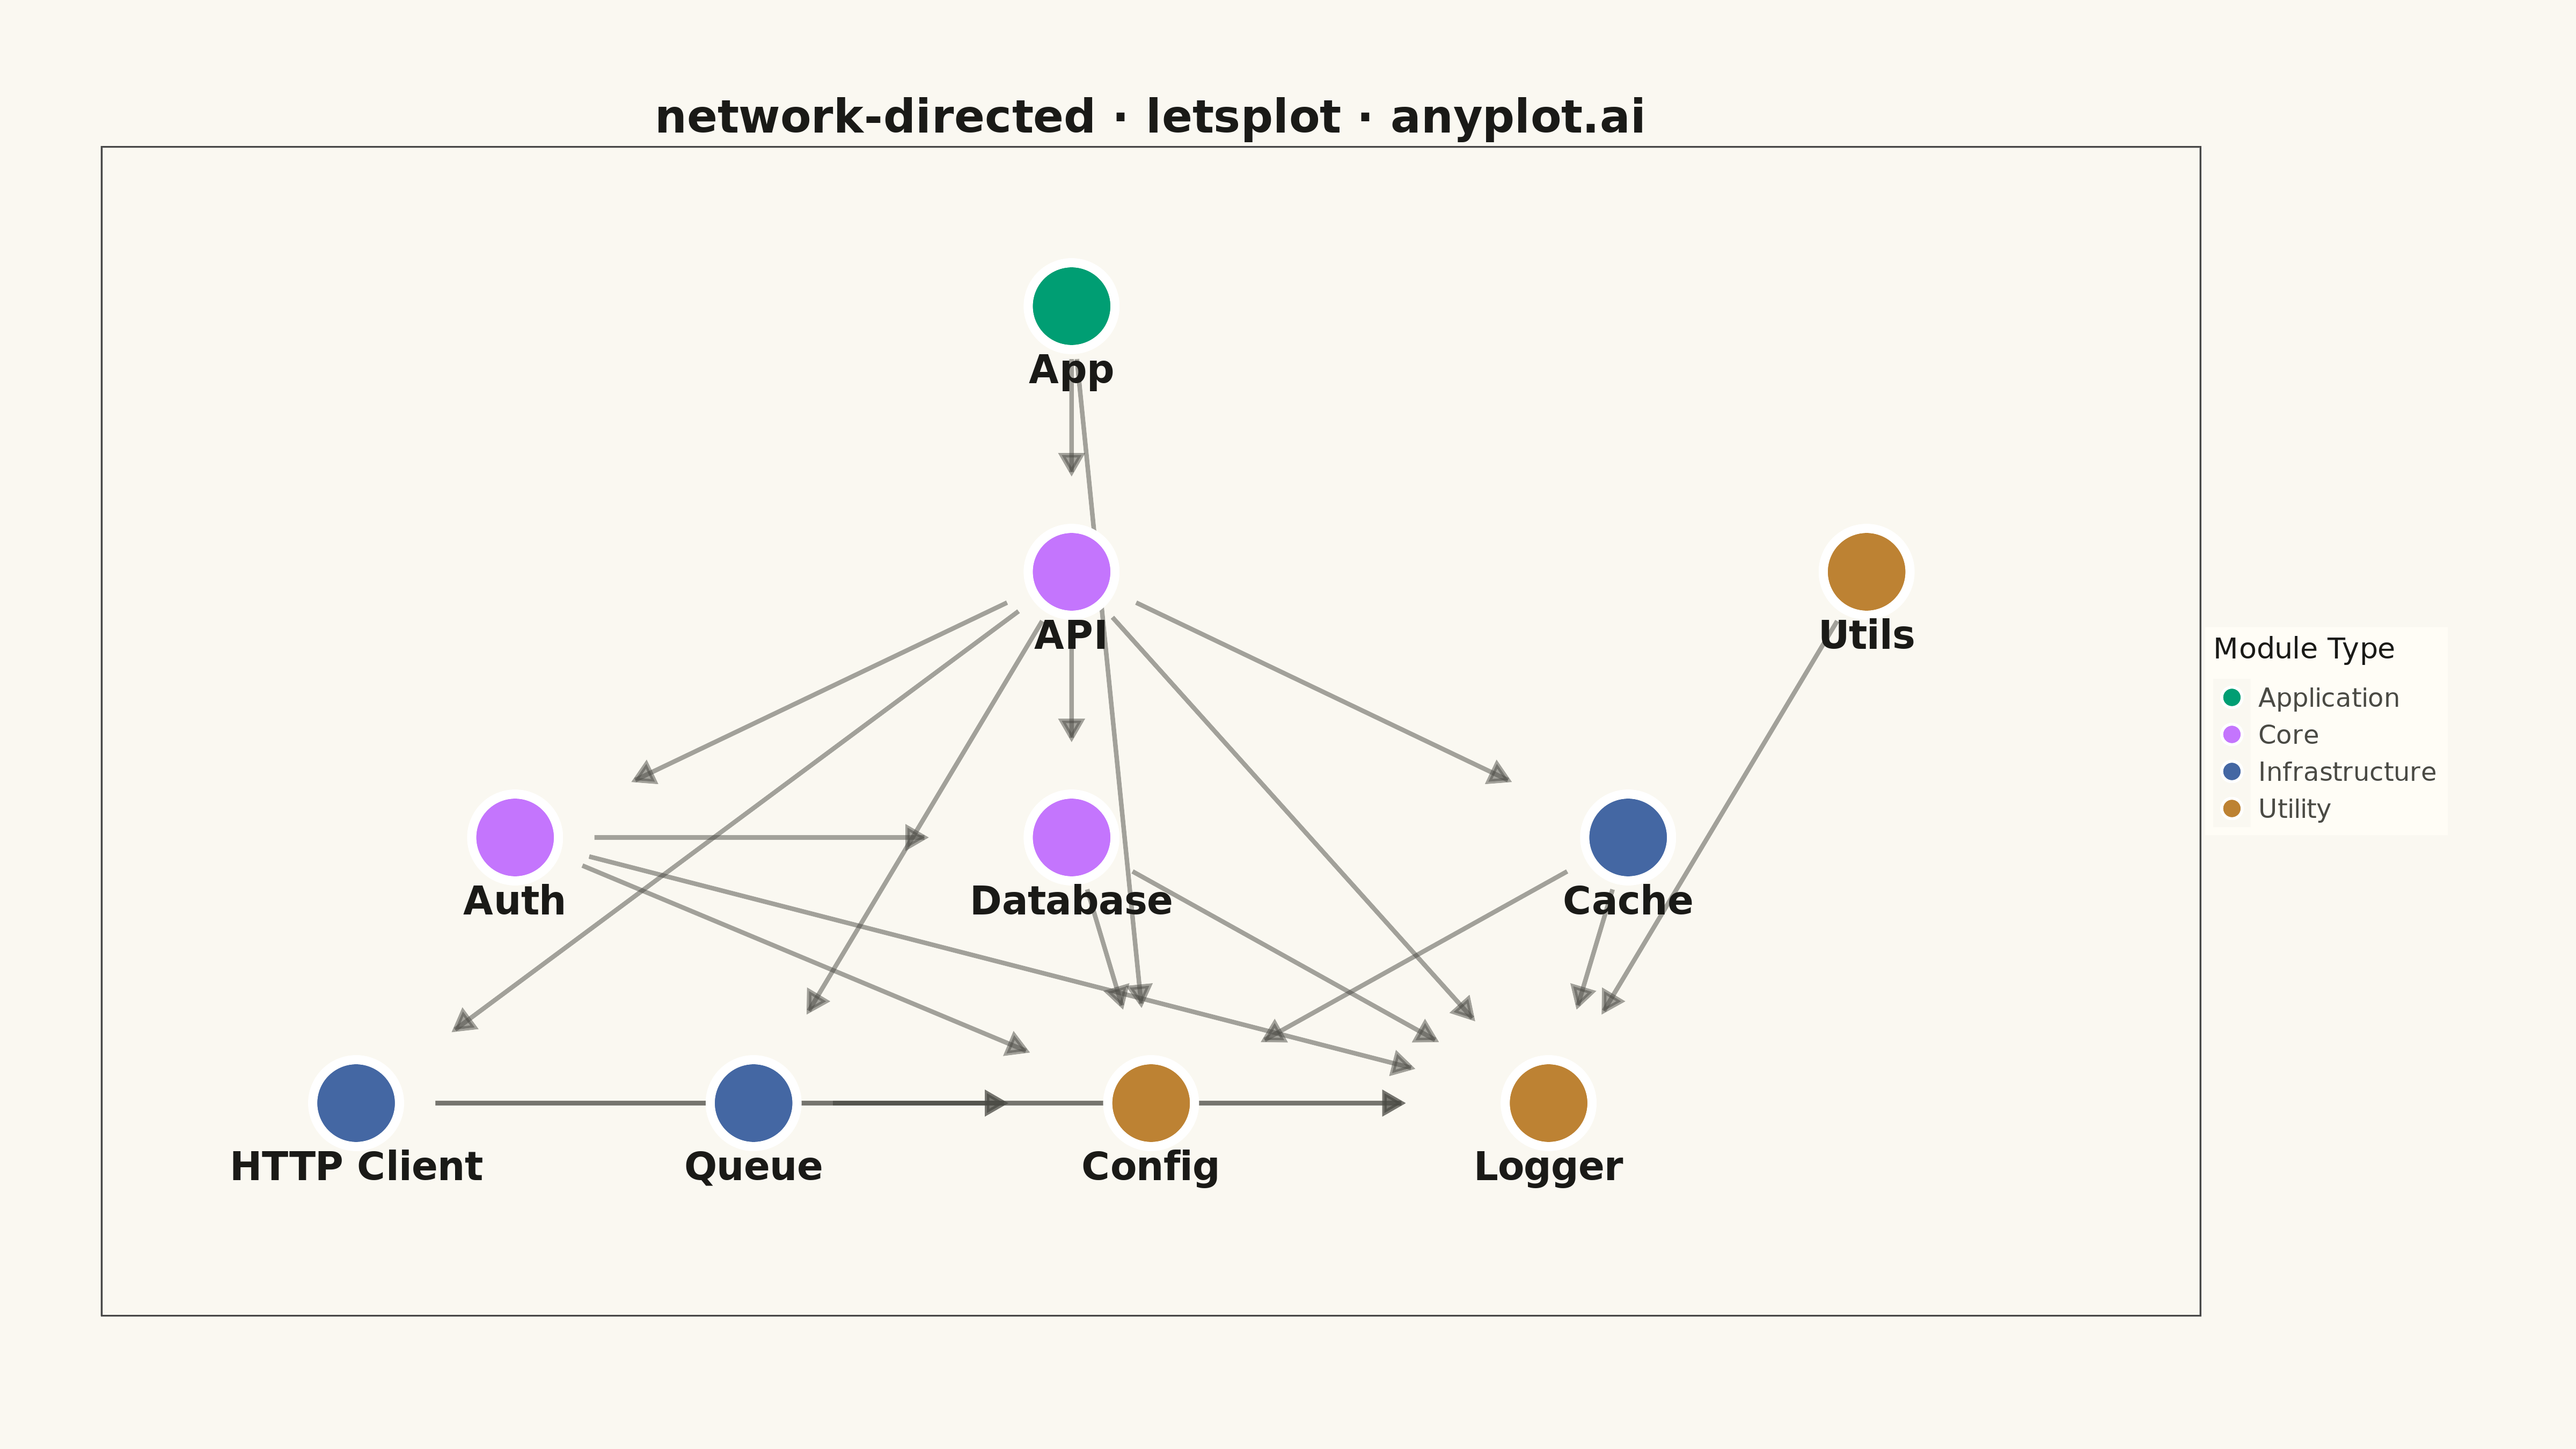
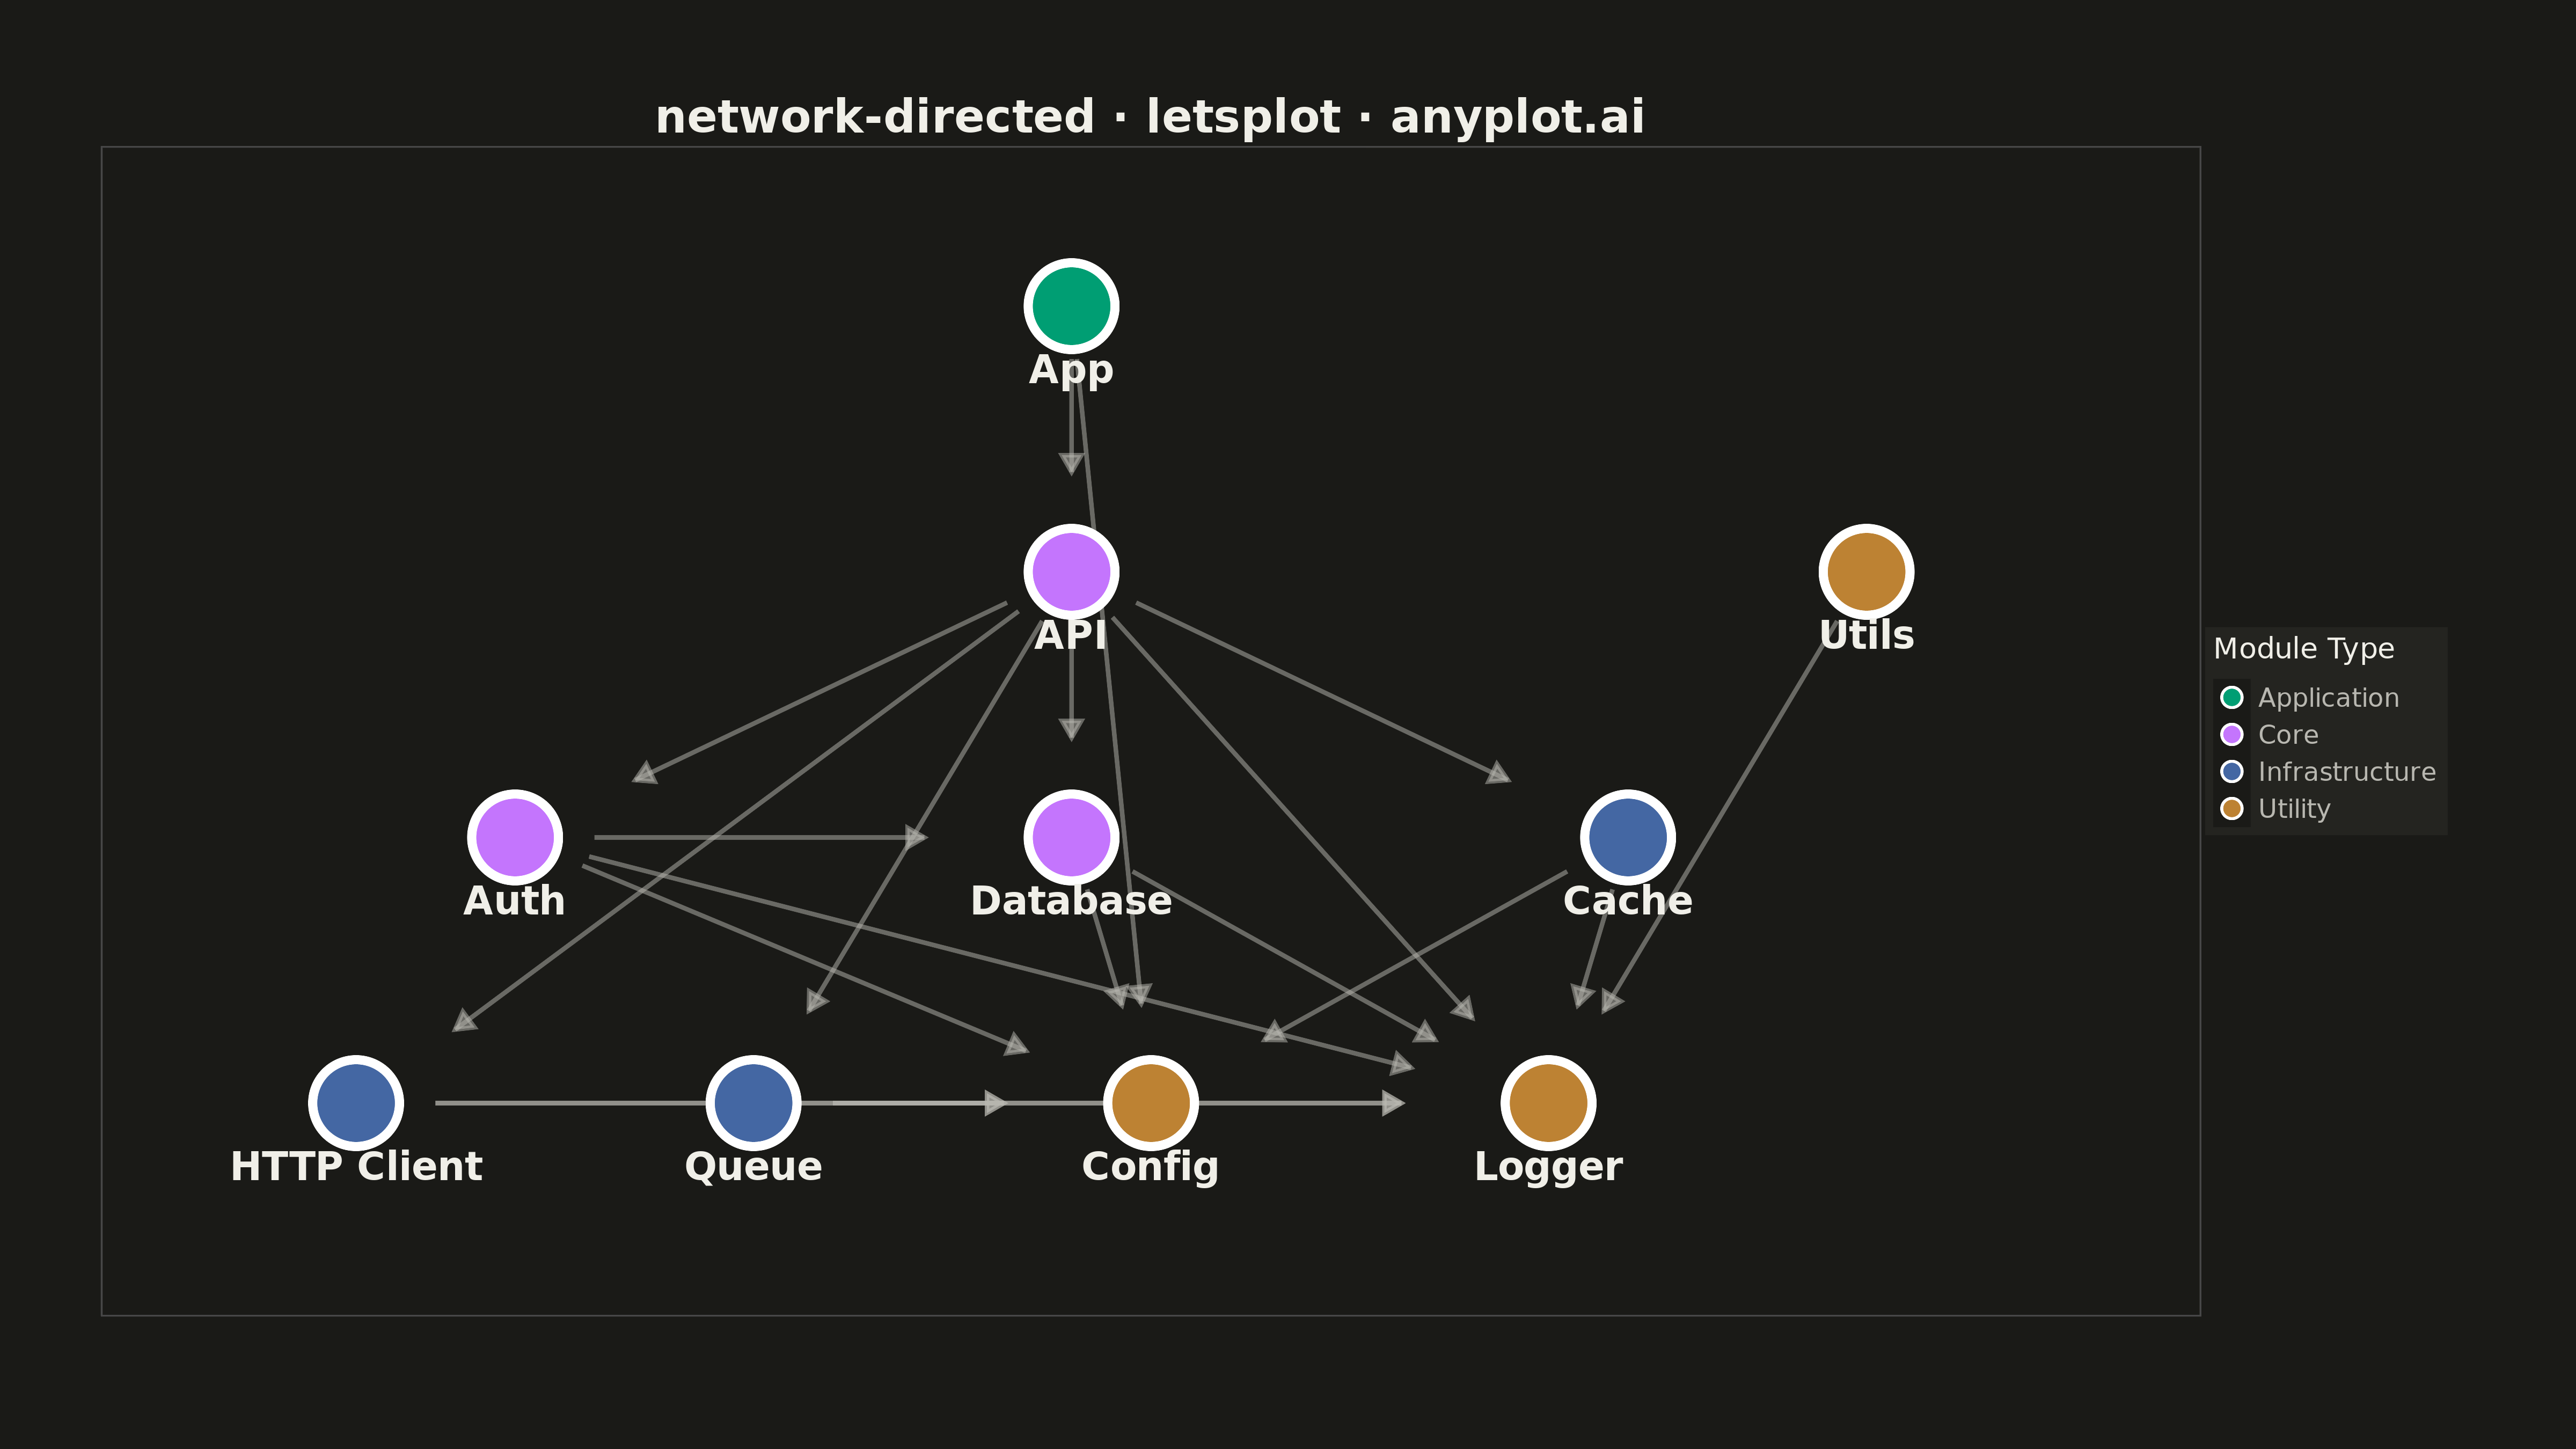
A directed network graph visualizes relationships between entities using nodes connected by edges with arrows, indicating the direction of relationships or flow. Unlike undirected graphs, directed graphs reveal asymmetric relationships such as dependencies, hierarchies, or information flow. The arrows clearly communicate which entity points to which, making cause-and-effect relationships and directional dependencies immediately visible.
""" anyplot.ai
network-directed: Directed Network Graph
Library: letsplot 4.9.0 | Python 3.13.13
Quality: 90/100 | Updated: 2026-05-14
"""

import os
import shutil

import numpy as np
import pandas as pd
from lets_plot import (
    LetsPlot,
    aes,
    arrow,
    element_rect,
    element_text,
    geom_point,
    geom_segment,
    geom_text,
    ggplot,
    ggsize,
    labs,
    scale_fill_manual,
    theme,
    theme_void,
    xlim,
    ylim,
)
from lets_plot.export import ggsave


LetsPlot.setup_html()

np.random.seed(42)

# Theme-adaptive colors
THEME = os.getenv("ANYPLOT_THEME", "light")
PAGE_BG = "#FAF8F1" if THEME == "light" else "#1A1A17"
ELEVATED_BG = "#FFFDF6" if THEME == "light" else "#242420"
INK = "#1A1A17" if THEME == "light" else "#F0EFE8"
INK_SOFT = "#4A4A44" if THEME == "light" else "#B8B7B0"

# Okabe-Ito palette (positions 1-4 for node groups)
IMPRINT = ["#009E73", "#C475FD", "#4467A3", "#BD8233"]

# Define software package dependency network
nodes = [
    {"id": "app", "label": "App", "group": "Application"},
    {"id": "api", "label": "API", "group": "Core"},
    {"id": "auth", "label": "Auth", "group": "Core"},
    {"id": "db", "label": "Database", "group": "Core"},
    {"id": "cache", "label": "Cache", "group": "Infrastructure"},
    {"id": "config", "label": "Config", "group": "Utility"},
    {"id": "logger", "label": "Logger", "group": "Utility"},
    {"id": "utils", "label": "Utils", "group": "Utility"},
    {"id": "http", "label": "HTTP Client", "group": "Infrastructure"},
    {"id": "queue", "label": "Queue", "group": "Infrastructure"},
]

# Directed edges (source depends on target, arrow from source to target)
edges = [
    ("app", "api"),
    ("app", "config"),
    ("api", "auth"),
    ("api", "db"),
    ("api", "cache"),
    ("api", "logger"),
    ("auth", "db"),
    ("auth", "config"),
    ("auth", "logger"),
    ("db", "config"),
    ("db", "logger"),
    ("cache", "config"),
    ("cache", "logger"),
    ("http", "config"),
    ("http", "logger"),
    ("queue", "config"),
    ("queue", "logger"),
    ("api", "http"),
    ("api", "queue"),
    ("utils", "logger"),
]

# Create node positions using hierarchical layout
node_positions = {
    "app": (0.5, 1.0),
    "api": (0.5, 0.75),
    "auth": (0.15, 0.5),
    "db": (0.5, 0.5),
    "cache": (0.85, 0.5),
    "http": (0.05, 0.25),
    "queue": (0.3, 0.25),
    "config": (0.55, 0.25),
    "logger": (0.8, 0.25),
    "utils": (1.0, 0.75),
}

# Build node dataframe
node_df = pd.DataFrame(nodes)
node_df["x"] = node_df["id"].map(lambda n: node_positions[n][0])
node_df["y"] = node_df["id"].map(lambda n: node_positions[n][1])

# Map groups to Okabe-Ito colors
group_order = ["Application", "Core", "Infrastructure", "Utility"]
group_colors = {group: IMPRINT[i] for i, group in enumerate(group_order)}
node_df["color"] = node_df["group"].map(group_colors)

# Build edge dataframe with arrow endpoints
edge_data = []
for source, target in edges:
    x0, y0 = node_positions[source]
    x1, y1 = node_positions[target]

    # Shorten edges to not overlap with nodes
    dx, dy = x1 - x0, y1 - y0
    length = np.sqrt(dx**2 + dy**2)
    if length > 0:
        # Shrink by node radius on each end
        shrink = 0.05
        x0_adj = x0 + (dx / length) * shrink
        y0_adj = y0 + (dy / length) * shrink
        x1_adj = x1 - (dx / length) * shrink * 1.8
        y1_adj = y1 - (dy / length) * shrink * 1.8
    else:
        x0_adj, y0_adj, x1_adj, y1_adj = x0, y0, x1, y1

    edge_data.append({"x": x0_adj, "y": y0_adj, "xend": x1_adj, "yend": y1_adj})

edge_df = pd.DataFrame(edge_data)

# Create the plot
plot = (
    ggplot()
    # Draw edges with arrows
    + geom_segment(
        aes(x="x", y="y", xend="xend", yend="yend"),
        data=edge_df,
        color=INK_SOFT,
        size=1.2,
        arrow=arrow(length=12, type="closed"),
        alpha=0.5,
    )
    # Draw nodes
    + geom_point(aes(x="x", y="y", fill="group"), data=node_df, size=22, shape=21, stroke=2.5, color="white")
    # Add node labels
    + geom_text(aes(x="x", y="y", label="label"), data=node_df, size=12, color=INK, fontface="bold", nudge_y=-0.06)
    # Color scale
    + scale_fill_manual(values=IMPRINT, name="Module Type")
    # Theme and styling
    + theme_void()
    + theme(
        plot_background=element_rect(fill=PAGE_BG, color=PAGE_BG),
        panel_background=element_rect(fill=PAGE_BG),
        plot_title=element_text(size=28, face="bold", hjust=0.5, color=INK),
        legend_background=element_rect(fill=ELEVATED_BG, color=INK_SOFT),
        legend_title=element_text(size=18, color=INK),
        legend_text=element_text(size=16, color=INK_SOFT),
        legend_position="right",
        plot_margin=[60, 80, 80, 60],
    )
    + labs(title="network-directed · letsplot · anyplot.ai")
    + ggsize(1600, 900)
    + xlim(-0.05, 1.15)
    + ylim(0.1, 1.1)
)

# Save as PNG and HTML
ggsave(plot, f"plot-{THEME}.png", scale=3)
ggsave(plot, f"plot-{THEME}.html")

# Move files from lets-plot-images subdirectory to current directory
if os.path.exists(f"lets-plot-images/plot-{THEME}.png"):
    shutil.move(f"lets-plot-images/plot-{THEME}.png", f"plot-{THEME}.png")
if os.path.exists(f"lets-plot-images/plot-{THEME}.html"):
    shutil.move(f"lets-plot-images/plot-{THEME}.html", f"plot-{THEME}.html")
if os.path.exists("lets-plot-images") and not os.listdir("lets-plot-images"):
    os.rmdir("lets-plot-images")
Runnable source as JSON, for any HTTP client: https://api.anyplot.ai/specs/network-directed/letsplot/code. Any spec id and library id listed in llms-full.txt fit the same URL shape; every URL below is complete and callable.
{
  "spec_id": "network-directed",
  "language": "python",
  "library": "letsplot",
  "page": "https://anyplot.ai/network-directed/python/letsplot",
  "hub": "https://anyplot.ai/network-directed",
  "code_json": "https://api.anyplot.ai/specs/network-directed/letsplot/code",
  "spec_json": "https://api.anyplot.ai/specs/network-directed",
  "render_light_png": "https://storage.googleapis.com/anyplot-images/plots/network-directed/python/letsplot/plot-light.png",
  "render_dark_png": "https://storage.googleapis.com/anyplot-images/plots/network-directed/python/letsplot/plot-dark.png",
  "interactive_light_html": "https://storage.googleapis.com/anyplot-images/plots/network-directed/python/letsplot/plot-light.html",
  "interactive_dark_html": "https://storage.googleapis.com/anyplot-images/plots/network-directed/python/letsplot/plot-dark.html",
  "quality_score": 90.0,
  "license": "MIT",
  "guide": "https://anyplot.ai/llms.txt"
}
Part of Directed Network Graph on anyplot.ai.