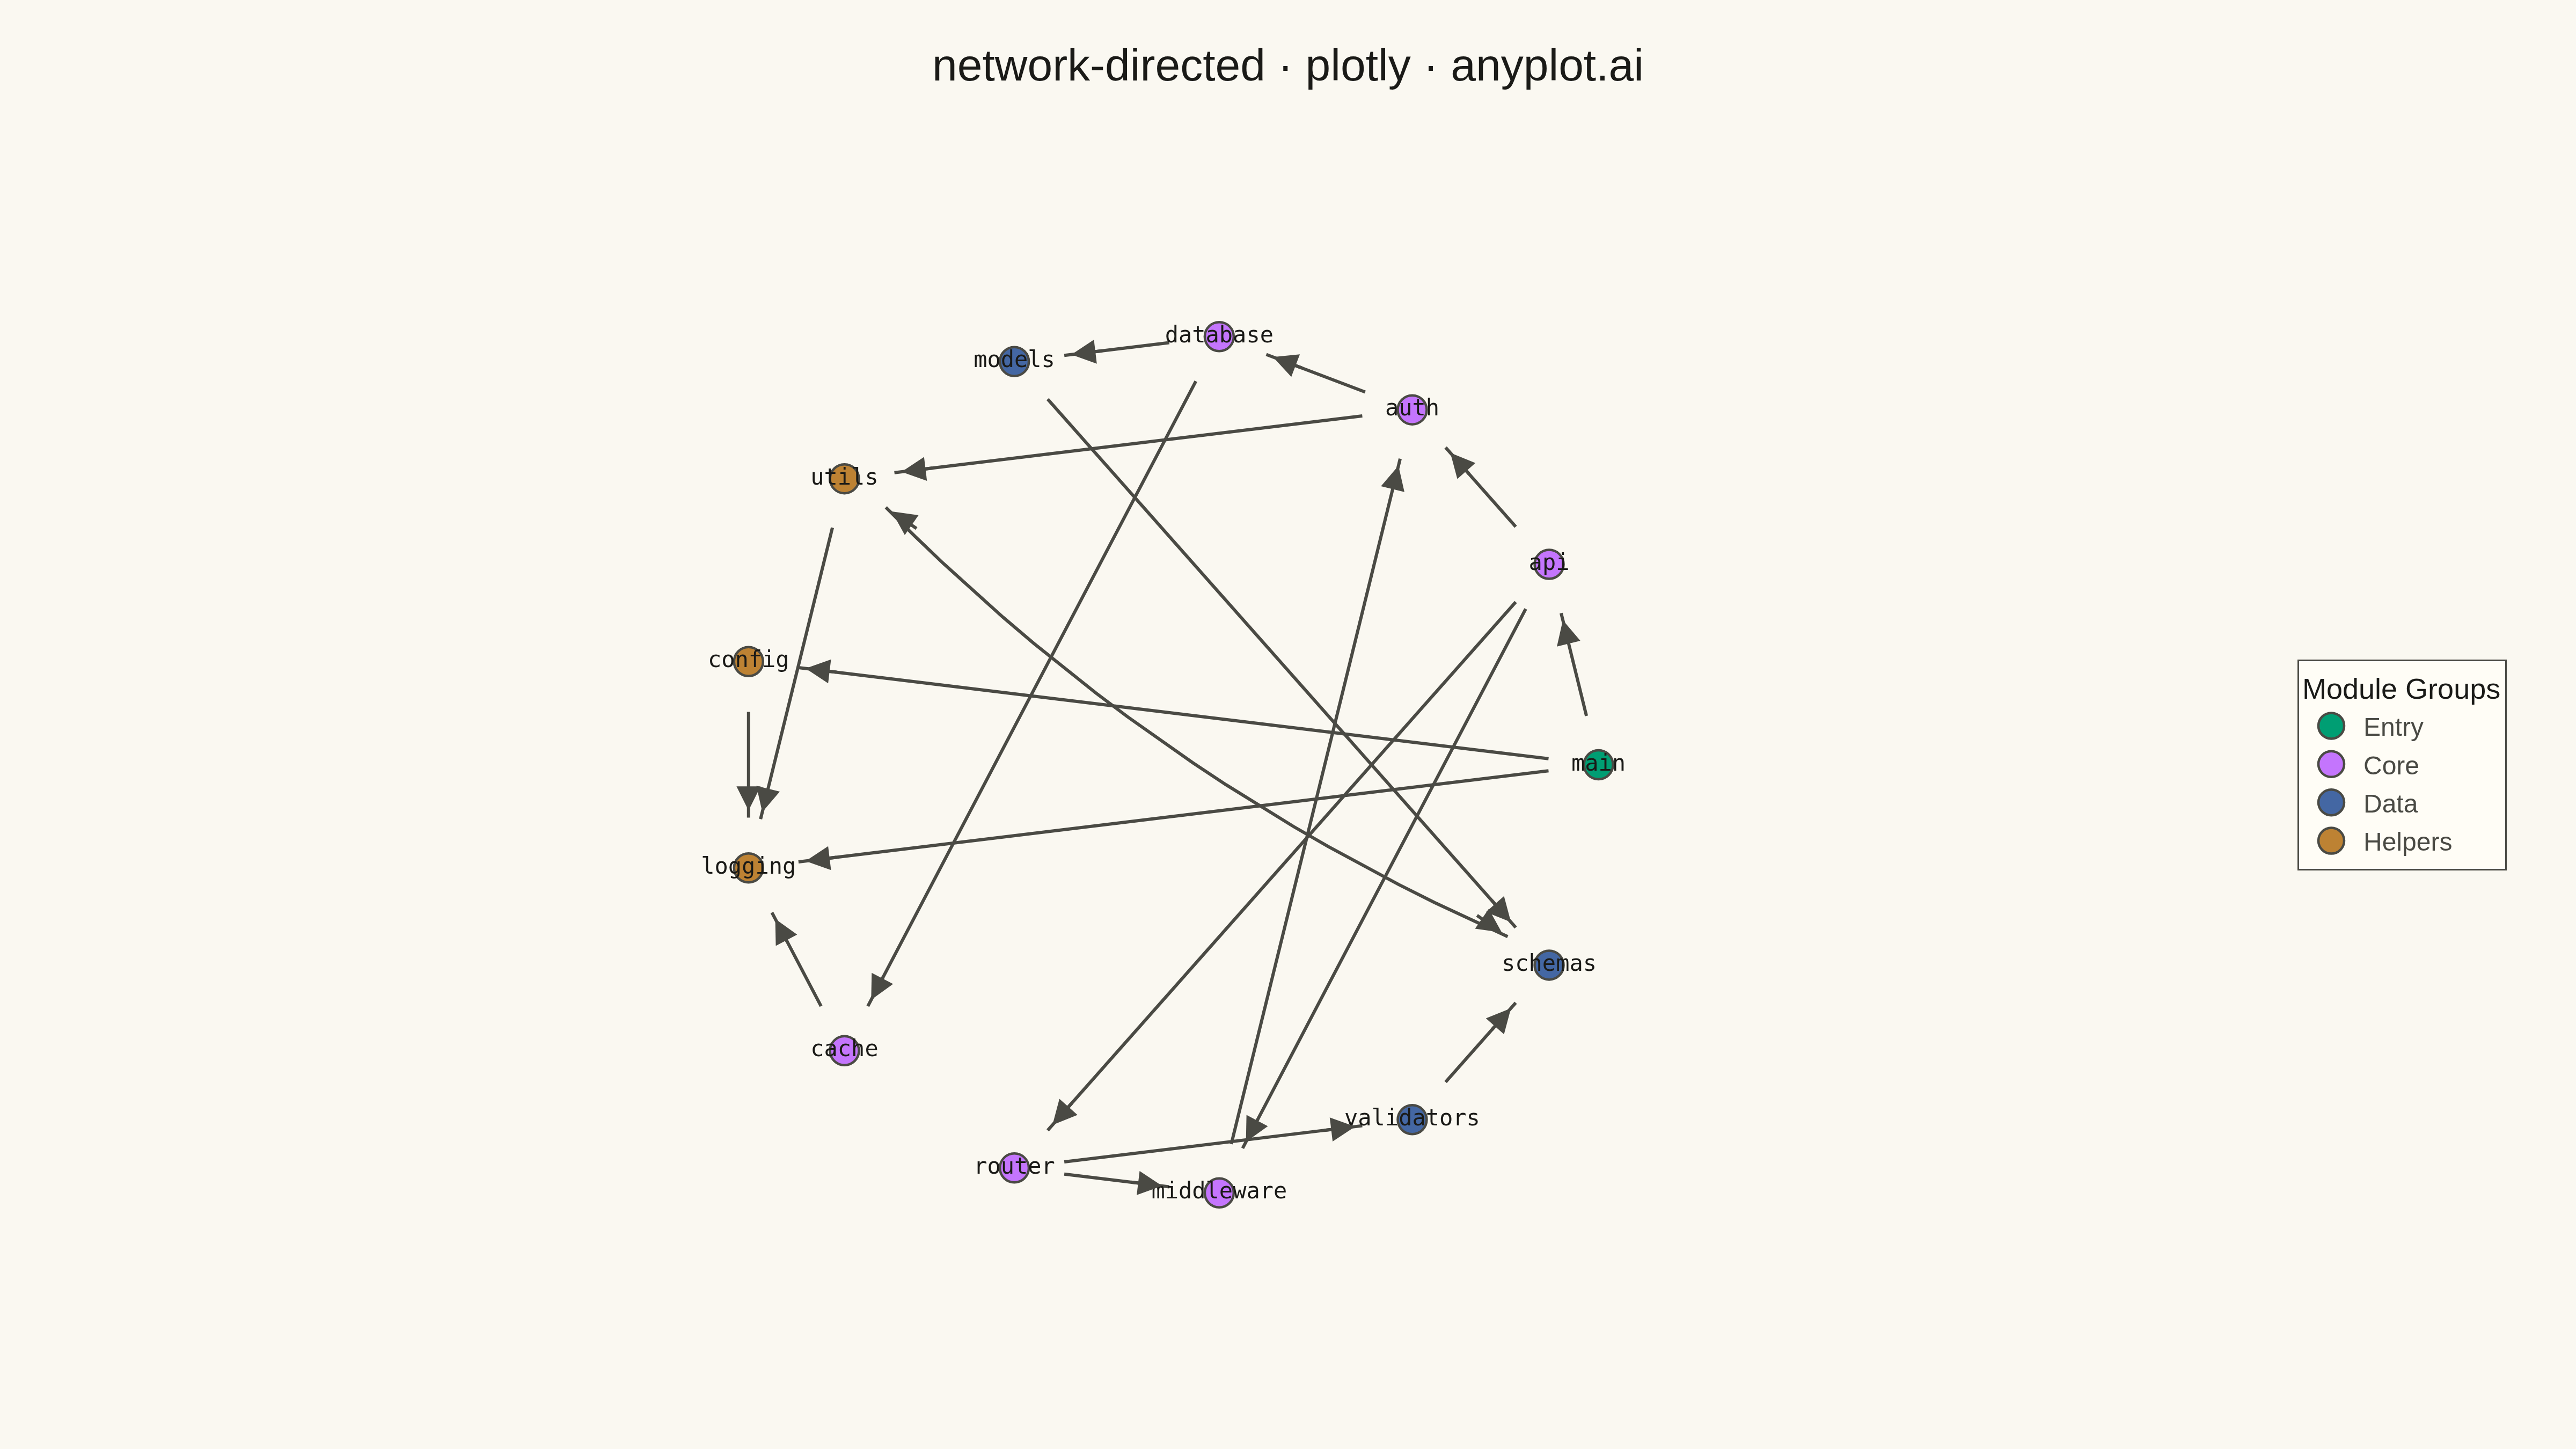
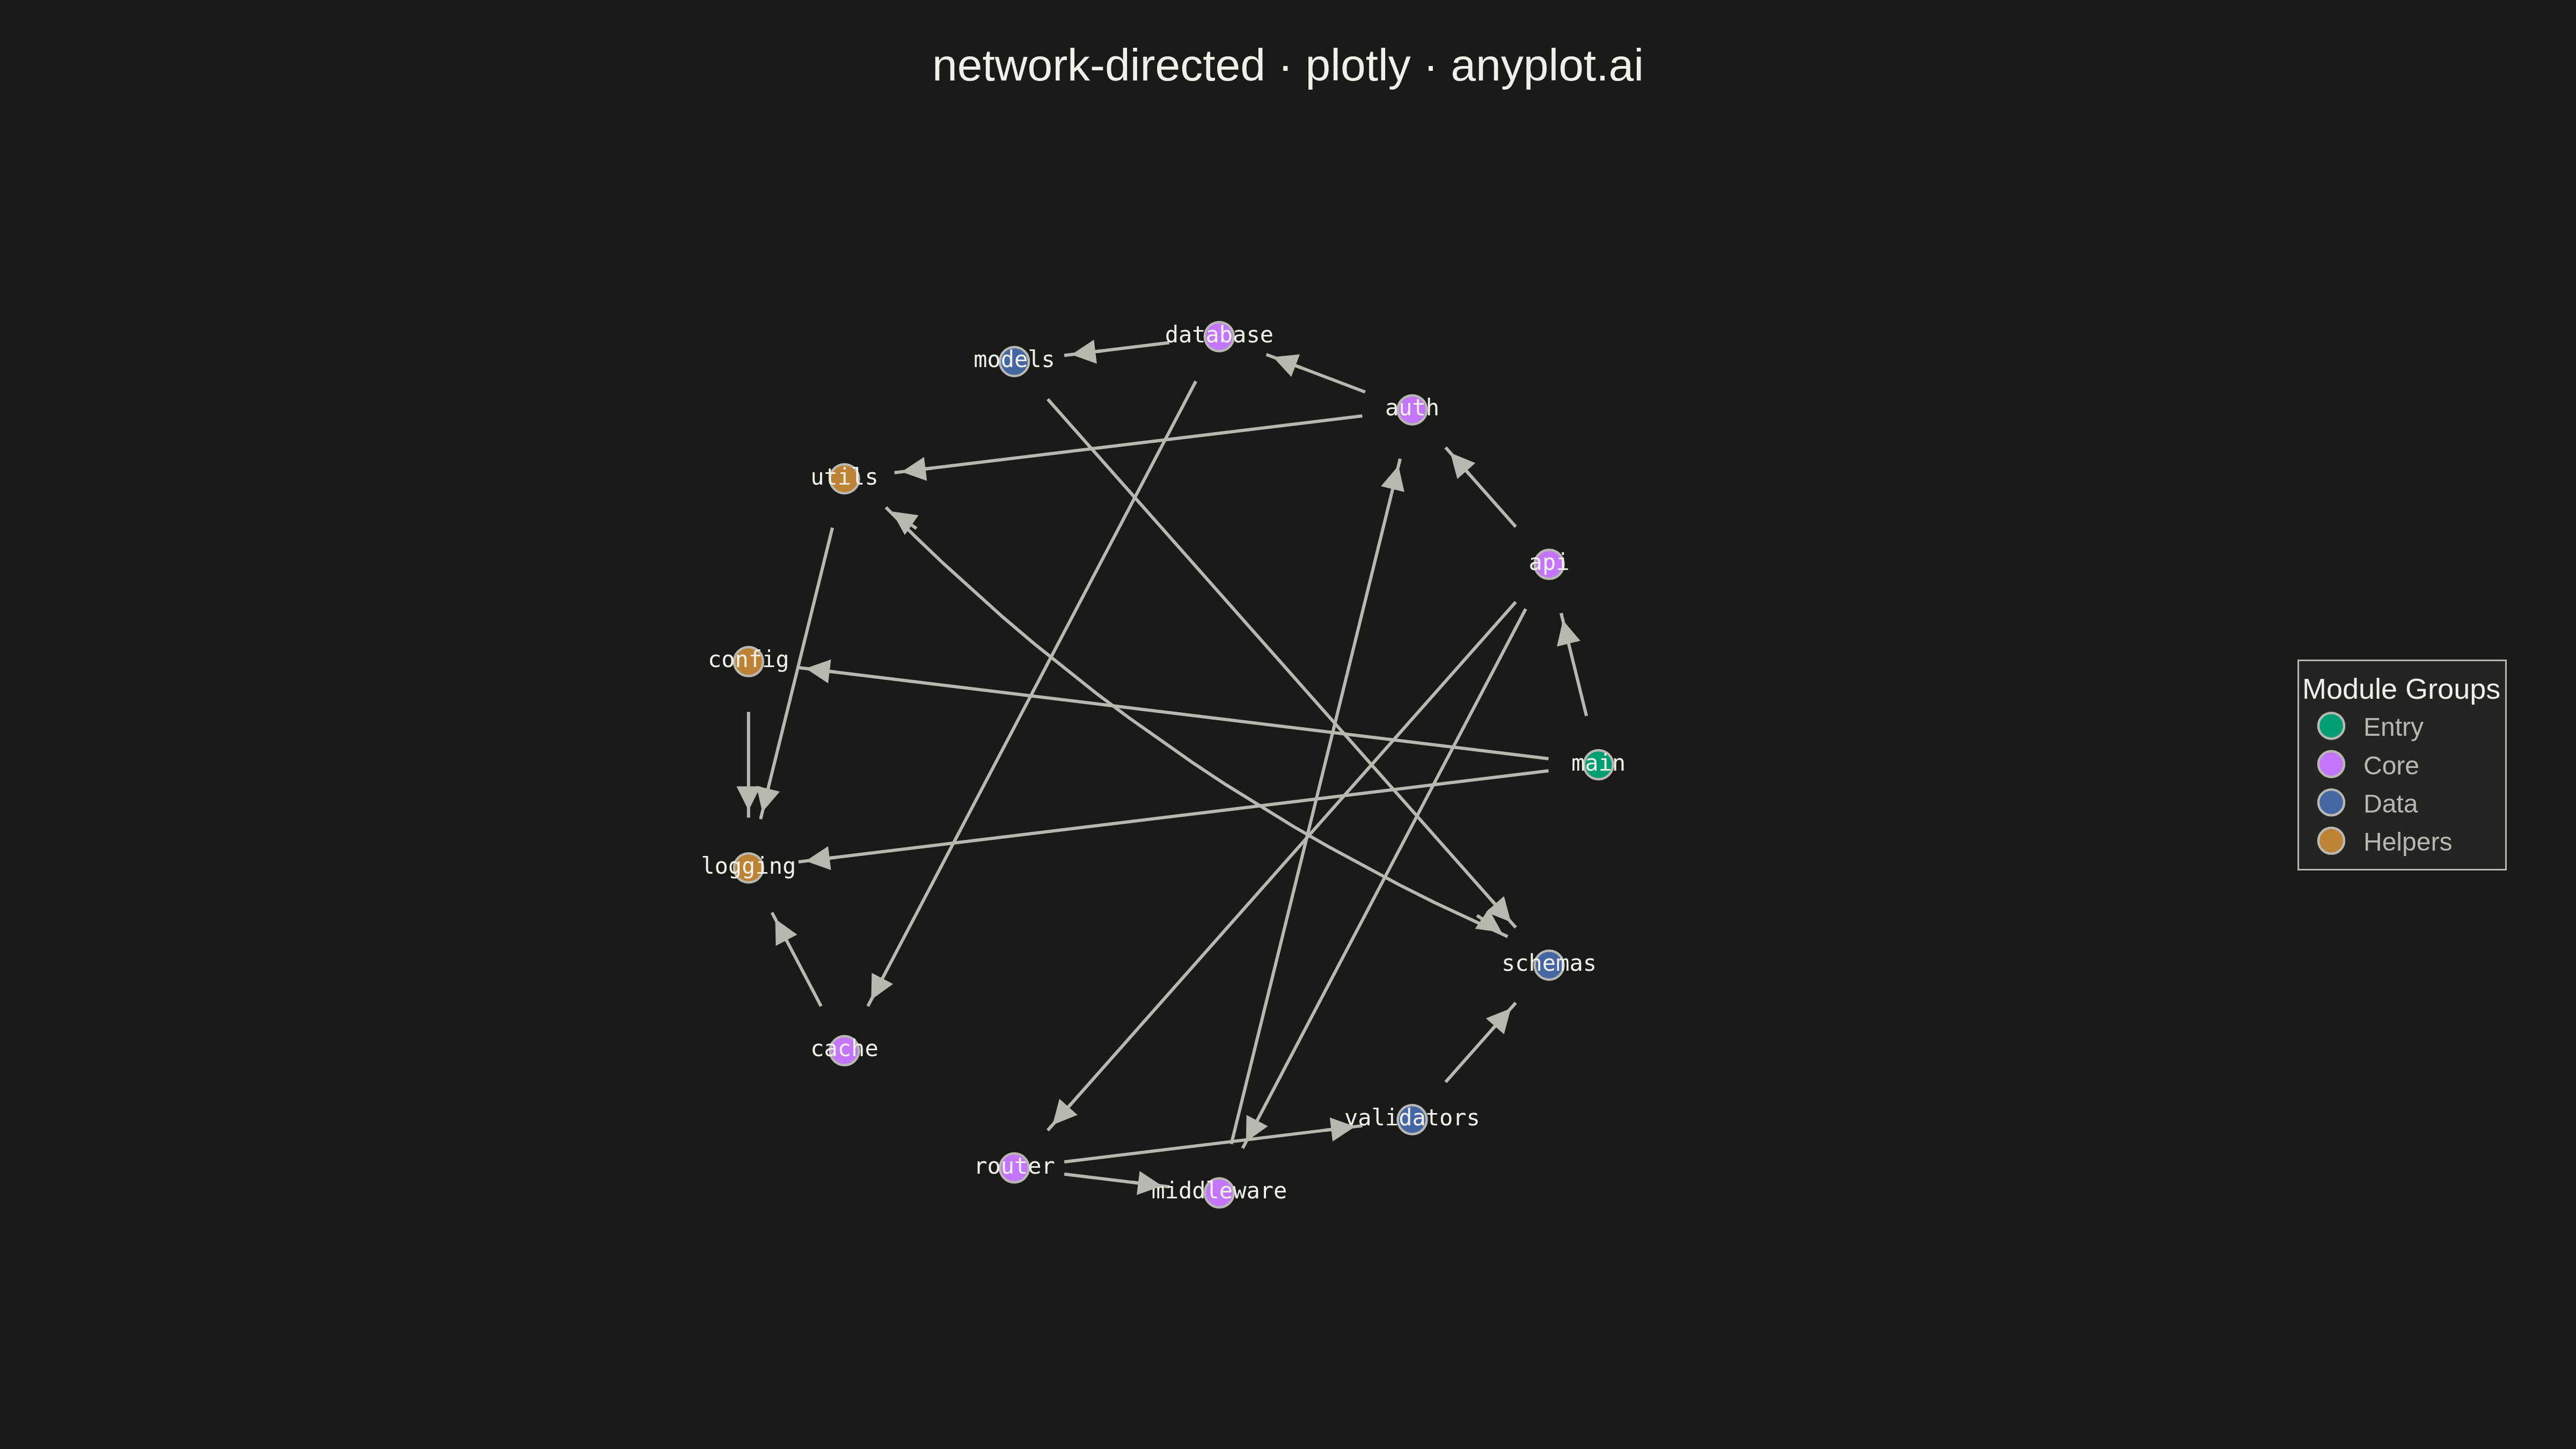
A directed network graph visualizes relationships between entities using nodes connected by edges with arrows, indicating the direction of relationships or flow. Unlike undirected graphs, directed graphs reveal asymmetric relationships such as dependencies, hierarchies, or information flow. The arrows clearly communicate which entity points to which, making cause-and-effect relationships and directional dependencies immediately visible.
""" anyplot.ai
network-directed: Directed Network Graph
Library: plotly 6.7.0 | Python 3.13.13
Quality: 91/100 | Updated: 2026-05-14
"""

import os

import numpy as np
import plotly.graph_objects as go


# Theme tokens
THEME = os.getenv("ANYPLOT_THEME", "light")
PAGE_BG = "#FAF8F1" if THEME == "light" else "#1A1A17"
ELEVATED_BG = "#FFFDF6" if THEME == "light" else "#242420"
INK = "#1A1A17" if THEME == "light" else "#F0EFE8"
INK_SOFT = "#4A4A44" if THEME == "light" else "#B8B7B0"
GRID = "rgba(26,26,23,0.10)" if THEME == "light" else "rgba(240,239,232,0.10)"

# Okabe-Ito palette (first series is #009E73)
IMPRINT = [
    "#009E73",  # Brand green (entry point)
    "#C475FD",  # Vermillion (core)
    "#4467A3",  # Blue (data)
    "#BD8233",  # Reddish purple (helpers)
]

# Data: Software module dependencies (arrows show import direction)
np.random.seed(42)

nodes = [
    {"id": 0, "label": "main", "group": 0},
    {"id": 1, "label": "api", "group": 1},
    {"id": 2, "label": "auth", "group": 1},
    {"id": 3, "label": "database", "group": 1},
    {"id": 4, "label": "models", "group": 2},
    {"id": 5, "label": "utils", "group": 3},
    {"id": 6, "label": "config", "group": 3},
    {"id": 7, "label": "logging", "group": 3},
    {"id": 8, "label": "cache", "group": 1},
    {"id": 9, "label": "router", "group": 1},
    {"id": 10, "label": "middleware", "group": 1},
    {"id": 11, "label": "validators", "group": 2},
    {"id": 12, "label": "schemas", "group": 2},
]

# Directed edges with bidirectional pairs
edges = [
    (0, 1, False),  # main -> api
    (0, 6, False),  # main -> config
    (0, 7, False),  # main -> logging
    (1, 2, False),  # api -> auth
    (1, 9, False),  # api -> router
    (1, 10, False),  # api -> middleware
    (2, 3, False),  # auth -> database
    (2, 5, False),  # auth -> utils
    (3, 4, False),  # database -> models
    (3, 8, False),  # database -> cache
    (4, 12, False),  # models -> schemas
    (5, 7, False),  # utils -> logging
    (6, 7, False),  # config -> logging
    (8, 7, False),  # cache -> logging
    (9, 10, False),  # router -> middleware
    (9, 11, False),  # router -> validators
    (10, 2, False),  # middleware -> auth
    (11, 12, False),  # validators -> schemas
    (12, 5, True),  # schemas <-> utils (bidirectional)
]

# Circular layout
n_nodes = len(nodes)
angles = np.linspace(0, 2 * np.pi, n_nodes, endpoint=False)
radius = 3
node_x = radius * np.cos(angles)
node_y = radius * np.sin(angles)

# Create figure
fig = go.Figure()

# Add edges as lines with arrows
for idx, edge_data in enumerate(edges):
    if len(edge_data) == 3:
        source, target, bidirectional = edge_data
    else:
        source, target = edge_data
        bidirectional = False

    x0, y0 = node_x[source], node_y[source]
    x1, y1 = node_x[target], node_y[target]

    # Calculate direction vector
    dx, dy = x1 - x0, y1 - y0
    length = np.sqrt(dx**2 + dy**2)
    if length > 0:
        dx, dy = dx / length, dy / length

    # Node radius for adjustment
    node_radius = 0.35

    # For bidirectional edges, use curved paths
    if bidirectional:
        # Create a curved path using intermediate points
        # Control point offset for the curve
        perp_x, perp_y = -dy, dx
        offset = 0.5

        # Start and end points adjusted for node radius
        x0_adj = x0 + dx * node_radius
        y0_adj = y0 + dy * node_radius
        x1_adj = x1 - dx * node_radius
        y1_adj = y1 - dy * node_radius

        # Midpoint
        mid_x = (x0_adj + x1_adj) / 2 + perp_x * offset
        mid_y = (y0_adj + y1_adj) / 2 + perp_y * offset

        # Create curved edge
        t = np.linspace(0, 1, 20)
        curve_x = []
        curve_y = []
        for ti in t:
            # Quadratic Bezier curve
            bx = (1 - ti) ** 2 * x0_adj + 2 * (1 - ti) * ti * mid_x + ti**2 * x1_adj
            by = (1 - ti) ** 2 * y0_adj + 2 * (1 - ti) * ti * mid_y + ti**2 * y1_adj
            curve_x.append(bx)
            curve_y.append(by)

        fig.add_trace(
            go.Scatter(
                x=curve_x,
                y=curve_y,
                mode="lines",
                line=dict(width=2, color=INK_SOFT),
                hoverinfo="none",
                showlegend=False,
            )
        )
    else:
        # Straight edge
        x0_adj = x0 + dx * node_radius
        y0_adj = y0 + dy * node_radius
        x1_adj = x1 - dx * node_radius
        y1_adj = y1 - dy * node_radius

        fig.add_trace(
            go.Scatter(
                x=[x0_adj, x1_adj],
                y=[y0_adj, y1_adj],
                mode="lines",
                line=dict(width=2, color=INK_SOFT),
                hoverinfo="none",
                showlegend=False,
            )
        )

# Add arrowheads
for idx, edge_data in enumerate(edges):
    if len(edge_data) == 3:
        source, target, bidirectional = edge_data
    else:
        source, target = edge_data
        bidirectional = False

    x0, y0 = node_x[source], node_y[source]
    x1, y1 = node_x[target], node_y[target]

    dx, dy = x1 - x0, y1 - y0
    length = np.sqrt(dx**2 + dy**2)
    if length > 0:
        dx, dy = dx / length, dy / length

    node_radius = 0.4
    ax = x1 - dx * node_radius
    ay = y1 - dy * node_radius

    fig.add_annotation(
        x=ax,
        y=ay,
        ax=x1 - dx * (node_radius + 0.25),
        ay=y1 - dy * (node_radius + 0.25),
        xref="x",
        yref="y",
        axref="x",
        ayref="y",
        showarrow=True,
        arrowhead=2,
        arrowsize=1.5,
        arrowwidth=2,
        arrowcolor=INK_SOFT,
    )

    # For bidirectional edges, add second arrow in opposite direction
    if bidirectional:
        bx = x0 + dx * node_radius
        by = y0 + dy * node_radius
        fig.add_annotation(
            x=bx,
            y=by,
            ax=x0 + dx * (node_radius + 0.25),
            ay=y0 + dy * (node_radius + 0.25),
            xref="x",
            yref="y",
            axref="x",
            ayref="y",
            showarrow=True,
            arrowhead=2,
            arrowsize=1.5,
            arrowwidth=2,
            arrowcolor=INK_SOFT,
        )

# Add nodes by group
group_names = ["Entry", "Core", "Data", "Helpers"]
for group_idx in range(len(IMPRINT)):
    group_nodes = [n for n in nodes if n["group"] == group_idx]
    group_x = [node_x[n["id"]] for n in group_nodes]
    group_y = [node_y[n["id"]] for n in group_nodes]
    group_labels = [n["label"] for n in group_nodes]

    fig.add_trace(
        go.Scatter(
            x=group_x,
            y=group_y,
            mode="markers+text",
            marker=dict(size=18, color=IMPRINT[group_idx], line=dict(width=1.5, color=INK_SOFT)),
            text=group_labels,
            textposition="middle center",
            textfont=dict(size=14, color=INK, family="monospace"),
            name=group_names[group_idx],
            hovertemplate="<b>%{text}</b><br>Group: " + group_names[group_idx] + "<extra></extra>",
        )
    )

# Update layout
fig.update_layout(
    title=dict(text="network-directed · plotly · anyplot.ai", font=dict(size=28, color=INK), x=0.5, xanchor="center"),
    xaxis=dict(showgrid=False, zeroline=False, showticklabels=False, title="", range=[-4.2, 4.2]),
    yaxis=dict(
        showgrid=False, zeroline=False, showticklabels=False, title="", range=[-4.2, 4.2], scaleanchor="x", scaleratio=1
    ),
    paper_bgcolor=PAGE_BG,
    plot_bgcolor=PAGE_BG,
    showlegend=True,
    legend=dict(
        title=dict(text="Module Groups", font=dict(size=18, color=INK)),
        font=dict(size=16, color=INK_SOFT),
        x=1.02,
        y=0.5,
        yanchor="middle",
        bgcolor=ELEVATED_BG,
        bordercolor=INK_SOFT,
        borderwidth=1,
    ),
    margin=dict(l=50, r=200, t=100, b=50),
    hovermode="closest",
)

# Save outputs
fig.write_image(f"plot-{THEME}.png", width=1600, height=900, scale=3)
fig.write_html(f"plot-{THEME}.html", include_plotlyjs="cdn")
Runnable source as JSON, for any HTTP client: https://api.anyplot.ai/specs/network-directed/plotly/code. Any spec id and library id listed in llms-full.txt fit the same URL shape; every URL below is complete and callable.
{
  "spec_id": "network-directed",
  "language": "python",
  "library": "plotly",
  "page": "https://anyplot.ai/network-directed/python/plotly",
  "hub": "https://anyplot.ai/network-directed",
  "code_json": "https://api.anyplot.ai/specs/network-directed/plotly/code",
  "spec_json": "https://api.anyplot.ai/specs/network-directed",
  "render_light_png": "https://storage.googleapis.com/anyplot-images/plots/network-directed/python/plotly/plot-light.png",
  "render_dark_png": "https://storage.googleapis.com/anyplot-images/plots/network-directed/python/plotly/plot-dark.png",
  "interactive_light_html": "https://storage.googleapis.com/anyplot-images/plots/network-directed/python/plotly/plot-light.html",
  "interactive_dark_html": "https://storage.googleapis.com/anyplot-images/plots/network-directed/python/plotly/plot-dark.html",
  "quality_score": 91.0,
  "license": "MIT",
  "guide": "https://anyplot.ai/llms.txt"
}
Part of Directed Network Graph on anyplot.ai.