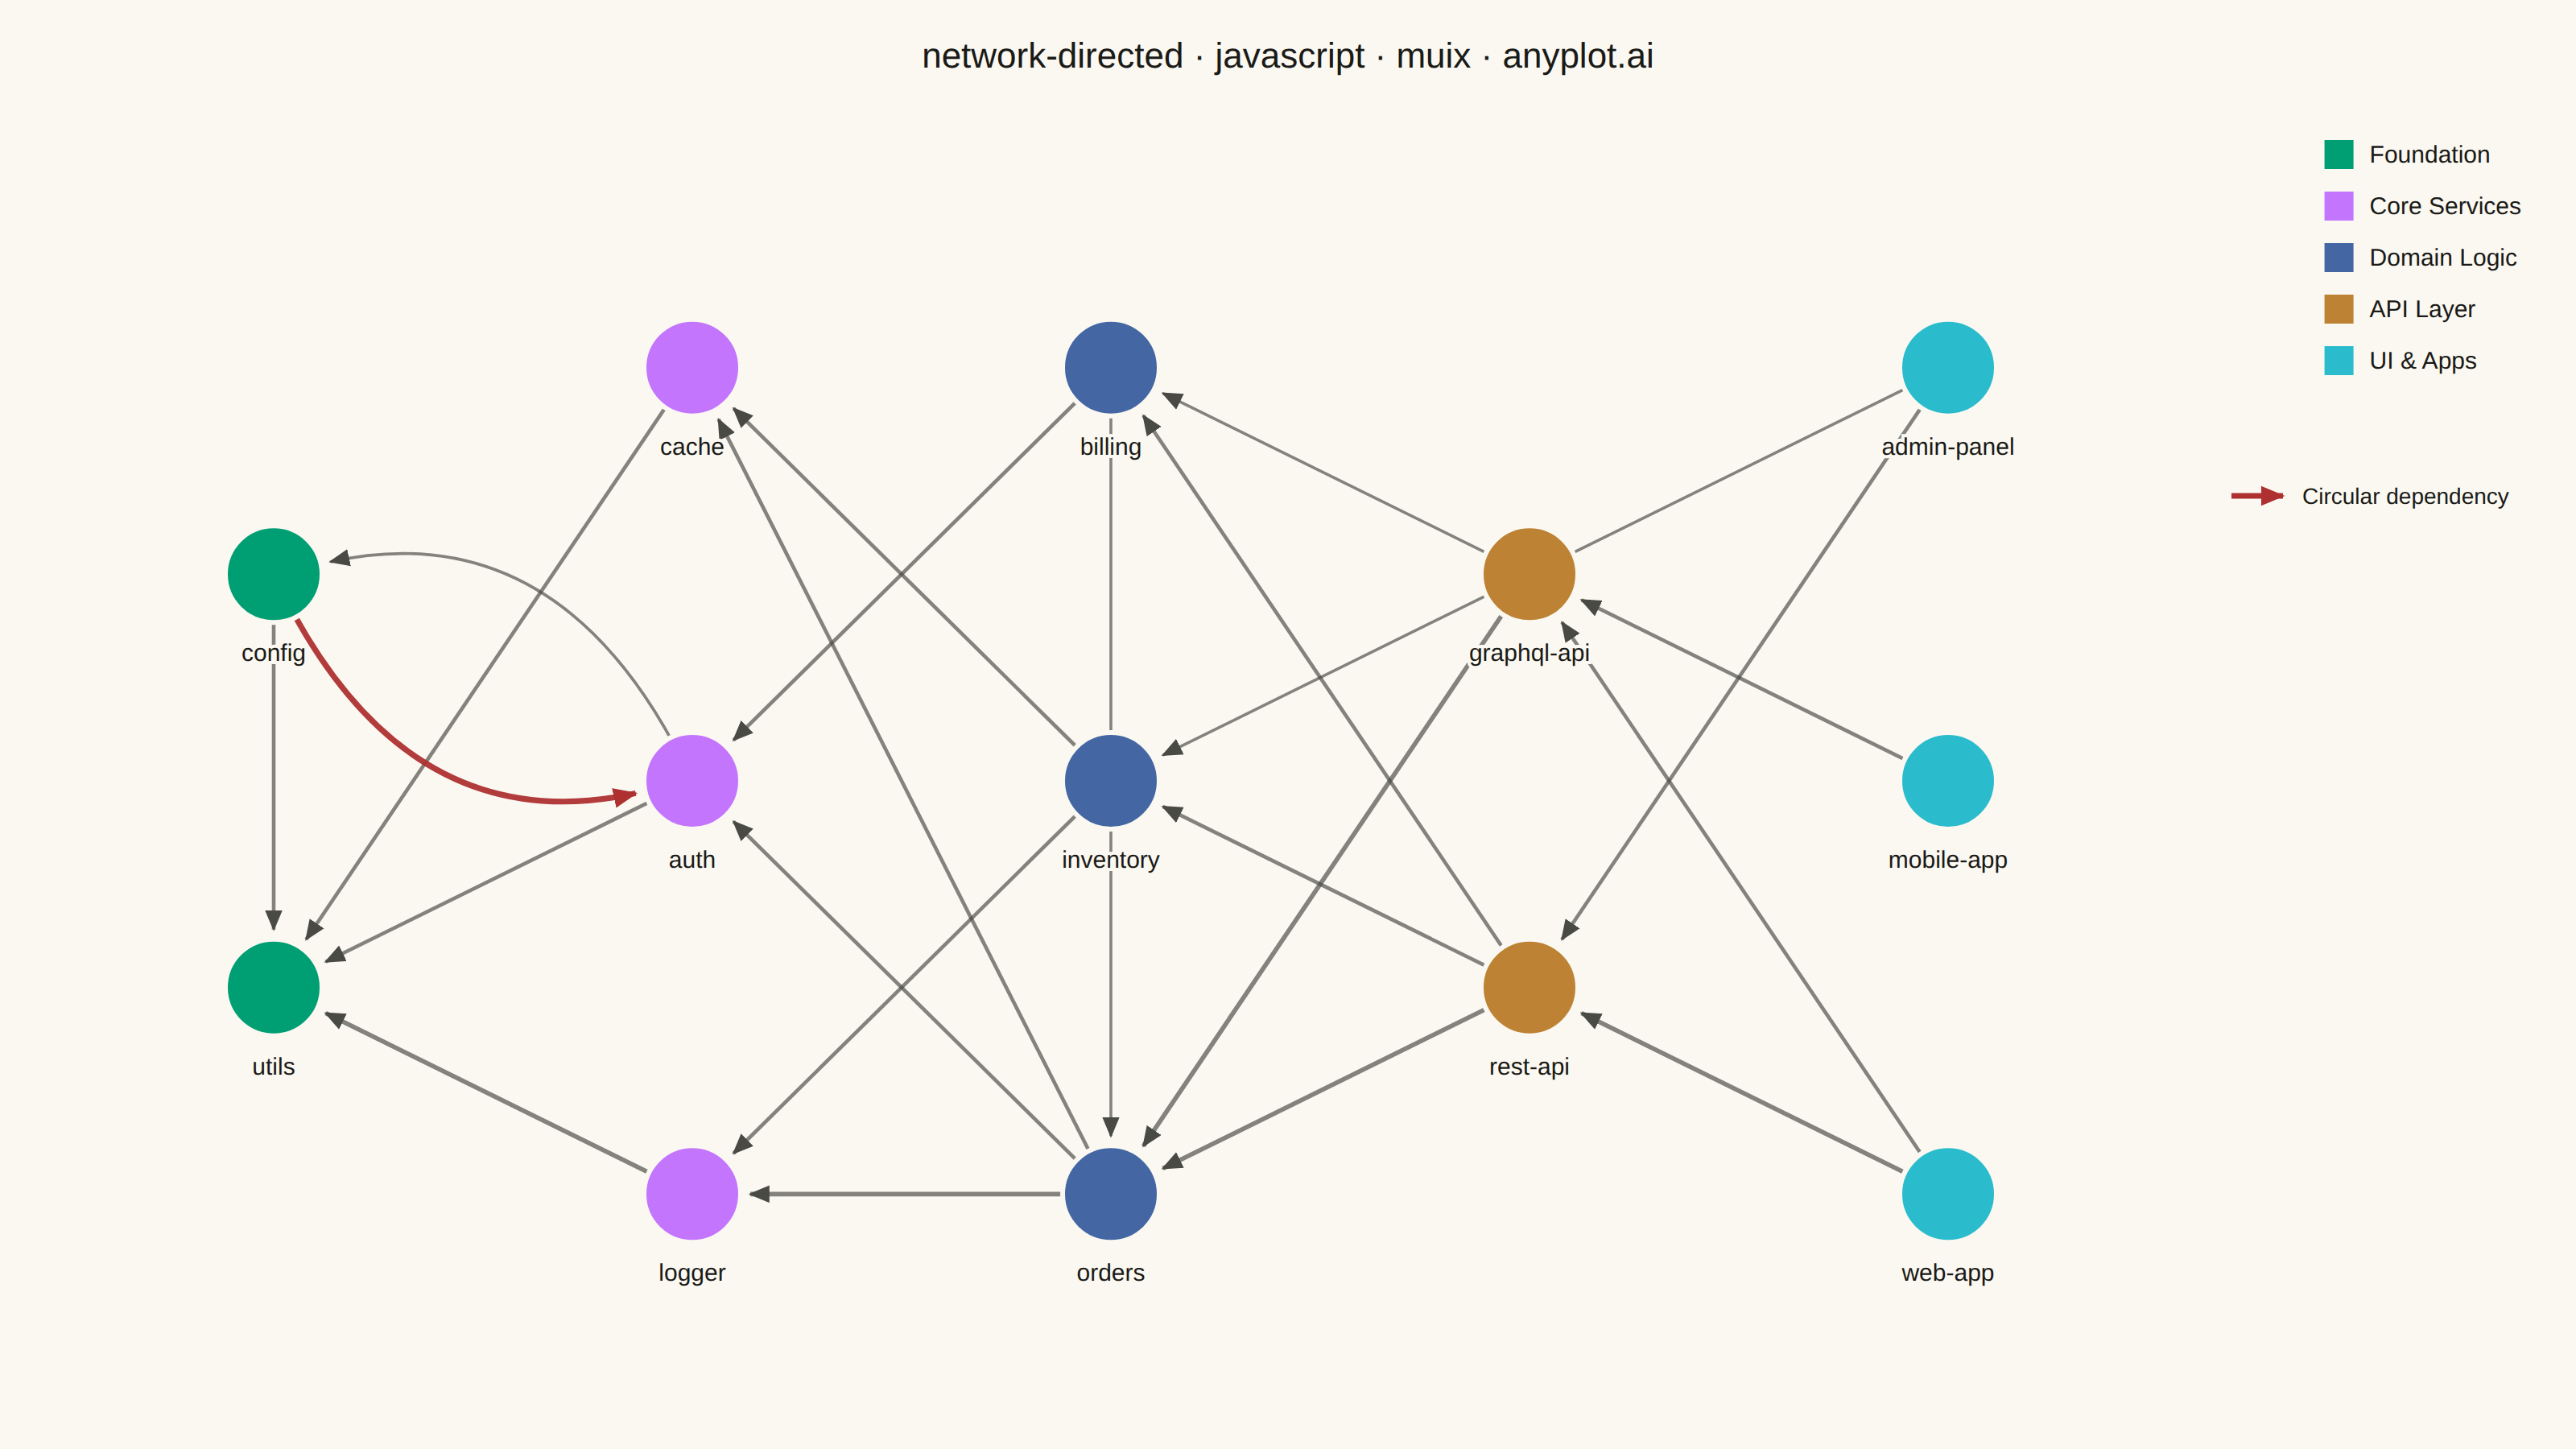
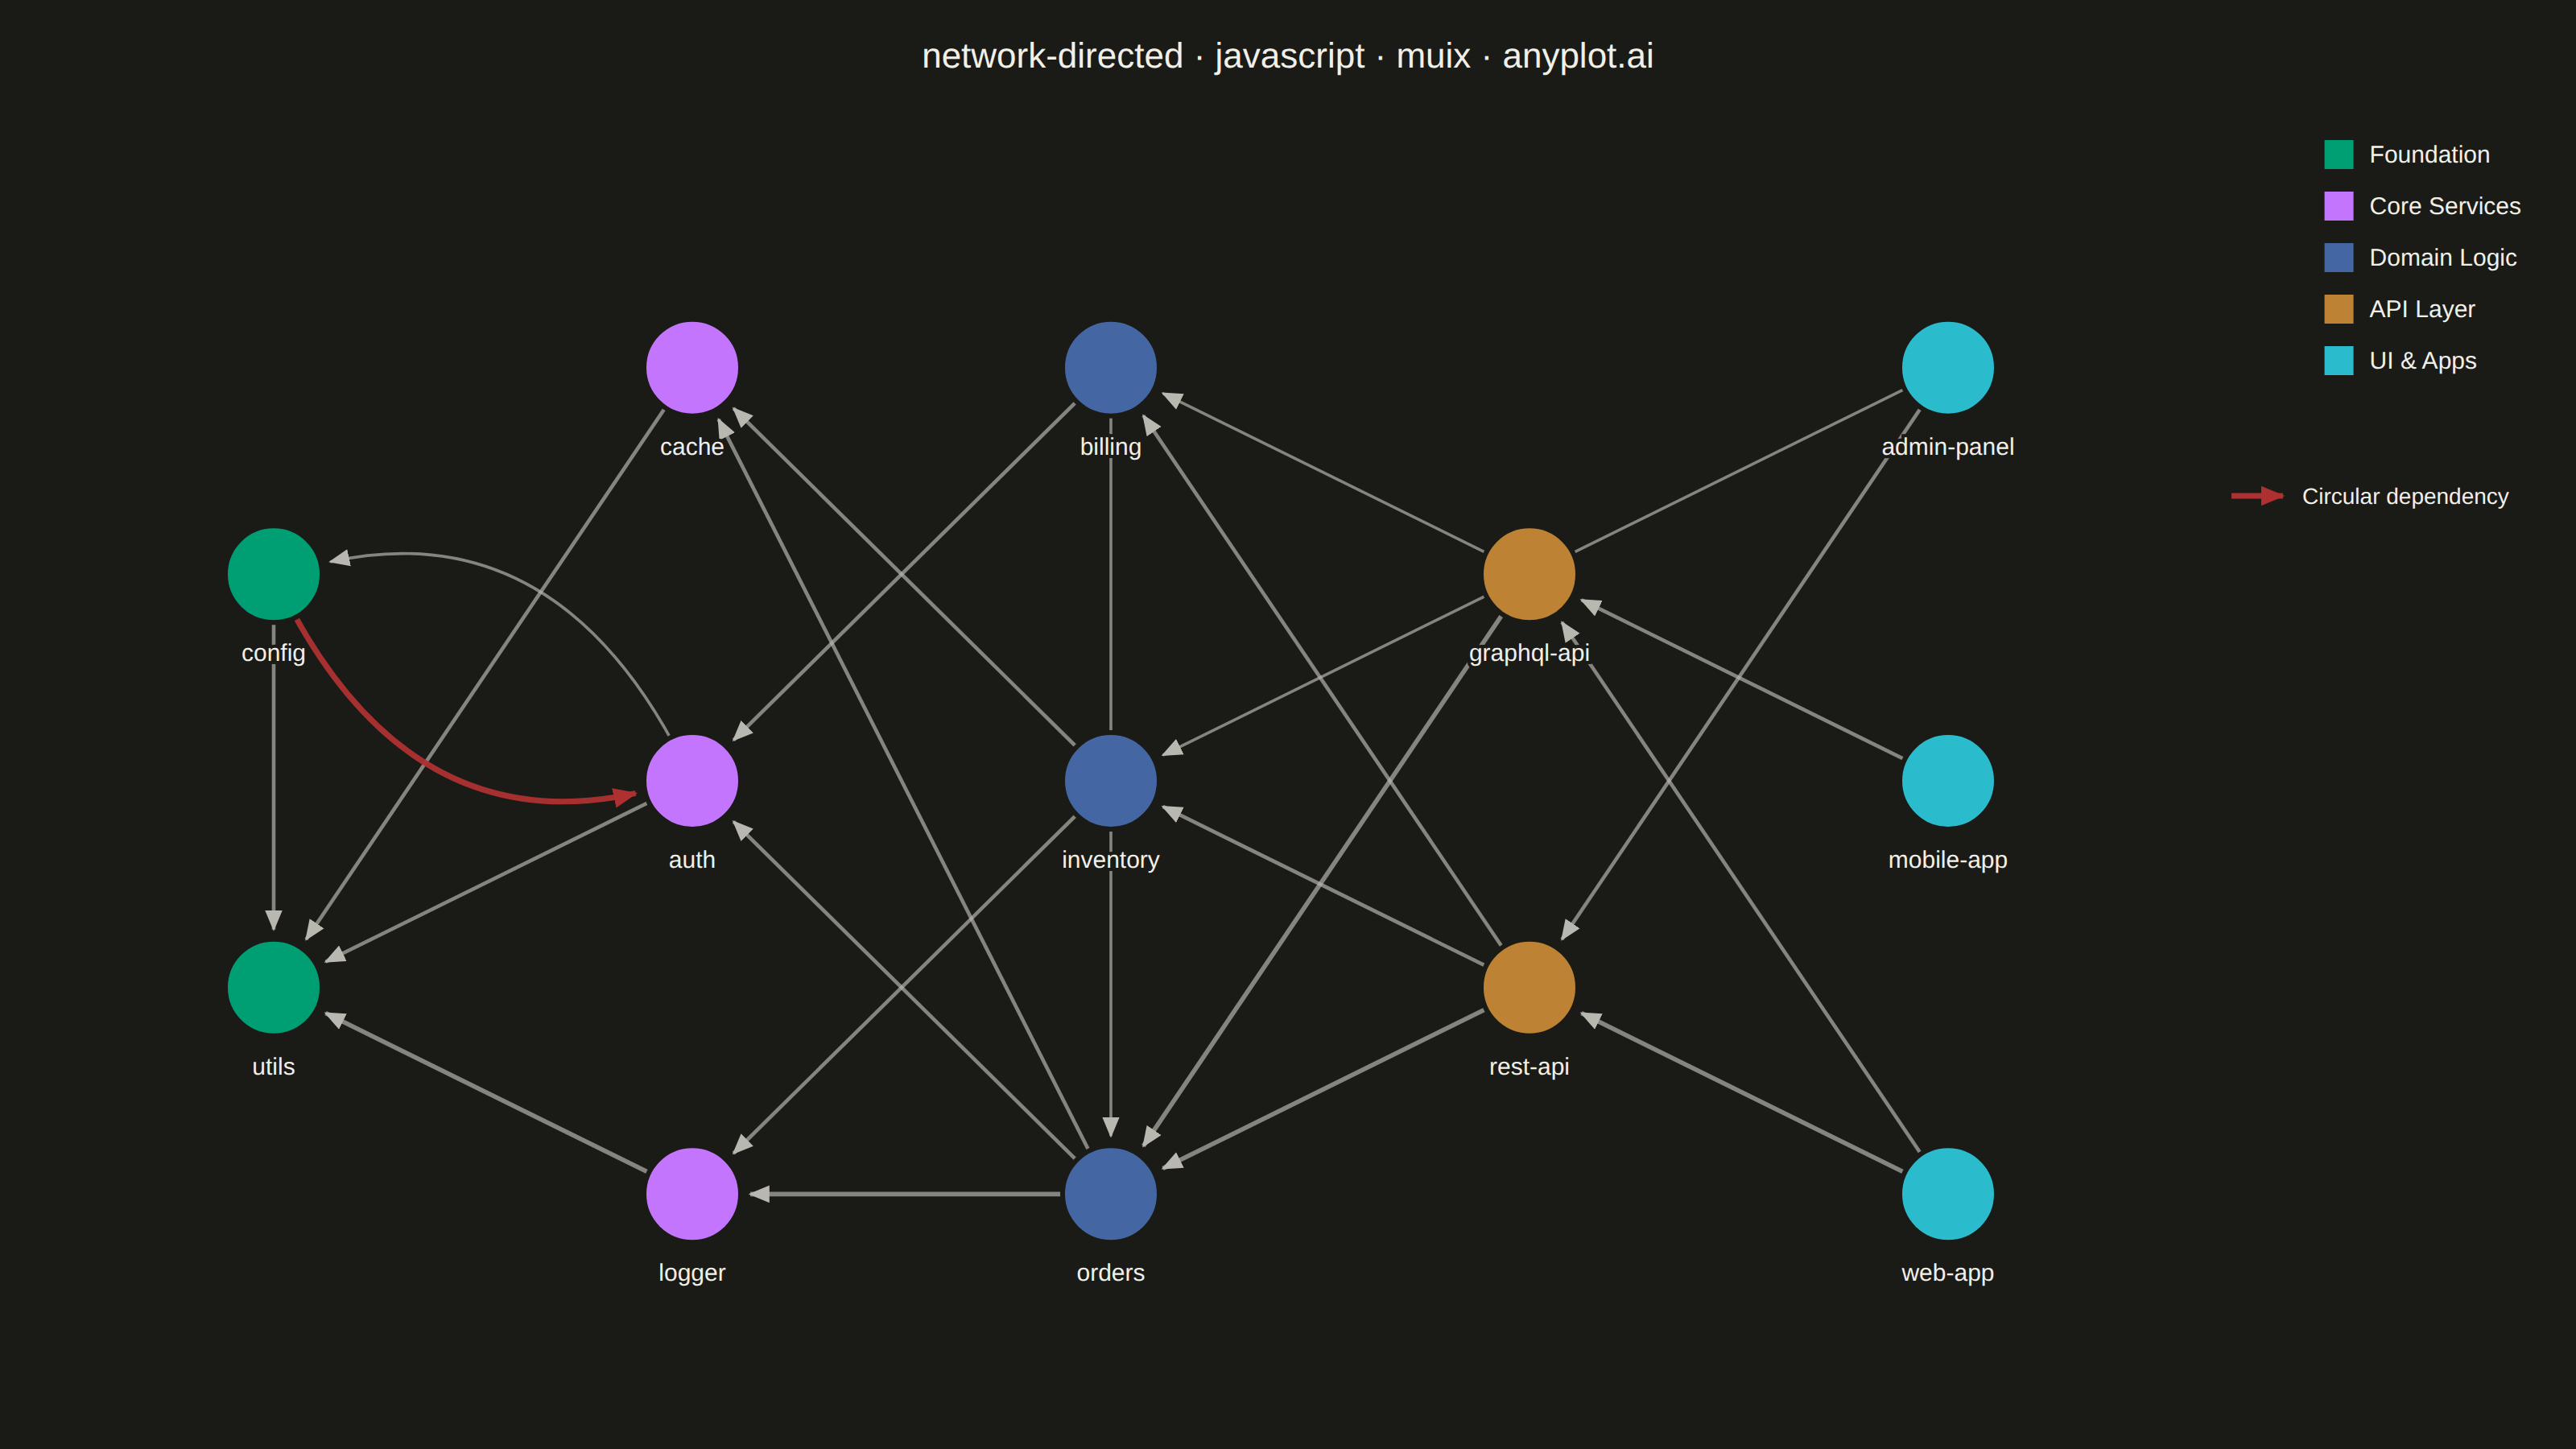
The same plot in 14 other libraries — JavaScript: Chart.js, D3.js, Apache ECharts, Highcharts; Python: Altair, Bokeh, lets-plot, Matplotlib, Plotly, plotnine, Pygal, Seaborn; R: ggplot2; Julia: Makie.jl. Compare all 15 side by side: Directed Network Graph in Python, R, Julia and JavaScript.
A directed network graph visualizes relationships between entities using nodes connected by edges with arrows, indicating the direction of relationships or flow. Unlike undirected graphs, directed graphs reveal asymmetric relationships such as dependencies, hierarchies, or information flow. The arrows clearly communicate which entity points to which, making cause-and-effect relationships and directional dependencies immediately visible.
// anyplot.ai
// network-directed: Directed Network Graph
// Library: muix 7.29.1 | JavaScript 22.23.2
// Quality: 91/100 | Created: 2026-09-05
import { ChartContainer } from "@mui/x-charts/ChartContainer";
import { ScatterPlot } from "@mui/x-charts/ScatterChart";
import { ChartsLegend } from "@mui/x-charts/ChartsLegend";
import { useXScale, useYScale, useDrawingArea } from "@mui/x-charts/hooks";

const t = window.ANYPLOT_TOKENS;

// --- Module dependency graph (in-memory, deterministic) ---------------------
// A layered "build order" layout: layer 0 (foundation) has no dependencies,
// each later layer imports from earlier ones. x = layer index, y = position
// within the layer (centered so layers with fewer modules stay balanced).
const LAYERS = [
  { id: "foundation", label: "Foundation", color: t.palette[0] },
  { id: "core", label: "Core Services", color: t.palette[1] },
  { id: "domain", label: "Domain Logic", color: t.palette[2] },
  { id: "api", label: "API Layer", color: t.palette[3] },
  { id: "ui", label: "UI & Apps", color: t.palette[5] }, // skip palette[4] — reserved matte-red for the flagged cycle below
];

const RAW_NODES = [
  { id: "utils", label: "utils", layer: 0, group: "foundation" },
  { id: "config", label: "config", layer: 0, group: "foundation" },
  { id: "logger", label: "logger", layer: 1, group: "core" },
  { id: "auth", label: "auth", layer: 1, group: "core" },
  { id: "cache", label: "cache", layer: 1, group: "core" },
  { id: "orders", label: "orders", layer: 2, group: "domain" },
  { id: "inventory", label: "inventory", layer: 2, group: "domain" },
  { id: "billing", label: "billing", layer: 2, group: "domain" },
  { id: "rest-api", label: "rest-api", layer: 3, group: "api" },
  { id: "graphql-api", label: "graphql-api", layer: 3, group: "api" },
  { id: "web-app", label: "web-app", layer: 4, group: "ui" },
  { id: "mobile-app", label: "mobile-app", layer: 4, group: "ui" },
  { id: "admin-panel", label: "admin-panel", layer: 4, group: "ui" },
];

// Center each layer's nodes vertically around y = 0.
const layerCounts = new Map();
RAW_NODES.forEach((n) => layerCounts.set(n.layer, (layerCounts.get(n.layer) ?? 0) + 1));
const layerSeen = new Map();
const NODES = RAW_NODES.map((n) => {
  const seen = layerSeen.get(n.layer) ?? 0;
  layerSeen.set(n.layer, seen + 1);
  const count = layerCounts.get(n.layer);
  return { ...n, x: n.layer, y: seen - (count - 1) / 2 };
});
const NODE_BY_ID = new Map(NODES.map((n) => [n.id, n]));

// Edges read "source depends on / imports target" — the arrow points from the
// importer to the imported module (build order flows right to left). The
// third tuple entry is the optional spec `weight` field (import call count),
// which drives arrow/stroke thickness below.
const RAW_EDGES = [
  ["config", "utils", 2],
  ["logger", "utils", 3],
  ["auth", "utils", 2],
  ["auth", "config", 1],
  ["cache", "utils", 2],
  ["orders", "auth", 2],
  ["orders", "logger", 3],
  ["orders", "cache", 2],
  ["inventory", "cache", 2],
  ["inventory", "logger", 2],
  ["billing", "auth", 2],
  ["billing", "orders", 1],
  ["rest-api", "orders", 3],
  ["rest-api", "inventory", 2],
  ["rest-api", "billing", 2],
  ["graphql-api", "orders", 3],
  ["graphql-api", "billing", 1],
  ["web-app", "rest-api", 3],
  ["web-app", "graphql-api", 2],
  ["mobile-app", "graphql-api", 2],
  ["admin-panel", "rest-api", 2],
  ["admin-panel", "inventory", 1],
  // "config" is Foundation yet reaches up into Core — combined with the
  // existing auth -> config edge this closes a 2-cycle: a real circular
  // dependency, flagged in the semantic error red instead of the group color.
  ["config", "auth", 1],
];
const EDGES = RAW_EDGES.map(([source, target, weight]) => ({
  source,
  target,
  weight,
  flagged: source === "config" && target === "auth",
}));
const EDGE_KEYS = new Set(EDGES.map((e) => `${e.source}>${e.target}`));
const isBidirectional = (e) => EDGE_KEYS.has(`${e.target}>${e.source}`);

const NODE_RADIUS = 30;
const END_GAP = 6; // leaves room for the arrowhead before it touches the node
const FLAG_COLOR = "#AE3030"; // Imprint palette position 5 — semantic anchor for a real bug

function edgePath(e, xScale, yScale) {
  const s = NODE_BY_ID.get(e.source);
  const d = NODE_BY_ID.get(e.target);
  const x1 = xScale(s.x);
  const y1 = yScale(s.y);
  const x2 = xScale(d.x);
  const y2 = yScale(d.y);

  if (!isBidirectional(e)) {
    const dx = x2 - x1;
    const dy = y2 - y1;
    const dist = Math.hypot(dx, dy) || 1;
    const ex = x2 - (dx / dist) * (NODE_RADIUS + END_GAP);
    const ey = y2 - (dy / dist) * (NODE_RADIUS + END_GAP);
    return `M ${x1} ${y1} L ${ex} ${ey}`;
  }

  // Bow bidirectional pairs apart (see spec note on curved edges) so the two
  // opposing arrows never sit exactly on top of one another. The normal must
  // be computed from a direction-independent (canonical) chord — otherwise it
  // flips sign along with the edge's own direction and the two bows cancel
  // out instead of separating.
  const mx = (x1 + x2) / 2;
  const my = (y1 + y2) / 2;
  const canonicalFrom = e.source < e.target ? s : d;
  const canonicalTo = e.source < e.target ? d : s;
  const cdx = xScale(canonicalTo.x) - xScale(canonicalFrom.x);
  const cdy = yScale(canonicalTo.y) - yScale(canonicalFrom.y);
  const cdist = Math.hypot(cdx, cdy) || 1;
  const nx = -cdy / cdist;
  const ny = cdx / cdist;
  const sign = e.source < e.target ? 1 : -1;
  const bow = Math.max(55, cdist * 0.4) * sign;
  const cx = mx + nx * bow;
  const cy = my + ny * bow;
  // Tangent at the curve's end is exactly the control-point → end direction.
  const tdx = x2 - cx;
  const tdy = y2 - cy;
  const tdist = Math.hypot(tdx, tdy) || 1;
  const ex = x2 - (tdx / tdist) * (NODE_RADIUS + END_GAP);
  const ey = y2 - (tdy / tdist) * (NODE_RADIUS + END_GAP);
  return `M ${x1} ${y1} Q ${cx} ${cy} ${ex} ${ey}`;
}

// --- Edges layer (drawn first, so nodes sit visually on top) ----------------
function GraphEdges() {
  const xScale = useXScale();
  const yScale = useYScale();
  return (
    <g>
      <defs>
        <marker
          id="np-arrow"
          viewBox="0 0 12 10"
          refX="11"
          refY="5"
          markerWidth="13"
          markerHeight="11"
          markerUnits="userSpaceOnUse"
          orient="auto-start-reverse"
        >
          <path d="M0,0 L12,5 L0,10 Z" fill={t.inkSoft} />
        </marker>
        <marker
          id="np-arrow-flag"
          viewBox="0 0 12 10"
          refX="11"
          refY="5"
          markerWidth="15"
          markerHeight="13"
          markerUnits="userSpaceOnUse"
          orient="auto-start-reverse"
        >
          <path d="M0,0 L12,5 L0,10 Z" fill={FLAG_COLOR} />
        </marker>
      </defs>
      {EDGES.map((e, i) => (
        <path
          key={`${e.source}-${e.target}-${i}`}
          d={edgePath(e, xScale, yScale)}
          fill="none"
          stroke={e.flagged ? FLAG_COLOR : t.inkSoft}
          strokeWidth={e.flagged ? 3.5 : 1.3 + e.weight * 0.5}
          strokeOpacity={e.flagged ? 0.95 : 0.68}
          markerEnd={e.flagged ? "url(#np-arrow-flag)" : "url(#np-arrow)"}
        />
      ))}
    </g>
  );
}

// --- Node markers — a custom ScatterPlot scatter slot so each circle gets a
// page-background stroke ring for definition where edges cross underneath. --
function NodeMarker({ series, xScale, yScale, color, colorGetter, markerSize }) {
  return (
    <g>
      {series.data.map((d, i) => (
        <circle
          key={d.id ?? i}
          cx={xScale(d.x)}
          cy={yScale(d.y)}
          r={markerSize}
          fill={colorGetter ? colorGetter(i) : color}
          stroke={t.pageBg}
          strokeWidth={3}
        />
      ))}
    </g>
  );
}

// --- Node labels (drawn last, always legible over edges/markers) -----------
function NodeLabels() {
  const xScale = useXScale();
  const yScale = useYScale();
  return (
    <g>
      {NODES.map((n) => (
        <text
          key={n.id}
          x={xScale(n.x)}
          y={yScale(n.y) + NODE_RADIUS + 24}
          textAnchor="middle"
          fontSize={15}
          fontWeight={500}
          fill={t.ink}
          stroke={t.pageBg}
          strokeWidth={4}
          paintOrder="stroke"
        >
          {n.label}
        </text>
      ))}
    </g>
  );
}

// --- Manual note explaining the flagged cycle, placed under the group legend
function CircularDependencyNote() {
  const drawingArea = useDrawingArea();
  const x = drawingArea.left + drawingArea.width + 46;
  const y = drawingArea.top + LAYERS.length * 30 + 58;
  return (
    <g>
      <line x1={x} y1={y} x2={x + 32} y2={y} stroke={FLAG_COLOR} strokeWidth={3.5} markerEnd="url(#np-arrow-flag)" />
      <text x={x + 44} y={y + 5} fontSize={14} fill={t.ink}>
        Circular dependency
      </text>
    </g>
  );
}

const TITLE = "network-directed · javascript · muix · anyplot.ai";
const TITLE_HEIGHT = 70;
const MARGIN = { top: 30, right: 260, bottom: 30, left: 40 };

const series = LAYERS.map((g) => ({
  type: "scatter",
  id: g.id,
  label: g.label,
  color: g.color,
  markerSize: NODE_RADIUS,
  data: NODES.filter((n) => n.group === g.id).map((n) => ({ x: n.x, y: n.y, id: n.id })),
}));

// --- Chart (default-exported component — the harness mounts it) -------------
export default function Chart() {
  return (
    <div
      style={{
        width: window.ANYPLOT_SIZE.width,
        height: window.ANYPLOT_SIZE.height,
        display: "flex",
        flexDirection: "column",
      }}
    >
      <div
        style={{
          height: TITLE_HEIGHT,
          display: "flex",
          alignItems: "center",
          justifyContent: "center",
          fontSize: 22,
          fontWeight: 500,
          color: t.ink,
        }}
      >
        {TITLE}
      </div>
      <ChartContainer
        width={window.ANYPLOT_SIZE.width}
        height={window.ANYPLOT_SIZE.height - TITLE_HEIGHT}
        margin={MARGIN}
        skipAnimation
        xAxis={[{ scaleType: "linear", min: -0.5, max: 4.5 }]}
        yAxis={[{ scaleType: "linear", min: -1.5, max: 1.5 }]}
        series={series}
      >
        <GraphEdges />
        <ScatterPlot slots={{ scatter: NodeMarker }} />
        <NodeLabels />
        <ChartsLegend
          position={{ vertical: "top", horizontal: "right" }}
          direction="column"
          itemMarkWidth={18}
          itemMarkHeight={18}
          markGap={10}
          itemGap={14}
          padding={{ top: 10, right: 20 }}
          labelStyle={{ fontSize: 15, fill: t.ink }}
        />
        <CircularDependencyNote />
      </ChartContainer>
    </div>
  );
}
Runnable source as JSON, for any HTTP client: https://api.anyplot.ai/specs/network-directed/muix/code. Any spec id and library id listed in llms-full.txt fit the same URL shape; every URL below is complete and callable.
{
  "spec_id": "network-directed",
  "language": "javascript",
  "library": "muix",
  "page": "https://anyplot.ai/network-directed/javascript/muix",
  "hub": "https://anyplot.ai/network-directed",
  "code_json": "https://api.anyplot.ai/specs/network-directed/muix/code",
  "spec_json": "https://api.anyplot.ai/specs/network-directed",
  "render_light_png": "https://storage.googleapis.com/anyplot-images/plots/network-directed/javascript/muix/plot-light.png",
  "render_dark_png": "https://storage.googleapis.com/anyplot-images/plots/network-directed/javascript/muix/plot-dark.png",
  "interactive_light_html": "https://storage.googleapis.com/anyplot-images/plots/network-directed/javascript/muix/plot-light.html",
  "interactive_dark_html": "https://storage.googleapis.com/anyplot-images/plots/network-directed/javascript/muix/plot-dark.html",
  "quality_score": 91.0,
  "license": "MIT",
  "guide": "https://anyplot.ai/llms.txt"
}
Part of Directed Network Graph on anyplot.ai.