The same plot in 14 other libraries — JavaScript: D3.js, Apache ECharts, Highcharts, MUI X Charts; Python: Altair, Bokeh, lets-plot, Matplotlib, Plotly, plotnine, Pygal, Seaborn; R: ggplot2; Julia: Makie.jl. Compare all 15 side by side: Directed Network Graph in Python, R, Julia and JavaScript.
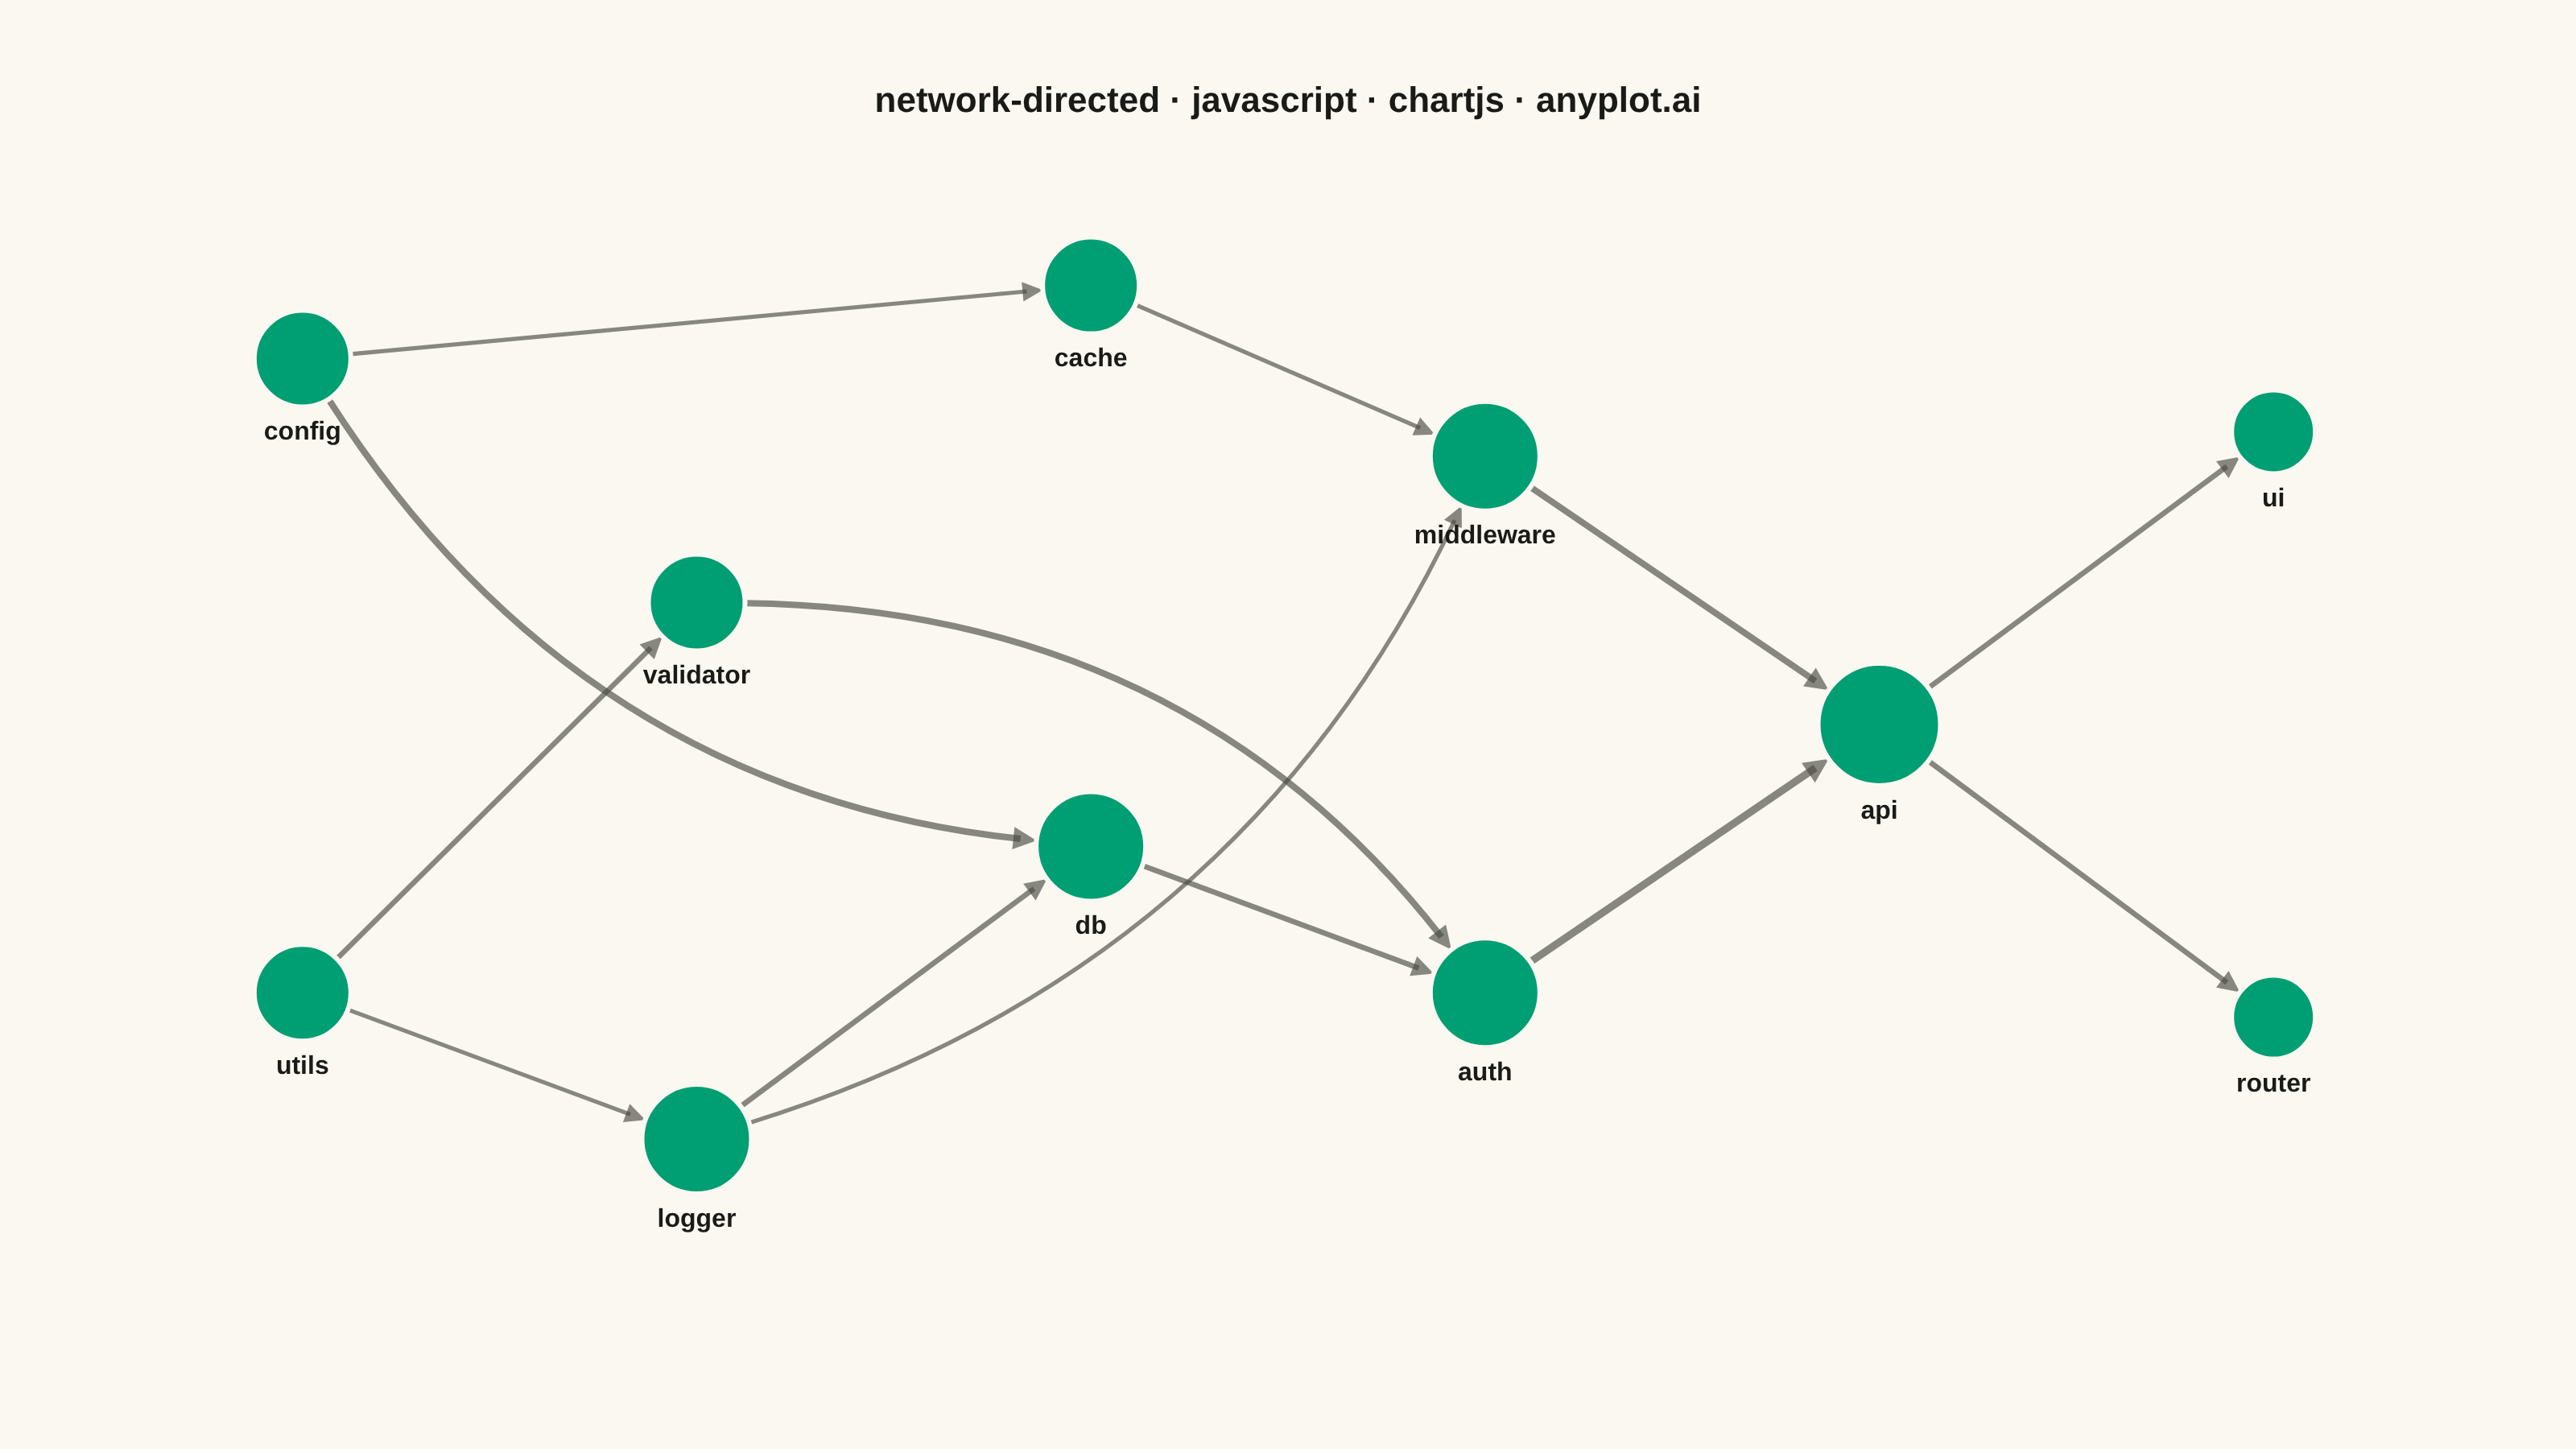
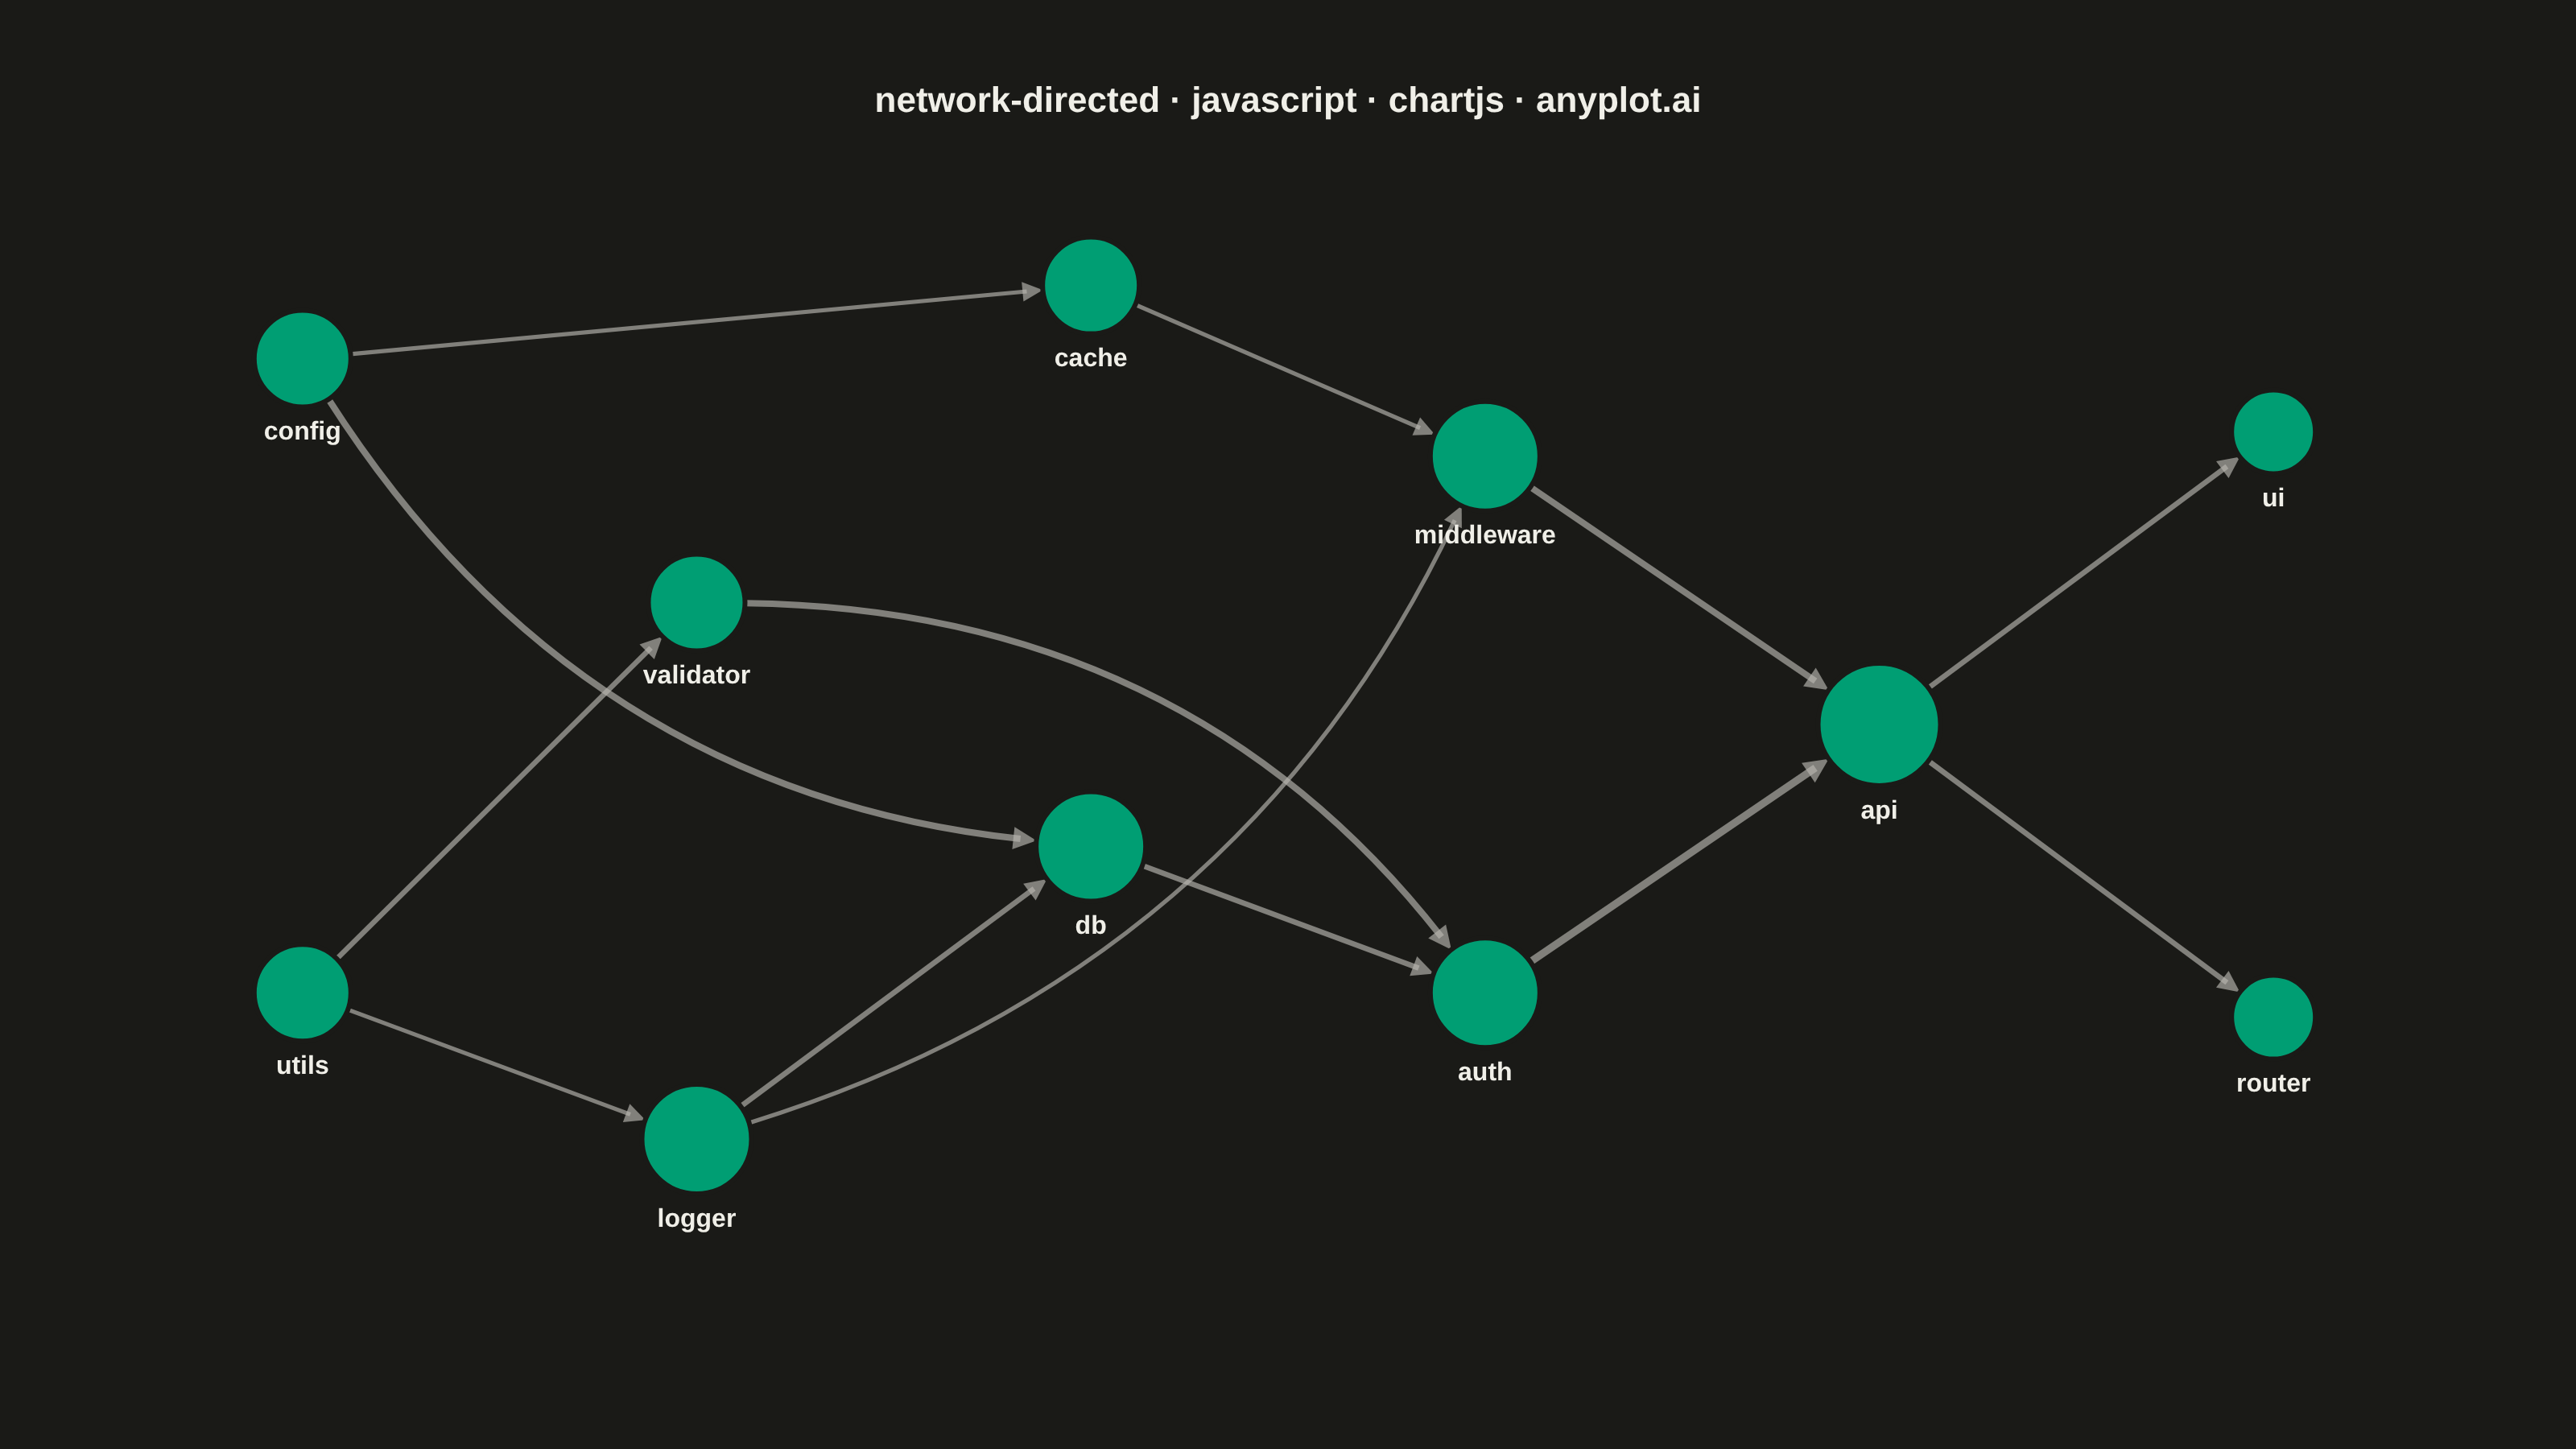
A directed network graph visualizes relationships between entities using nodes connected by edges with arrows, indicating the direction of relationships or flow. Unlike undirected graphs, directed graphs reveal asymmetric relationships such as dependencies, hierarchies, or information flow. The arrows clearly communicate which entity points to which, making cause-and-effect relationships and directional dependencies immediately visible.
// anyplot.ai
// network-directed: Directed Network Graph
// Library: chartjs 4.4.7 | JavaScript 22.23.2
// Quality: 89/100 | Created: 2026-09-05
//# anyplot-orientation: landscape

const t = window.ANYPLOT_TOKENS;

// --- Data: software module import graph -------------------------------------
// Layered left-to-right by build order; an edge (from, to) means "from is
// imported by to", so the arrow flows from the dependency toward the
// dependent module. `weight` is the spec's optional edge-weight field,
// encoded here as line thickness (heavier coupling -> thicker edge).
// `curve` bows an edge away from the straight line between its endpoints
// (as a fraction of the edge length) so long "skip" edges that would
// otherwise cut straight through an unrelated node (near db/validator)
// read unambiguously instead of looking like they touch that node.
const nodes = [
  { id: "utils", x: 0, y: 1.0 },
  { id: "config", x: 0, y: 3.6 },
  { id: "logger", x: 1, y: 0.4 },
  { id: "validator", x: 1, y: 2.6 },
  { id: "db", x: 2, y: 1.6 },
  { id: "cache", x: 2, y: 3.9 },
  { id: "auth", x: 3, y: 1.0 },
  { id: "middleware", x: 3, y: 3.2 },
  { id: "api", x: 4, y: 2.1 },
  { id: "router", x: 5, y: 0.9 },
  { id: "ui", x: 5, y: 3.3 },
];

const edges = [
  { from: "utils", to: "logger", weight: 2, curve: 0 },
  { from: "utils", to: "validator", weight: 3, curve: 0 },
  { from: "config", to: "db", weight: 4, curve: 0.24 },
  { from: "config", to: "cache", weight: 2, curve: 0 },
  { from: "logger", to: "db", weight: 3, curve: 0 },
  { from: "logger", to: "middleware", weight: 2, curve: 0.22 },
  { from: "validator", to: "auth", weight: 4, curve: -0.24 },
  { from: "db", to: "auth", weight: 3, curve: 0 },
  { from: "cache", to: "middleware", weight: 2, curve: 0 },
  { from: "auth", to: "api", weight: 5, curve: 0 },
  { from: "middleware", to: "api", weight: 4, curve: 0 },
  { from: "api", to: "router", weight: 3, curve: 0 },
  { from: "api", to: "ui", weight: 3, curve: 0 },
];

const nodeById = Object.fromEntries(nodes.map((n) => [n.id, n]));

// Node radius scales with total degree (in + out): hub modules that many
// others depend on (or that depend on many others) read as visually larger,
// while leaf/sink modules stay compact -- a size-based hierarchy cue instead
// of a uniform flat marker.
nodes.forEach((n) => (n.degree = 0));
edges.forEach(({ from, to }) => {
  nodeById[from].degree += 1;
  nodeById[to].degree += 1;
});
nodes.forEach((n) => (n.radius = 22 + n.degree * 4));

// --- Mount -------------------------------------------------------------------
const canvas = document.createElement("canvas");
document.getElementById("container").appendChild(canvas);

// --- Arrowhead helper ---------------------------------------------------------
function drawArrowhead(ctx, endX, endY, angle, arrowLength, arrowSpread) {
  const tipX = endX + Math.cos(angle) * 10;
  const tipY = endY + Math.sin(angle) * 10;
  ctx.beginPath();
  ctx.moveTo(tipX, tipY);
  ctx.lineTo(
    tipX - arrowLength * Math.cos(angle - arrowSpread),
    tipY - arrowLength * Math.sin(angle - arrowSpread),
  );
  ctx.lineTo(
    tipX - arrowLength * Math.cos(angle + arrowSpread),
    tipY - arrowLength * Math.sin(angle + arrowSpread),
  );
  ctx.closePath();
  ctx.fill();
}

// --- Directed-edge plugin: arrows + node labels around the scatter dataset ---
const directedEdgesPlugin = {
  id: "directedEdges",
  beforeDatasetsDraw(chart) {
    const {
      ctx,
      scales: { x: xScale, y: yScale },
    } = chart;
    ctx.save();
    ctx.strokeStyle = t.inkSoft;
    ctx.fillStyle = t.inkSoft;
    ctx.globalAlpha = 0.65;
    const arrowSpread = Math.PI / 7;

    edges.forEach(({ from, to, weight, curve }) => {
      const s = nodeById[from];
      const d = nodeById[to];
      const x1 = xScale.getPixelForValue(s.x);
      const y1 = yScale.getPixelForValue(s.y);
      const x2 = xScale.getPixelForValue(d.x);
      const y2 = yScale.getPixelForValue(d.y);
      const lineWidth = 1.2 + weight * 0.7;
      const arrowLength = 12 + weight;
      ctx.lineWidth = lineWidth;

      if (curve === 0) {
        const angle = Math.atan2(y2 - y1, x2 - x1);
        const startX = x1 + Math.cos(angle) * s.radius;
        const startY = y1 + Math.sin(angle) * s.radius;
        const endX = x2 - Math.cos(angle) * (d.radius + 10);
        const endY = y2 - Math.sin(angle) * (d.radius + 10);

        ctx.beginPath();
        ctx.moveTo(startX, startY);
        ctx.lineTo(endX, endY);
        ctx.stroke();
        drawArrowhead(ctx, endX, endY, angle, arrowLength, arrowSpread);
        return;
      }

      // Quadratic bezier: control point offset perpendicular to the
      // straight source->target line, bowing the edge clear of nodes it
      // would otherwise pass close to.
      const dx = x2 - x1;
      const dy = y2 - y1;
      const len = Math.hypot(dx, dy);
      const midX = (x1 + x2) / 2;
      const midY = (y1 + y2) / 2;
      const perpX = -dy / len;
      const perpY = dx / len;
      const ctrlX = midX + perpX * len * curve;
      const ctrlY = midY + perpY * len * curve;

      // Tangent at t=0 points from the node center toward the control
      // point; tangent at t=1 points from the control point toward the
      // target center -- exact for a quadratic bezier, so trimming and the
      // arrowhead angle both stay aligned with the drawn curve.
      const startAngle = Math.atan2(ctrlY - y1, ctrlX - x1);
      const endAngle = Math.atan2(y2 - ctrlY, x2 - ctrlX);
      const startX = x1 + Math.cos(startAngle) * s.radius;
      const startY = y1 + Math.sin(startAngle) * s.radius;
      const endX = x2 - Math.cos(endAngle) * (d.radius + 10);
      const endY = y2 - Math.sin(endAngle) * (d.radius + 10);

      ctx.beginPath();
      ctx.moveTo(startX, startY);
      ctx.quadraticCurveTo(ctrlX, ctrlY, endX, endY);
      ctx.stroke();
      drawArrowhead(ctx, endX, endY, endAngle, arrowLength, arrowSpread);
    });
    ctx.restore();
  },
  afterDatasetsDraw(chart) {
    const {
      ctx,
      scales: { x: xScale, y: yScale },
    } = chart;
    ctx.save();
    ctx.font = "600 16px sans-serif";
    ctx.fillStyle = t.ink;
    ctx.textAlign = "center";
    ctx.textBaseline = "top";
    nodes.forEach((n) => {
      const px = xScale.getPixelForValue(n.x);
      const py = yScale.getPixelForValue(n.y);
      ctx.fillText(n.id, px, py + n.radius + 8);
    });
    ctx.restore();
  },
};

// --- Chart -------------------------------------------------------------------
new Chart(canvas, {
  type: "scatter",
  data: {
    datasets: [
      {
        label: "Module",
        data: nodes.map((n) => ({ x: n.x, y: n.y })),
        backgroundColor: t.palette[0],
        borderColor: t.pageBg,
        borderWidth: 3,
        pointRadius: nodes.map((n) => n.radius),
        pointHoverRadius: nodes.map((n) => n.radius),
      },
    ],
  },
  options: {
    responsive: true,
    maintainAspectRatio: false,
    animation: false,
    layout: { padding: 40 },
    plugins: {
      title: {
        display: true,
        text: "network-directed · javascript · chartjs · anyplot.ai",
        color: t.ink,
        font: { size: 22 },
      },
      legend: { display: false },
      tooltip: { enabled: false },
    },
    scales: {
      x: { display: false, min: -0.6, max: 5.6 },
      y: { display: false, min: -0.6, max: 4.5 },
    },
  },
  plugins: [directedEdgesPlugin],
});
Runnable source as JSON, for any HTTP client: https://api.anyplot.ai/specs/network-directed/chartjs/code. Any spec id and library id listed in llms-full.txt fit the same URL shape; every URL below is complete and callable.
{
  "spec_id": "network-directed",
  "language": "javascript",
  "library": "chartjs",
  "page": "https://anyplot.ai/network-directed/javascript/chartjs",
  "hub": "https://anyplot.ai/network-directed",
  "code_json": "https://api.anyplot.ai/specs/network-directed/chartjs/code",
  "spec_json": "https://api.anyplot.ai/specs/network-directed",
  "render_light_png": "https://storage.googleapis.com/anyplot-images/plots/network-directed/javascript/chartjs/plot-light.png",
  "render_dark_png": "https://storage.googleapis.com/anyplot-images/plots/network-directed/javascript/chartjs/plot-dark.png",
  "interactive_light_html": "https://storage.googleapis.com/anyplot-images/plots/network-directed/javascript/chartjs/plot-light.html",
  "interactive_dark_html": "https://storage.googleapis.com/anyplot-images/plots/network-directed/javascript/chartjs/plot-dark.html",
  "quality_score": 89.0,
  "license": "MIT",
  "guide": "https://anyplot.ai/llms.txt"
}
Part of Directed Network Graph on anyplot.ai.