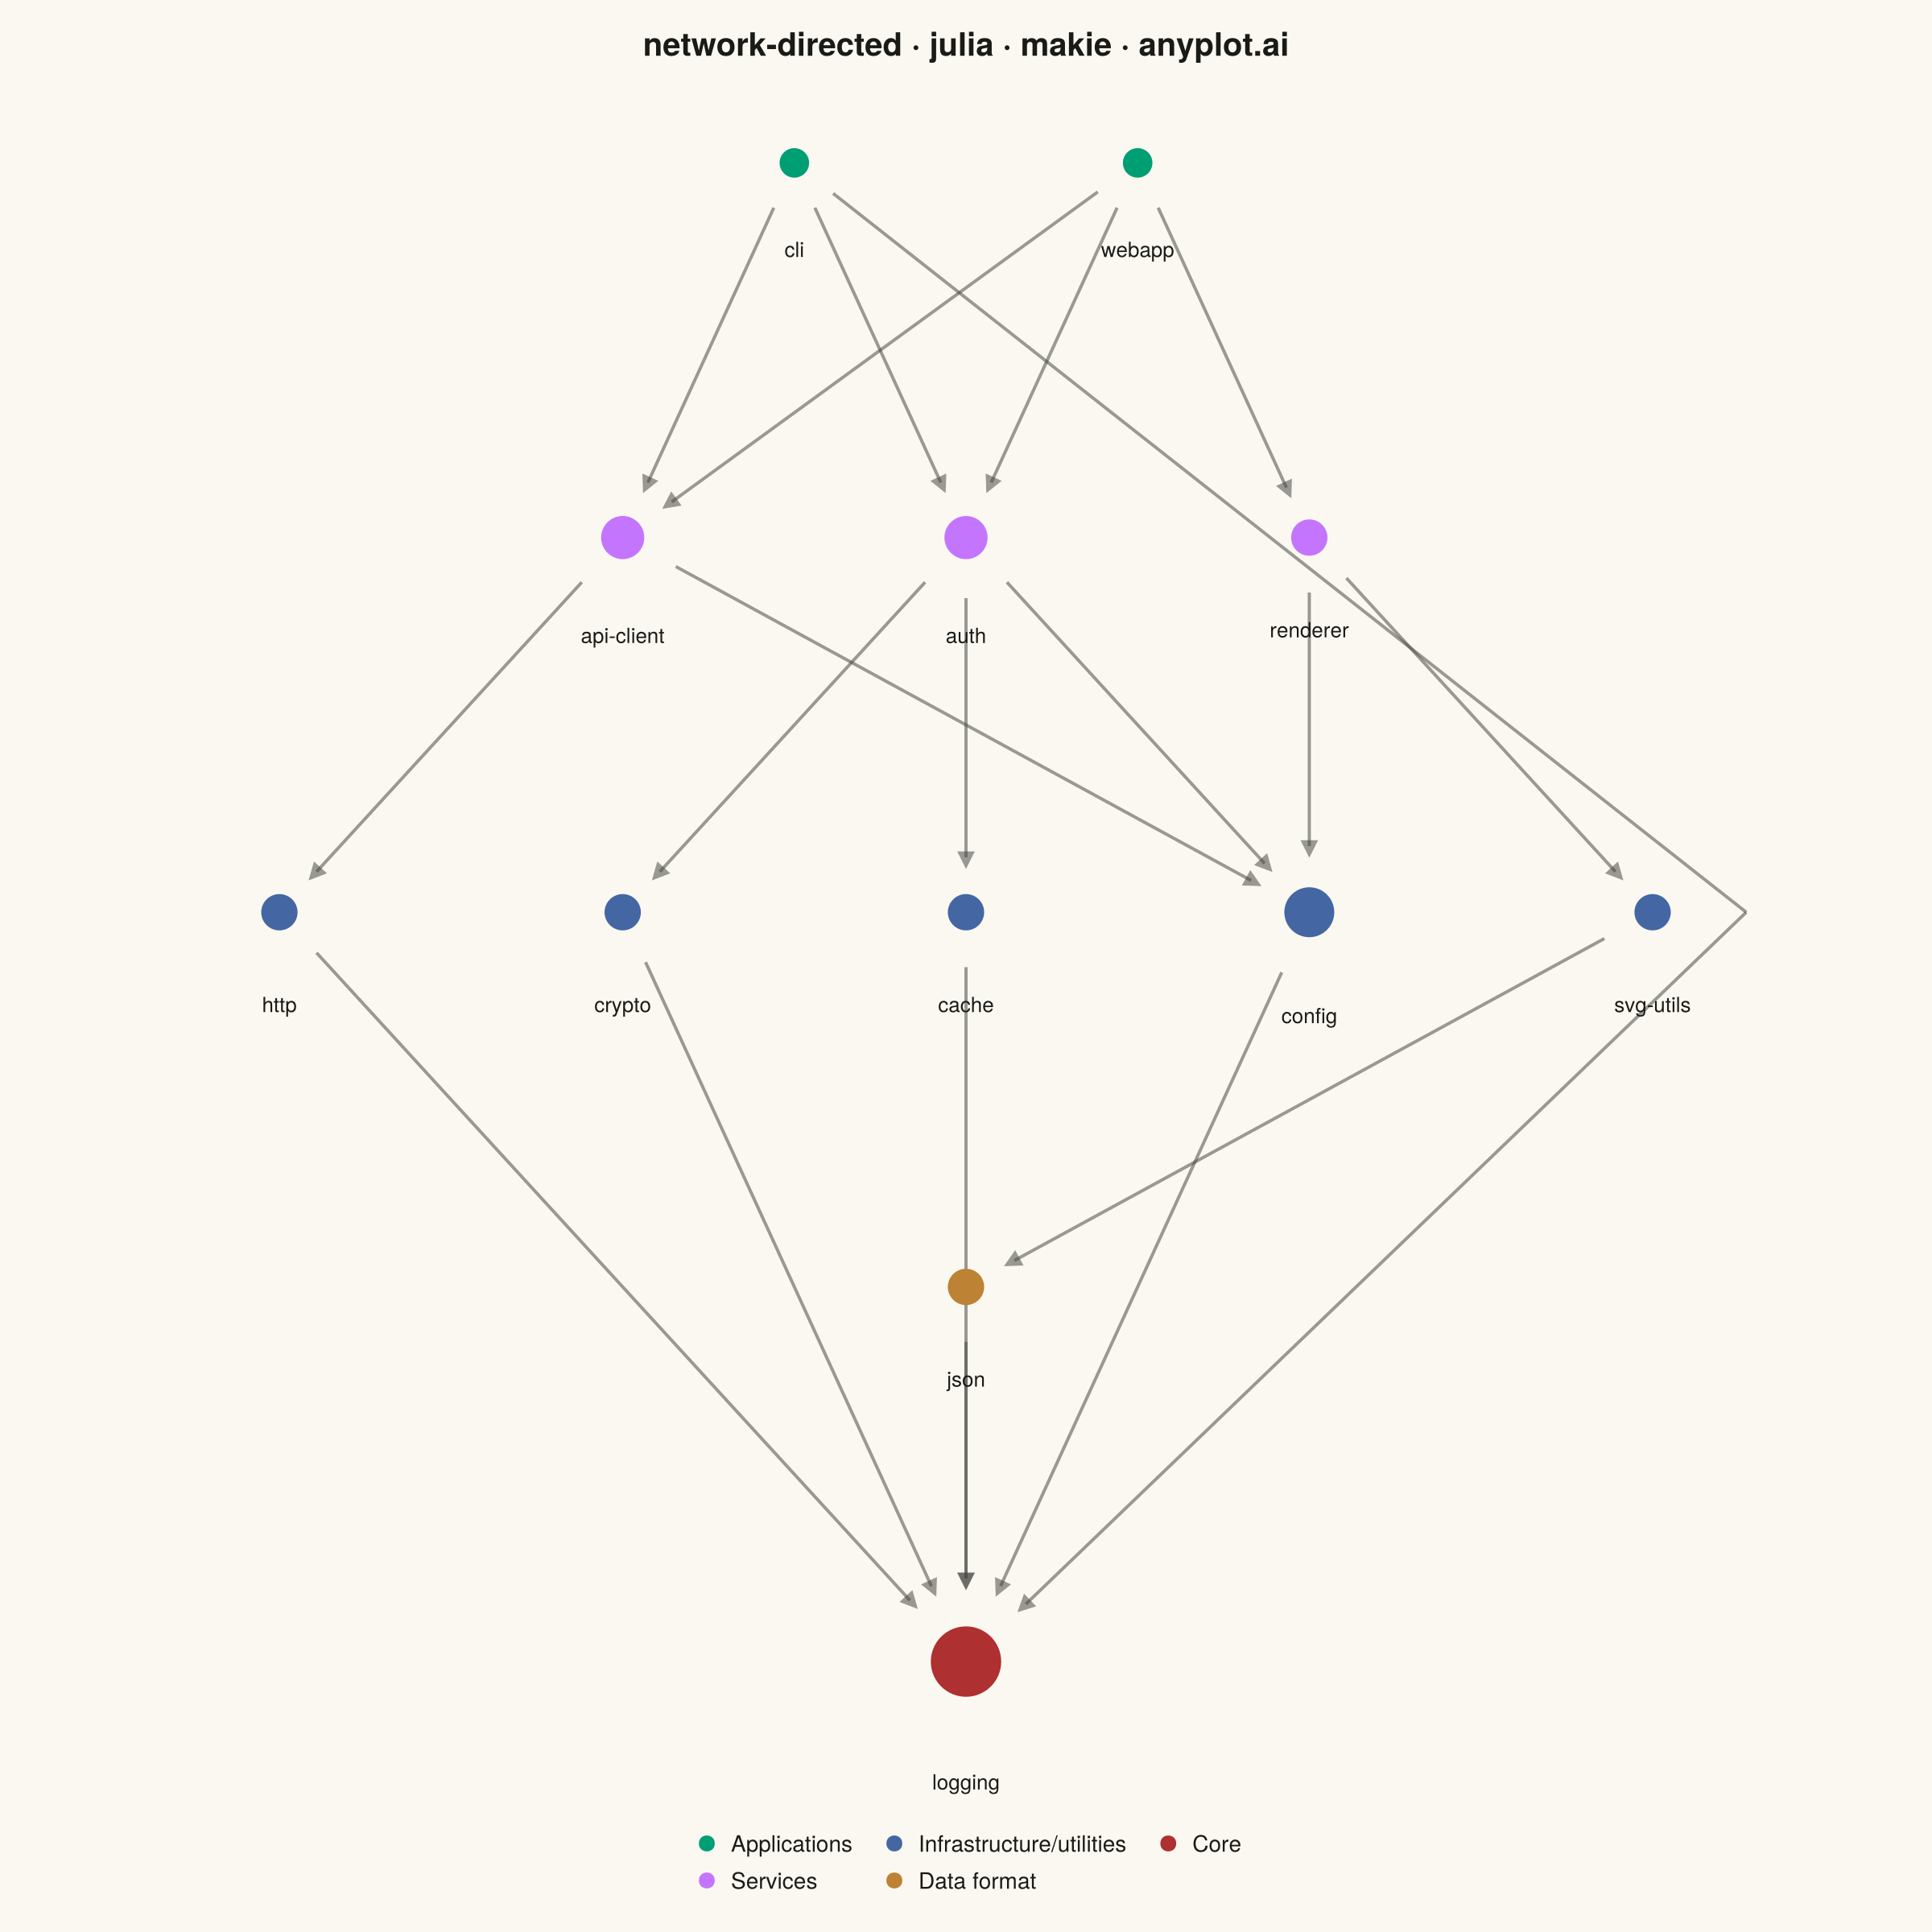
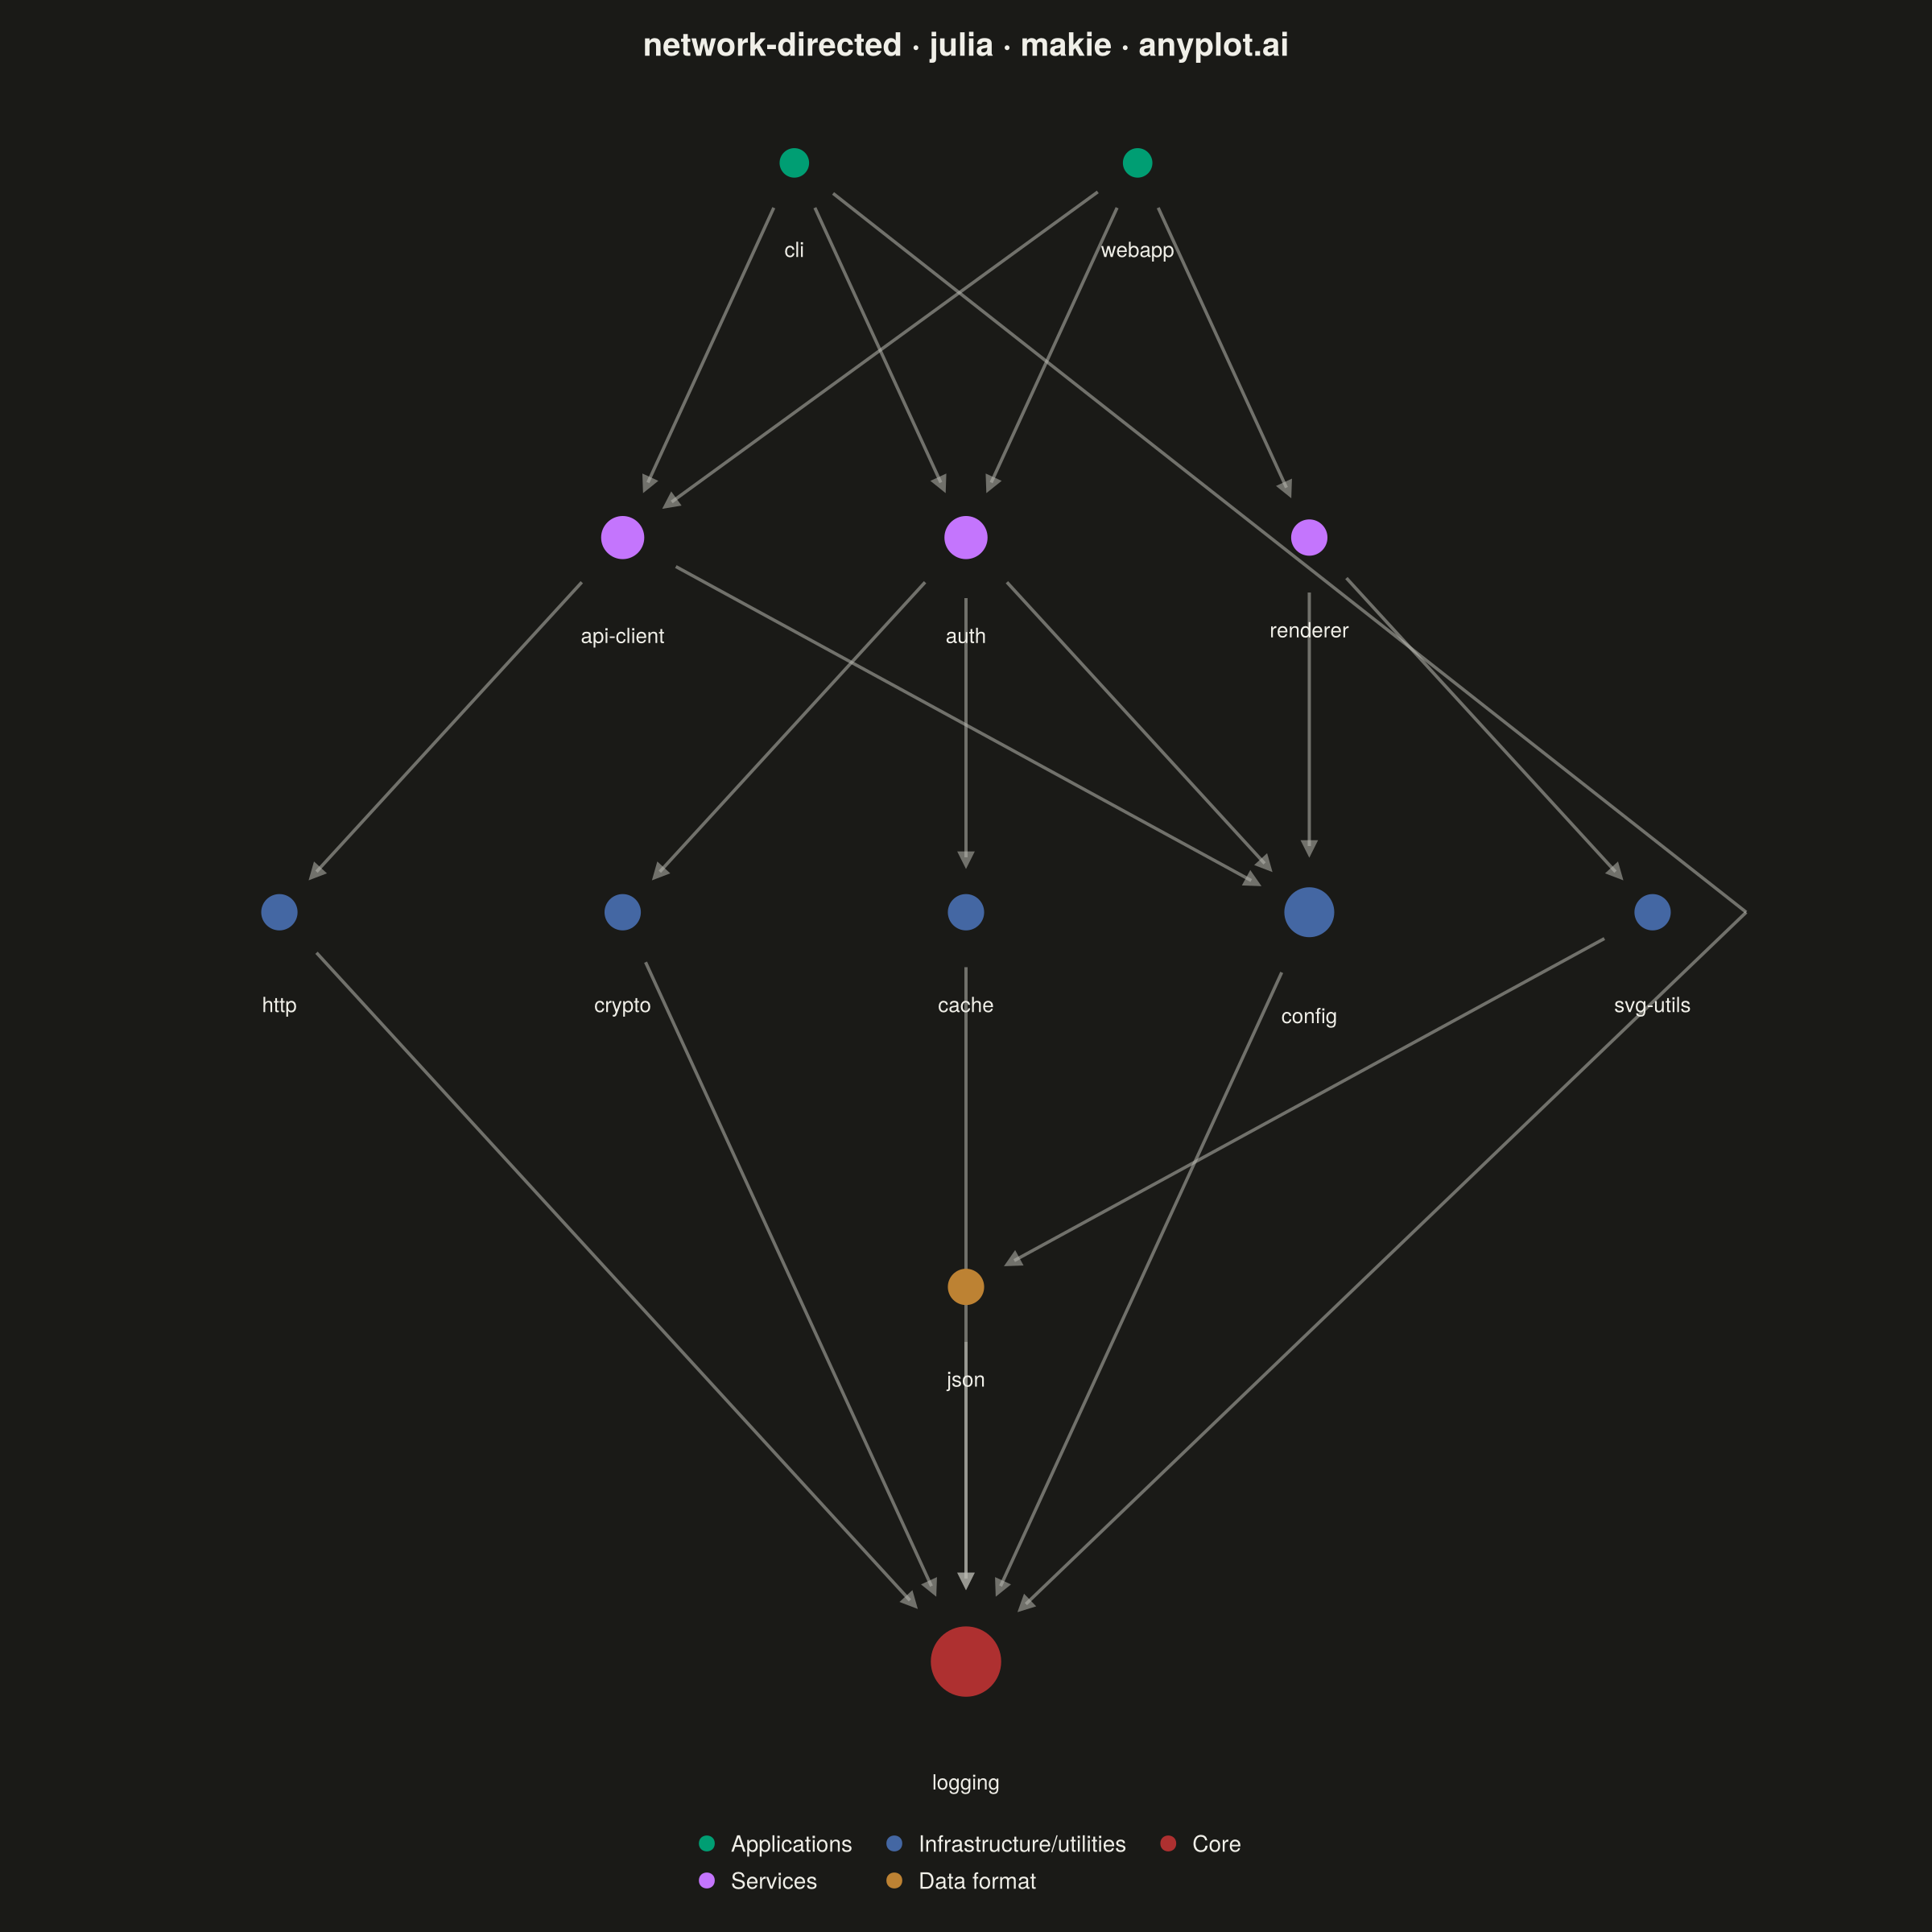
The same plot in 14 other libraries — Python: Altair, Bokeh, lets-plot, Matplotlib, Plotly, plotnine, Pygal, Seaborn; R: ggplot2; JavaScript: Chart.js, D3.js, Apache ECharts, Highcharts, MUI X Charts. Compare all 15 side by side: Directed Network Graph in Python, R, Julia and JavaScript.
A directed network graph visualizes relationships between entities using nodes connected by edges with arrows, indicating the direction of relationships or flow. Unlike undirected graphs, directed graphs reveal asymmetric relationships such as dependencies, hierarchies, or information flow. The arrows clearly communicate which entity points to which, making cause-and-effect relationships and directional dependencies immediately visible.
# anyplot.ai
# network-directed: Directed Network Graph
# Library: makie 0.21.9 | Julia 1.11.9
# Quality: 91/100 | Created: 2026-09-05

using CairoMakie
using Colors
using Random

Random.seed!(42)

# --- Theme tokens ------------------------------------------------------------
THEME      = get(ENV, "ANYPLOT_THEME", "light")
PAGE_BG    = THEME == "light" ? colorant"#FAF8F1" : colorant"#1A1A17"
INK        = THEME == "light" ? colorant"#1A1A17" : colorant"#F0EFE8"
INK_SOFT   = THEME == "light" ? colorant"#4A4A44" : colorant"#B8B7B0"
EDGE_COLOR = RGBAf(INK_SOFT.r, INK_SOFT.g, INK_SOFT.b, 0.55)
IMPRINT_PALETTE = [
    colorant"#009E73", colorant"#C475FD", colorant"#4467A3", colorant"#BD8233",
    colorant"#AE3030", colorant"#2ABCCD", colorant"#954477", colorant"#99B314",
]

# --- Data: a software package dependency graph --------------------------------
# Arrows point from a consumer to what it depends on / imports, exactly the
# "import direction" application called out in the specification.
nodes = [
    "webapp", "cli",
    "api-client", "auth", "renderer",
    "http", "config", "crypto", "cache", "svg-utils",
    "json",
    "logging",
]

edges = [
    ("webapp", "api-client"), ("webapp", "auth"), ("webapp", "renderer"),
    ("cli", "api-client"), ("cli", "auth"), ("cli", "logging"),
    ("api-client", "http"), ("api-client", "config"),
    ("auth", "crypto"), ("auth", "config"), ("auth", "cache"),
    ("renderer", "svg-utils"), ("renderer", "config"),
    ("http", "logging"), ("crypto", "logging"), ("cache", "logging"),
    ("svg-utils", "json"), ("config", "logging"), ("json", "logging"),
]

# --- Hierarchical layout ------------------------------------------------------
# NetworkLayout.jl is not part of this catalog's Julia environment, so the
# layer assignment is computed directly: each node's layer is the length of
# the longest dependency chain reaching it, found by relaxing edges to a
# fixpoint (a tiny Bellman-Ford variant — the dependency graph is a DAG, so
# this always converges). Nodes with no incoming edges anchor layer 0.
layer = Dict(n => 0 for n in nodes)
changed = true
while changed
    global changed = false
    for (src, dst) in edges
        if layer[dst] < layer[src] + 1
            layer[dst] = layer[src] + 1
            global changed = true
        end
    end
end

n_layers = maximum(values(layer)) + 1
layer_nodes = [String[] for _ in 1:n_layers]
for n in nodes
    push!(layer_nodes[layer[n]+1], n)
end

indegree = Dict(n => 0 for n in nodes)
for (_, dst) in edges
    indegree[dst] += 1
end

# Barycenter crossing-minimization: repeatedly reorder each layer by the mean
# position of its neighbors, alternating downward/upward sweeps (Sugiyama-style).
# This is what pulls "auth"/"renderer" and their fan-out into straighter columns
# instead of the crossing tangle the review flagged.
neighbors = Dict(n => String[] for n in nodes)
for (src, dst) in edges
    push!(neighbors[src], dst)
    push!(neighbors[dst], src)
end

order_x = Dict{String,Float64}(n => Float64(j) for ns in layer_nodes for (j, n) in enumerate(ns))
for iter in 1:6
    layer_order = isodd(iter) ? (1:n_layers) : reverse(1:n_layers)
    for li in layer_order
        ns = layer_nodes[li]
        length(ns) <= 1 && continue
        bary = Dict(n => begin
            xs = [order_x[m] for m in neighbors[n]]
            isempty(xs) ? order_x[n] : sum(xs) / length(xs)
        end for n in ns)
        sort!(ns, by=n -> bary[n])
        for (j, n) in enumerate(ns)
            order_x[n] = Float64(j)
        end
    end
end

layer_spacing = 2.4
node_spacing = 2.2
pos = Dict{String,Point2f}()
for (li, ns) in enumerate(layer_nodes)
    k = length(ns)
    y = (n_layers - li) * layer_spacing
    for (j, n) in enumerate(ns)
        x = (j - (k + 1) / 2) * node_spacing
        pos[n] = Point2f(x, y)
    end
end

marker_size(n) = 26.0f0 + 6.0f0 * indegree[n]
node_radius(n) = 0.16 + 0.006 * marker_size(n)  # data-space clearance so arrows stop at the node edge

tier_labels = ["Applications", "Services", "Infrastructure/utilities", "Data format", "Core"]
node_color(n) = IMPRINT_PALETTE[min(layer[n] + 1, length(IMPRINT_PALETTE))]

# --- Plot ----------------------------------------------------------------------
fig = Figure(
    size=(1200, 1200),
    fontsize=14,
    backgroundcolor=PAGE_BG,
)

ax = Axis(
    fig[1, 1];
    title="network-directed · julia · makie · anyplot.ai",
    titlesize=20,
    titlecolor=INK,
    backgroundcolor=PAGE_BG,
    aspect=DataAspect(),
)
hidedecorations!(ax)
hidespines!(ax)
limits!(ax, -5.2, 5.2, -1.0, 10.2)

# Move `from` toward `to` by clearance `r` (data units) — keeps arrow shafts
# and heads from disappearing under the node markers they connect.
function pull_in(from::Point2f, to::Point2f, r)
    d = to - from
    u = d / hypot(d[1], d[2])
    from + u * Float32(r)
end

function draw_arrow!(ax, src::String, dst::String; waypoint::Union{Point2f,Nothing}=nothing)
    if waypoint === nothing
        tail = pull_in(pos[src], pos[dst], node_radius(src))
    else
        tail = waypoint
        start = pull_in(pos[src], waypoint, node_radius(src))
        lines!(ax, [start, waypoint]; color=EDGE_COLOR, linewidth=2.0)
    end
    head = pull_in(pos[dst], tail, node_radius(dst))
    arrows!(ax, [tail], [head - tail]; color=EDGE_COLOR, linewidth=2.0, arrowsize=15)
end

# The one long-range dependency (cli → logging) is routed around the middle
# tiers with a dog-leg instead of a straight line, so it doesn't cut through
# unrelated nodes — the "curved edges to avoid overlap" case from the spec.
skip_edge = ("cli", "logging")
waypoint = Point2f(5.0, 4.8)

for (src, dst) in edges
    if (src, dst) == skip_edge
        draw_arrow!(ax, src, dst; waypoint=waypoint)
    else
        draw_arrow!(ax, src, dst)
    end
end

for n in nodes
    scatter!(ax, [pos[n]]; color=node_color(n), markersize=marker_size(n), strokewidth=0)
end

# Labels sit below each node rather than inside it — several ids ("api-client",
# "svg-utils") are wider than even the largest marker and would get clipped.
for n in nodes
    label_pos = pos[n] - Point2f(0, node_radius(n) + 0.16)
    text!(ax, label_pos; text=n, color=INK, fontsize=13, align=(:center, :top))
end

legend_elements = [MarkerElement(color=IMPRINT_PALETTE[i], marker=:circle, markersize=14) for i in 1:n_layers]
Legend(fig[2, 1], legend_elements, tier_labels[1:n_layers];
    orientation=:horizontal, framevisible=false, labelcolor=INK, nbanks=2)
rowgap!(fig.layout, 0)
rowsize!(fig.layout, 2, Auto(0.05))

# --- Save ------------------------------------------------------------------
save("plot-$(THEME).png", fig; px_per_unit=2)
Runnable source as JSON, for any HTTP client: https://api.anyplot.ai/specs/network-directed/makie/code. Any spec id and library id listed in llms-full.txt fit the same URL shape; every URL below is complete and callable.
{
  "spec_id": "network-directed",
  "language": "julia",
  "library": "makie",
  "page": "https://anyplot.ai/network-directed/julia/makie",
  "hub": "https://anyplot.ai/network-directed",
  "code_json": "https://api.anyplot.ai/specs/network-directed/makie/code",
  "spec_json": "https://api.anyplot.ai/specs/network-directed",
  "render_light_png": "https://storage.googleapis.com/anyplot-images/plots/network-directed/julia/makie/plot-light.png",
  "render_dark_png": "https://storage.googleapis.com/anyplot-images/plots/network-directed/julia/makie/plot-dark.png",
  "quality_score": 91.0,
  "license": "MIT",
  "guide": "https://anyplot.ai/llms.txt"
}
Part of Directed Network Graph on anyplot.ai.