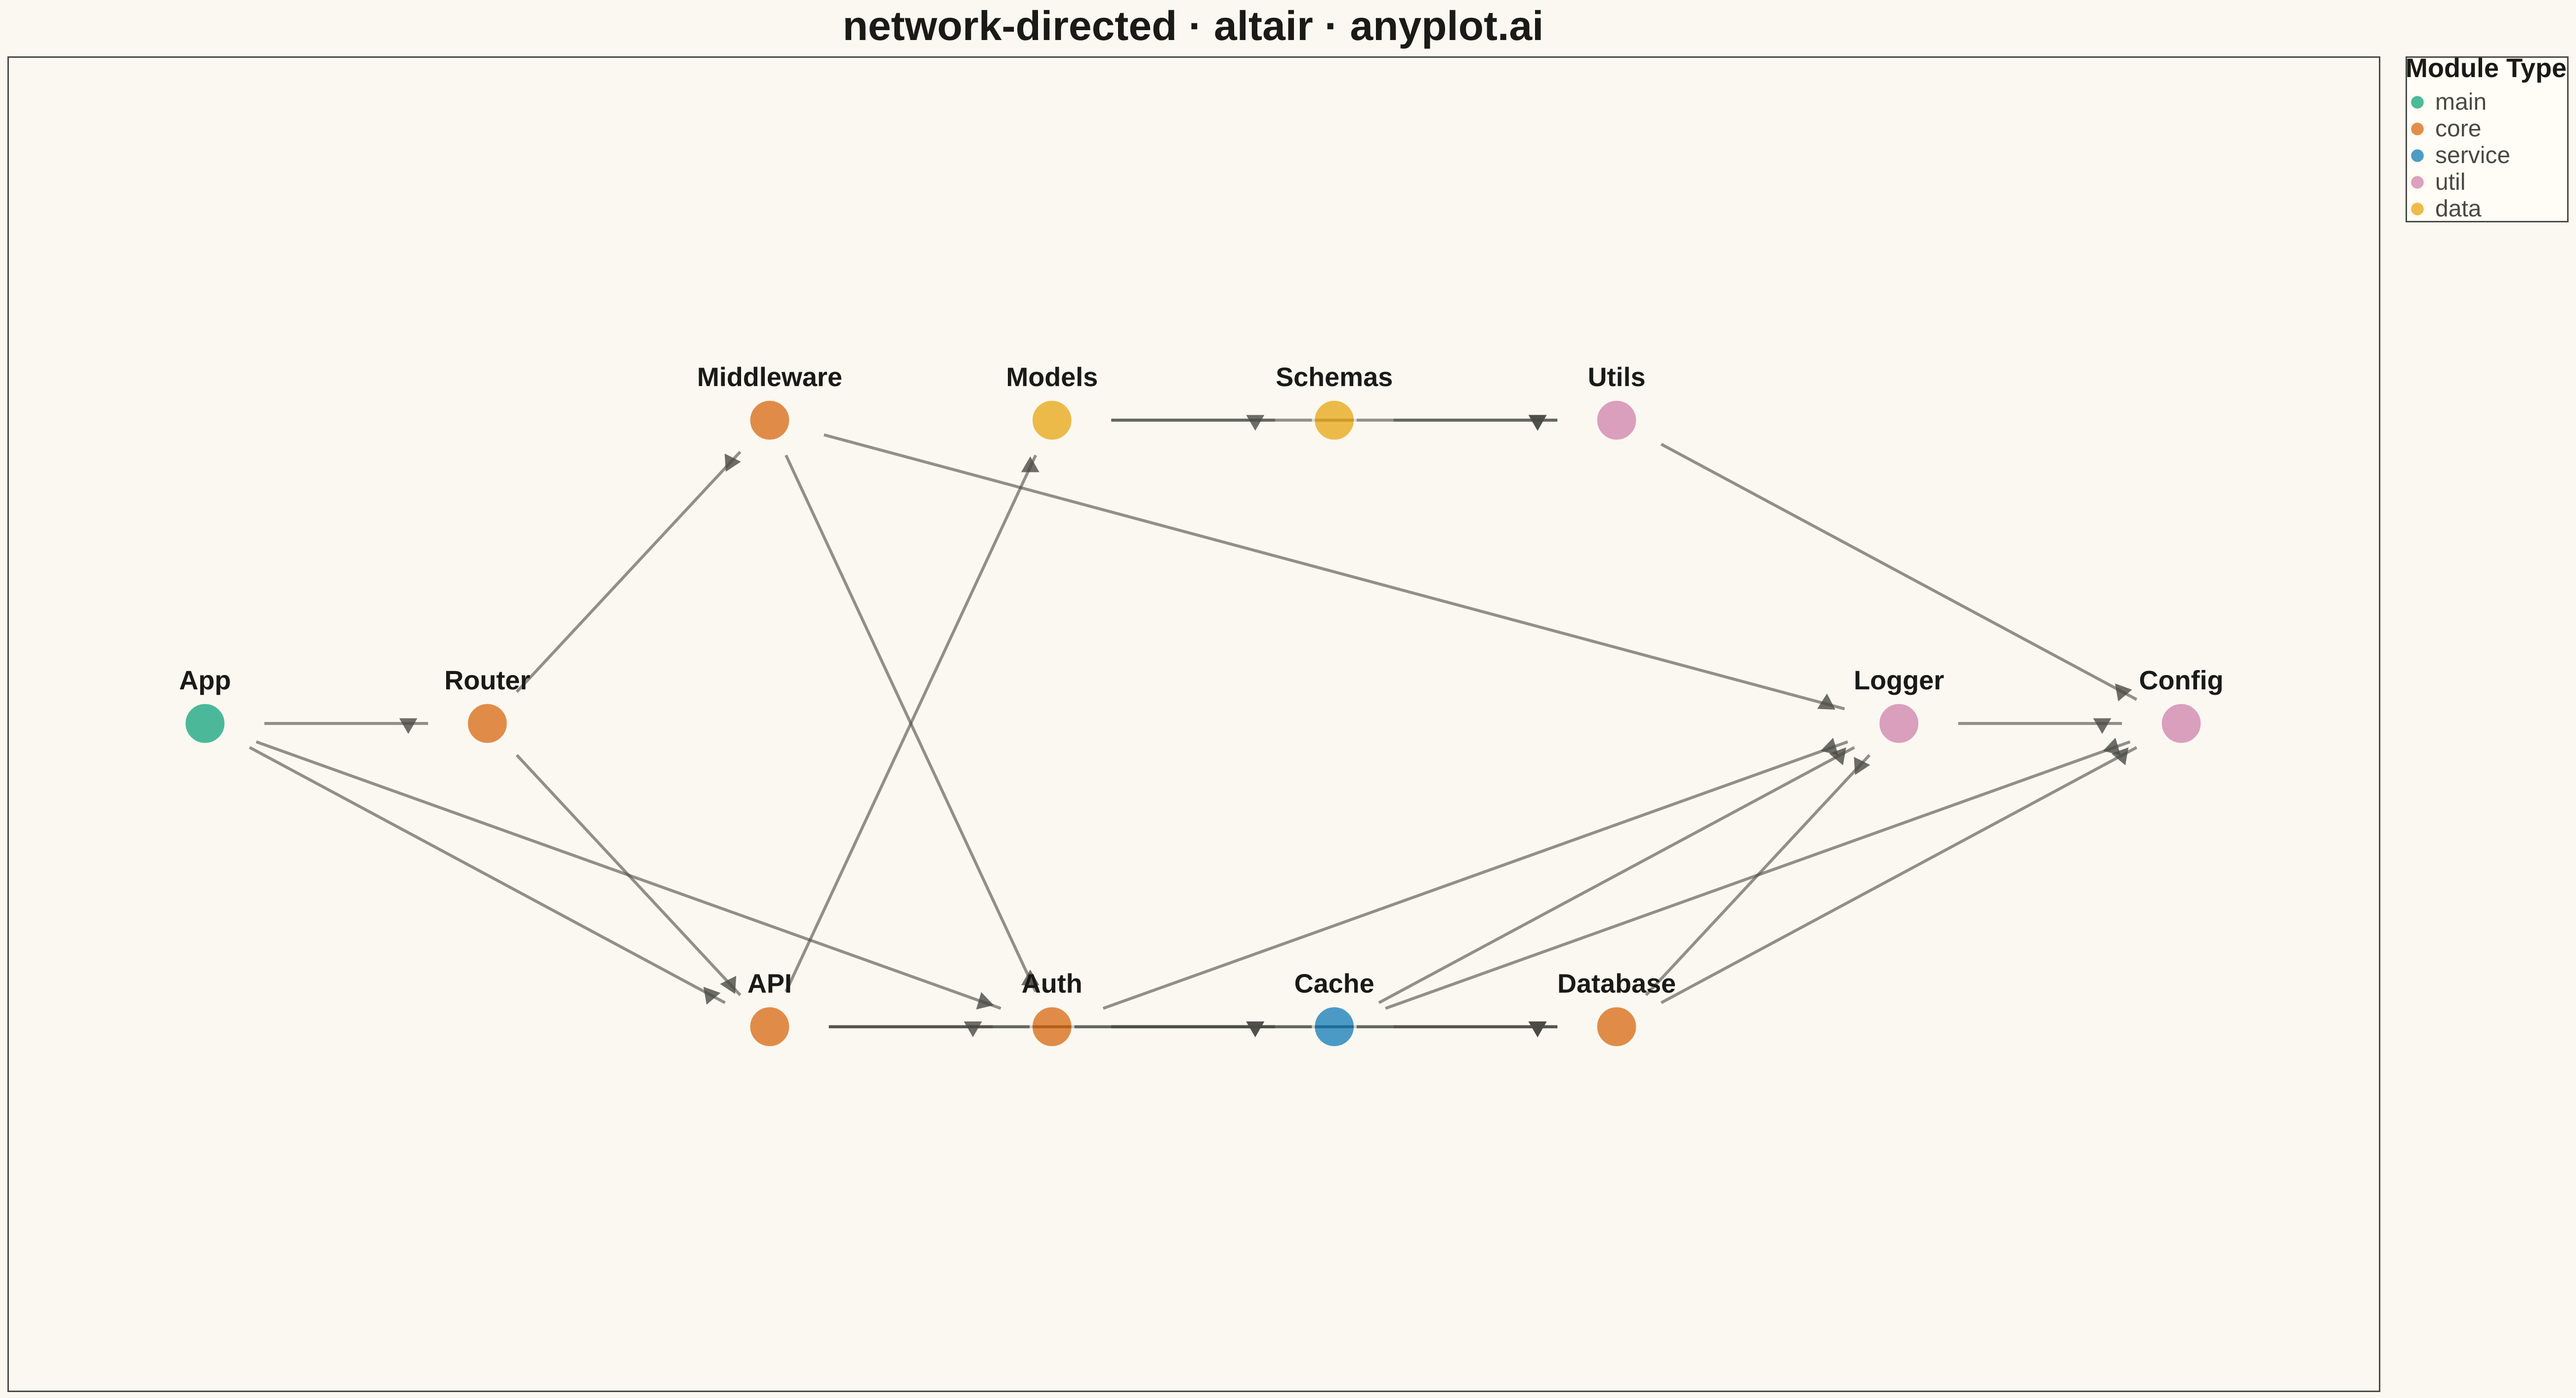
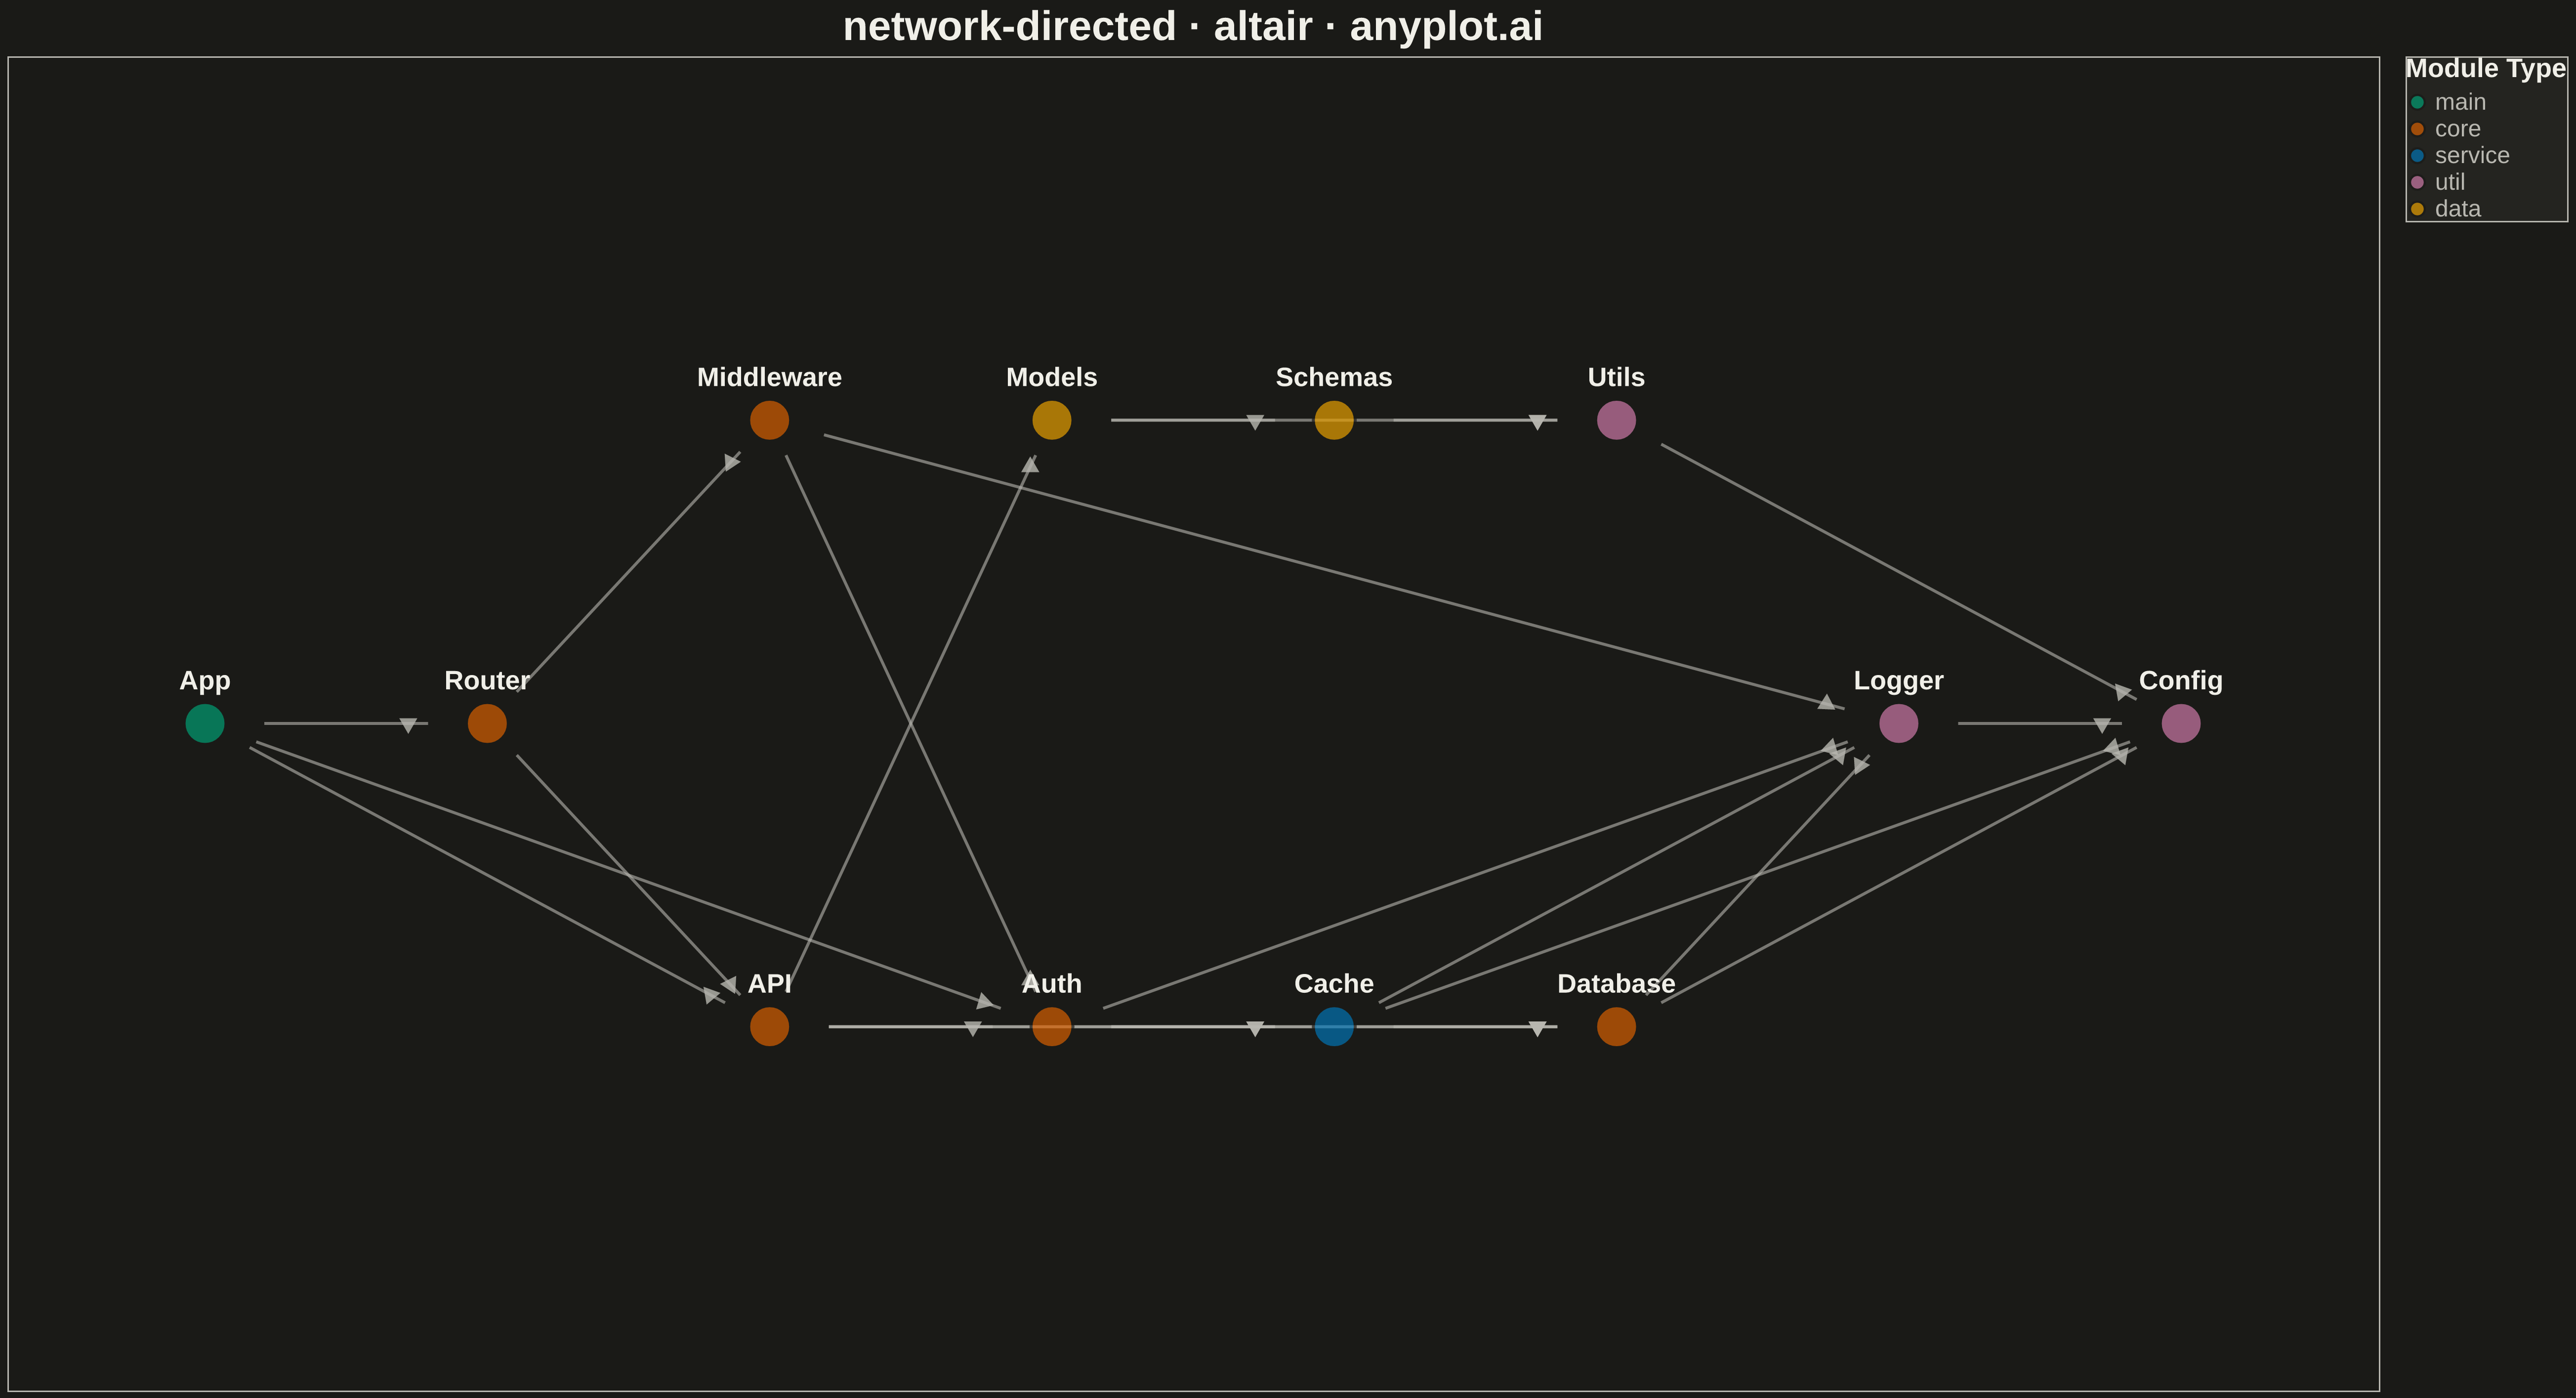
A directed network graph visualizes relationships between entities using nodes connected by edges with arrows, indicating the direction of relationships or flow. Unlike undirected graphs, directed graphs reveal asymmetric relationships such as dependencies, hierarchies, or information flow. The arrows clearly communicate which entity points to which, making cause-and-effect relationships and directional dependencies immediately visible.
""" anyplot.ai
network-directed: Directed Network Graph
Library: altair 6.1.0 | Python 3.13.13
Quality: 92/100 | Updated: 2026-05-14
"""

import os
import sys
from pathlib import Path


# Avoid name collision with script file named altair.py
script_dir = str(Path(__file__).parent)
if script_dir in sys.path:
    sys.path.remove(script_dir)

import altair as alt
import numpy as np
import pandas as pd


# Theme tokens
THEME = os.getenv("ANYPLOT_THEME", "light")
PAGE_BG = "#FAF8F1" if THEME == "light" else "#1A1A17"
ELEVATED_BG = "#FFFDF6" if THEME == "light" else "#242420"
INK = "#1A1A17" if THEME == "light" else "#F0EFE8"
INK_SOFT = "#4A4A44" if THEME == "light" else "#B8B7B0"

np.random.seed(42)

# Data: Software package dependency graph
nodes = [
    {"id": "app", "label": "App", "group": "main"},
    {"id": "api", "label": "API", "group": "core"},
    {"id": "auth", "label": "Auth", "group": "core"},
    {"id": "database", "label": "Database", "group": "core"},
    {"id": "cache", "label": "Cache", "group": "service"},
    {"id": "logger", "label": "Logger", "group": "util"},
    {"id": "config", "label": "Config", "group": "util"},
    {"id": "utils", "label": "Utils", "group": "util"},
    {"id": "models", "label": "Models", "group": "data"},
    {"id": "schemas", "label": "Schemas", "group": "data"},
    {"id": "router", "label": "Router", "group": "core"},
    {"id": "middleware", "label": "Middleware", "group": "core"},
]

# Directed edges: (source, target) - arrows point from source to target
edges = [
    ("app", "api"),
    ("app", "auth"),
    ("app", "router"),
    ("api", "database"),
    ("api", "cache"),
    ("api", "models"),
    ("auth", "database"),
    ("auth", "cache"),
    ("auth", "logger"),
    ("database", "config"),
    ("database", "logger"),
    ("cache", "config"),
    ("cache", "logger"),
    ("router", "middleware"),
    ("router", "api"),
    ("middleware", "auth"),
    ("middleware", "logger"),
    ("models", "schemas"),
    ("models", "utils"),
    ("schemas", "utils"),
    ("logger", "config"),
    ("utils", "config"),
    ("api", "auth"),
    ("cache", "database"),
]

# Okabe-Ito palette for groups
IMPRINT = ["#009E73", "#C475FD", "#4467A3", "#BD8233", "#AE3030", "#2ABCCD"]
group_colors = {
    "main": IMPRINT[0],  # Brand green
    "core": IMPRINT[1],  # Vermillion
    "service": IMPRINT[2],  # Blue
    "util": IMPRINT[3],  # Reddish purple
    "data": IMPRINT[4],  # Orange
}

# Node positions using hierarchical layout based on dependency depth
depths = {"app": 0}
for _ in range(len(nodes)):
    for source, target in edges:
        if source in depths:
            current_depth = depths.get(target, -1)
            depths[target] = max(current_depth, depths[source] + 1)

for node in nodes:
    if node["id"] not in depths:
        depths[node["id"]] = 0

depth_groups = {}
for node_id, depth in depths.items():
    if depth not in depth_groups:
        depth_groups[depth] = []
    depth_groups[depth].append(node_id)

positions = {}
max_depth = max(depths.values()) if depths else 0
for depth, node_ids in depth_groups.items():
    n_nodes = len(node_ids)
    for i, node_id in enumerate(node_ids):
        x = depth / max(max_depth, 1)
        y = (i + 0.5) / n_nodes
        positions[node_id] = (x, y)

# Create node DataFrame
node_df = pd.DataFrame(
    [
        {
            "id": n["id"],
            "label": n["label"],
            "group": n["group"],
            "x": positions[n["id"]][0],
            "y": positions[n["id"]][1],
        }
        for n in nodes
    ]
)

# Identify bidirectional edge pairs
edge_set = set(edges)
bidirectional_pairs = set()
for source, target in edges:
    if (target, source) in edge_set:
        bidirectional_pairs.add(tuple(sorted([source, target])))

# Create edge DataFrame with arrow coordinates
edge_data = []
curved_edge_data = []
for source, target in edges:
    sx, sy = positions[source]
    tx, ty = positions[target]

    is_bidirectional = tuple(sorted([source, target])) in bidirectional_pairs

    dx, dy = tx - sx, ty - sy
    length = np.sqrt(dx**2 + dy**2)
    if length > 0:
        offset = 0.03
        sx_adj = sx + dx / length * offset
        sy_adj = sy + dy / length * offset
        tx_adj = tx - dx / length * offset
        ty_adj = ty - dy / length * offset
    else:
        sx_adj, sy_adj = sx, sy
        tx_adj, ty_adj = tx, ty

    if is_bidirectional:
        perp_x, perp_y = -dy / length * 0.05, dx / length * 0.05
        mid_x, mid_y = (sx + tx) / 2 + perp_x, (sy + ty) / 2 + perp_y

        for t in np.linspace(0, 1, 10):
            t_next = min(t + 0.1, 1)
            bx1 = (1 - t) ** 2 * sx_adj + 2 * (1 - t) * t * mid_x + t**2 * tx_adj
            by1 = (1 - t) ** 2 * sy_adj + 2 * (1 - t) * t * mid_y + t**2 * ty_adj
            bx2 = (1 - t_next) ** 2 * sx_adj + 2 * (1 - t_next) * t_next * mid_x + t_next**2 * tx_adj
            by2 = (1 - t_next) ** 2 * sy_adj + 2 * (1 - t_next) * t_next * mid_y + t_next**2 * ty_adj
            curved_edge_data.append({"x": bx1, "y": by1, "x2": bx2, "y2": by2, "edge_id": f"{source}-{target}"})
    else:
        edge_data.append({"source": source, "target": target, "x": sx_adj, "y": sy_adj, "x2": tx_adj, "y2": ty_adj})

edge_df = pd.DataFrame(edge_data)
curved_edge_df = pd.DataFrame(curved_edge_data) if curved_edge_data else pd.DataFrame(columns=["x", "y", "x2", "y2"])

# Create arrow head data
arrow_data = []
for source, target in edges:
    sx, sy = positions[source]
    tx, ty = positions[target]

    dx, dy = tx - sx, ty - sy
    length = np.sqrt(dx**2 + dy**2)
    if length > 0:
        is_bidirectional = tuple(sorted([source, target])) in bidirectional_pairs

        if is_bidirectional:
            perp_x, perp_y = -dy / length * 0.05, dx / length * 0.05
            mid_x, mid_y = (sx + tx) / 2 + perp_x, (sy + ty) / 2 + perp_y

            t = 0.95
            offset = 0.03
            sx_adj = sx + dx / length * offset
            sy_adj = sy + dy / length * offset
            tx_adj = tx - dx / length * offset
            ty_adj = ty - dy / length * offset

            ax = (1 - t) ** 2 * sx_adj + 2 * (1 - t) * t * mid_x + t**2 * tx_adj
            ay = (1 - t) ** 2 * sy_adj + 2 * (1 - t) * t * mid_y + t**2 * ty_adj

            t_prev = 0.9
            ax_prev = (1 - t_prev) ** 2 * sx_adj + 2 * (1 - t_prev) * t_prev * mid_x + t_prev**2 * tx_adj
            ay_prev = (1 - t_prev) ** 2 * sy_adj + 2 * (1 - t_prev) * t_prev * mid_y + t_prev**2 * ty_adj
            angle = np.degrees(np.arctan2(ay - ay_prev, ax - ax_prev))
        else:
            offset = 0.04
            ax = tx - dx / length * offset
            ay = ty - dy / length * offset
            angle = np.degrees(np.arctan2(dy, dx))

        arrow_data.append({"x": ax, "y": ay, "angle": angle})

arrow_df = pd.DataFrame(arrow_data)

# Add colors to node dataframe
node_df["color"] = node_df["group"].map(group_colors)

# Create the visualization
edges_chart = (
    alt.Chart(edge_df)
    .mark_rule(strokeWidth=2, opacity=0.6, color=INK_SOFT)
    .encode(
        x=alt.X("x:Q", scale=alt.Scale(domain=[-0.1, 1.1]), axis=None),
        y=alt.Y("y:Q", scale=alt.Scale(domain=[-0.05, 1.05]), axis=None),
        x2="x2:Q",
        y2="y2:Q",
    )
)

curved_edges_chart = (
    alt.Chart(curved_edge_df)
    .mark_rule(strokeWidth=2, opacity=0.6, color=INK_SOFT)
    .encode(
        x=alt.X("x:Q", scale=alt.Scale(domain=[-0.1, 1.1]), axis=None),
        y=alt.Y("y:Q", scale=alt.Scale(domain=[-0.05, 1.05]), axis=None),
        x2="x2:Q",
        y2="y2:Q",
    )
)

# Arrow heads as triangular points
arrows_chart = (
    alt.Chart(arrow_df)
    .mark_point(shape="triangle", size=150, filled=True, color=INK_SOFT, opacity=0.8)
    .encode(
        x=alt.X("x:Q", scale=alt.Scale(domain=[-0.1, 1.1])),
        y=alt.Y("y:Q", scale=alt.Scale(domain=[-0.05, 1.05])),
        angle=alt.Angle("angle:Q"),
    )
)

# Nodes as circles
nodes_chart = (
    alt.Chart(node_df)
    .mark_circle(size=800, stroke=PAGE_BG, strokeWidth=2)
    .encode(
        x=alt.X("x:Q", scale=alt.Scale(domain=[-0.1, 1.1])),
        y=alt.Y("y:Q", scale=alt.Scale(domain=[-0.05, 1.05])),
        color=alt.Color(
            "group:N",
            scale=alt.Scale(domain=list(group_colors.keys()), range=list(group_colors.values())),
            legend=alt.Legend(title="Module Type", titleFontSize=18, labelFontSize=16, orient="right"),
        ),
        tooltip=["label:N", "group:N"],
    )
)

# Node labels
labels_chart = (
    alt.Chart(node_df)
    .mark_text(fontSize=18, fontWeight="bold", dy=-28, color=INK)
    .encode(
        x=alt.X("x:Q", scale=alt.Scale(domain=[-0.1, 1.1])),
        y=alt.Y("y:Q", scale=alt.Scale(domain=[-0.05, 1.05])),
        text="label:N",
    )
)

# Combine all layers
chart = (
    (edges_chart + curved_edges_chart + arrows_chart + nodes_chart + labels_chart)
    .properties(
        width=1600,
        height=900,
        background=PAGE_BG,
        title=alt.Title(text="network-directed · altair · anyplot.ai", fontSize=28, anchor="middle", color=INK),
    )
    .configure_view(fill=PAGE_BG, stroke=INK_SOFT)
    .configure_legend(fillColor=ELEVATED_BG, strokeColor=INK_SOFT, labelColor=INK_SOFT, titleColor=INK)
)

# Save as PNG and HTML
script_dir = Path(__file__).parent
output_png = script_dir / f"plot-{THEME}.png"
output_html = script_dir / f"plot-{THEME}.html"
chart.save(str(output_png), scale_factor=3.0)
chart.save(str(output_html))
Runnable source as JSON, for any HTTP client: https://api.anyplot.ai/specs/network-directed/altair/code. Any spec id and library id listed in llms-full.txt fit the same URL shape; every URL below is complete and callable.
{
  "spec_id": "network-directed",
  "language": "python",
  "library": "altair",
  "page": "https://anyplot.ai/network-directed/python/altair",
  "hub": "https://anyplot.ai/network-directed",
  "code_json": "https://api.anyplot.ai/specs/network-directed/altair/code",
  "spec_json": "https://api.anyplot.ai/specs/network-directed",
  "render_light_png": "https://storage.googleapis.com/anyplot-images/plots/network-directed/python/altair/plot-light.png",
  "render_dark_png": "https://storage.googleapis.com/anyplot-images/plots/network-directed/python/altair/plot-dark.png",
  "interactive_light_html": "https://storage.googleapis.com/anyplot-images/plots/network-directed/python/altair/plot-light.html",
  "interactive_dark_html": "https://storage.googleapis.com/anyplot-images/plots/network-directed/python/altair/plot-dark.html",
  "quality_score": 92.0,
  "license": "MIT",
  "guide": "https://anyplot.ai/llms.txt"
}
Part of Directed Network Graph on anyplot.ai.