The same plot in 14 other libraries — Python: Altair, Bokeh, lets-plot, Matplotlib, Plotly, plotnine, Pygal, Seaborn; Julia: Makie.jl; JavaScript: Chart.js, D3.js, Apache ECharts, Highcharts, MUI X Charts. Compare all 15 side by side: Directed Network Graph in Python, R, Julia and JavaScript.
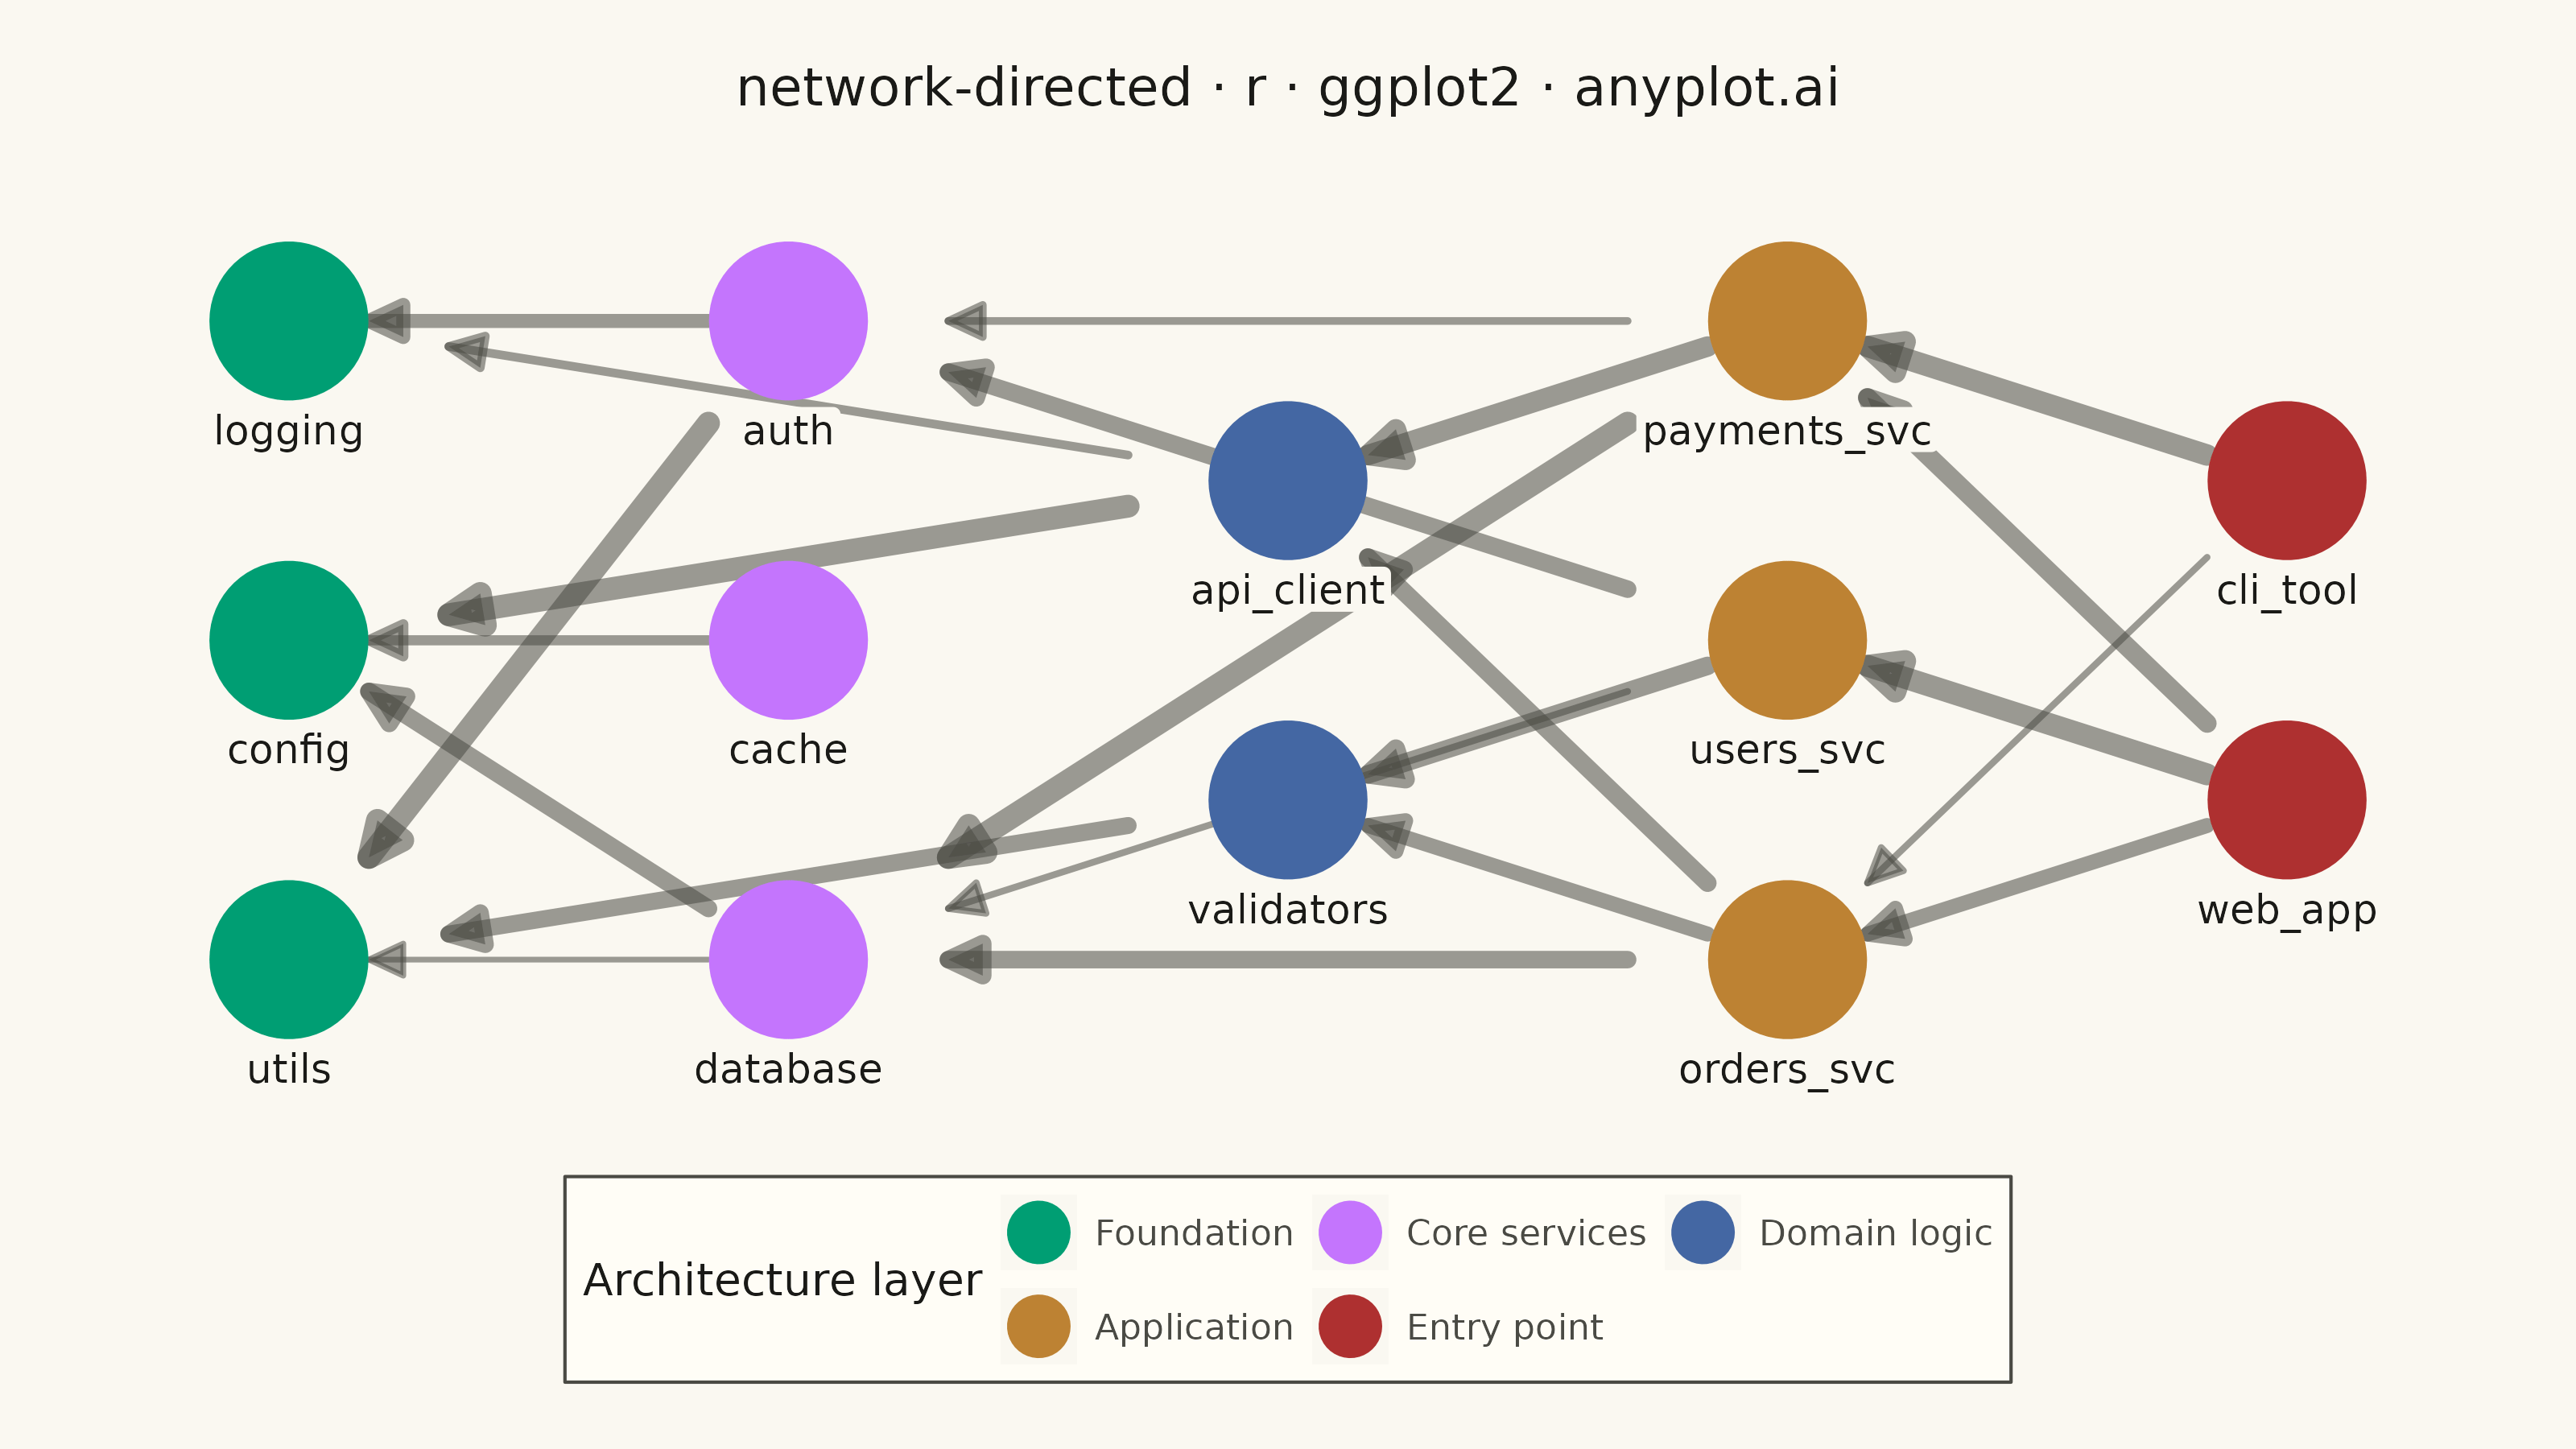
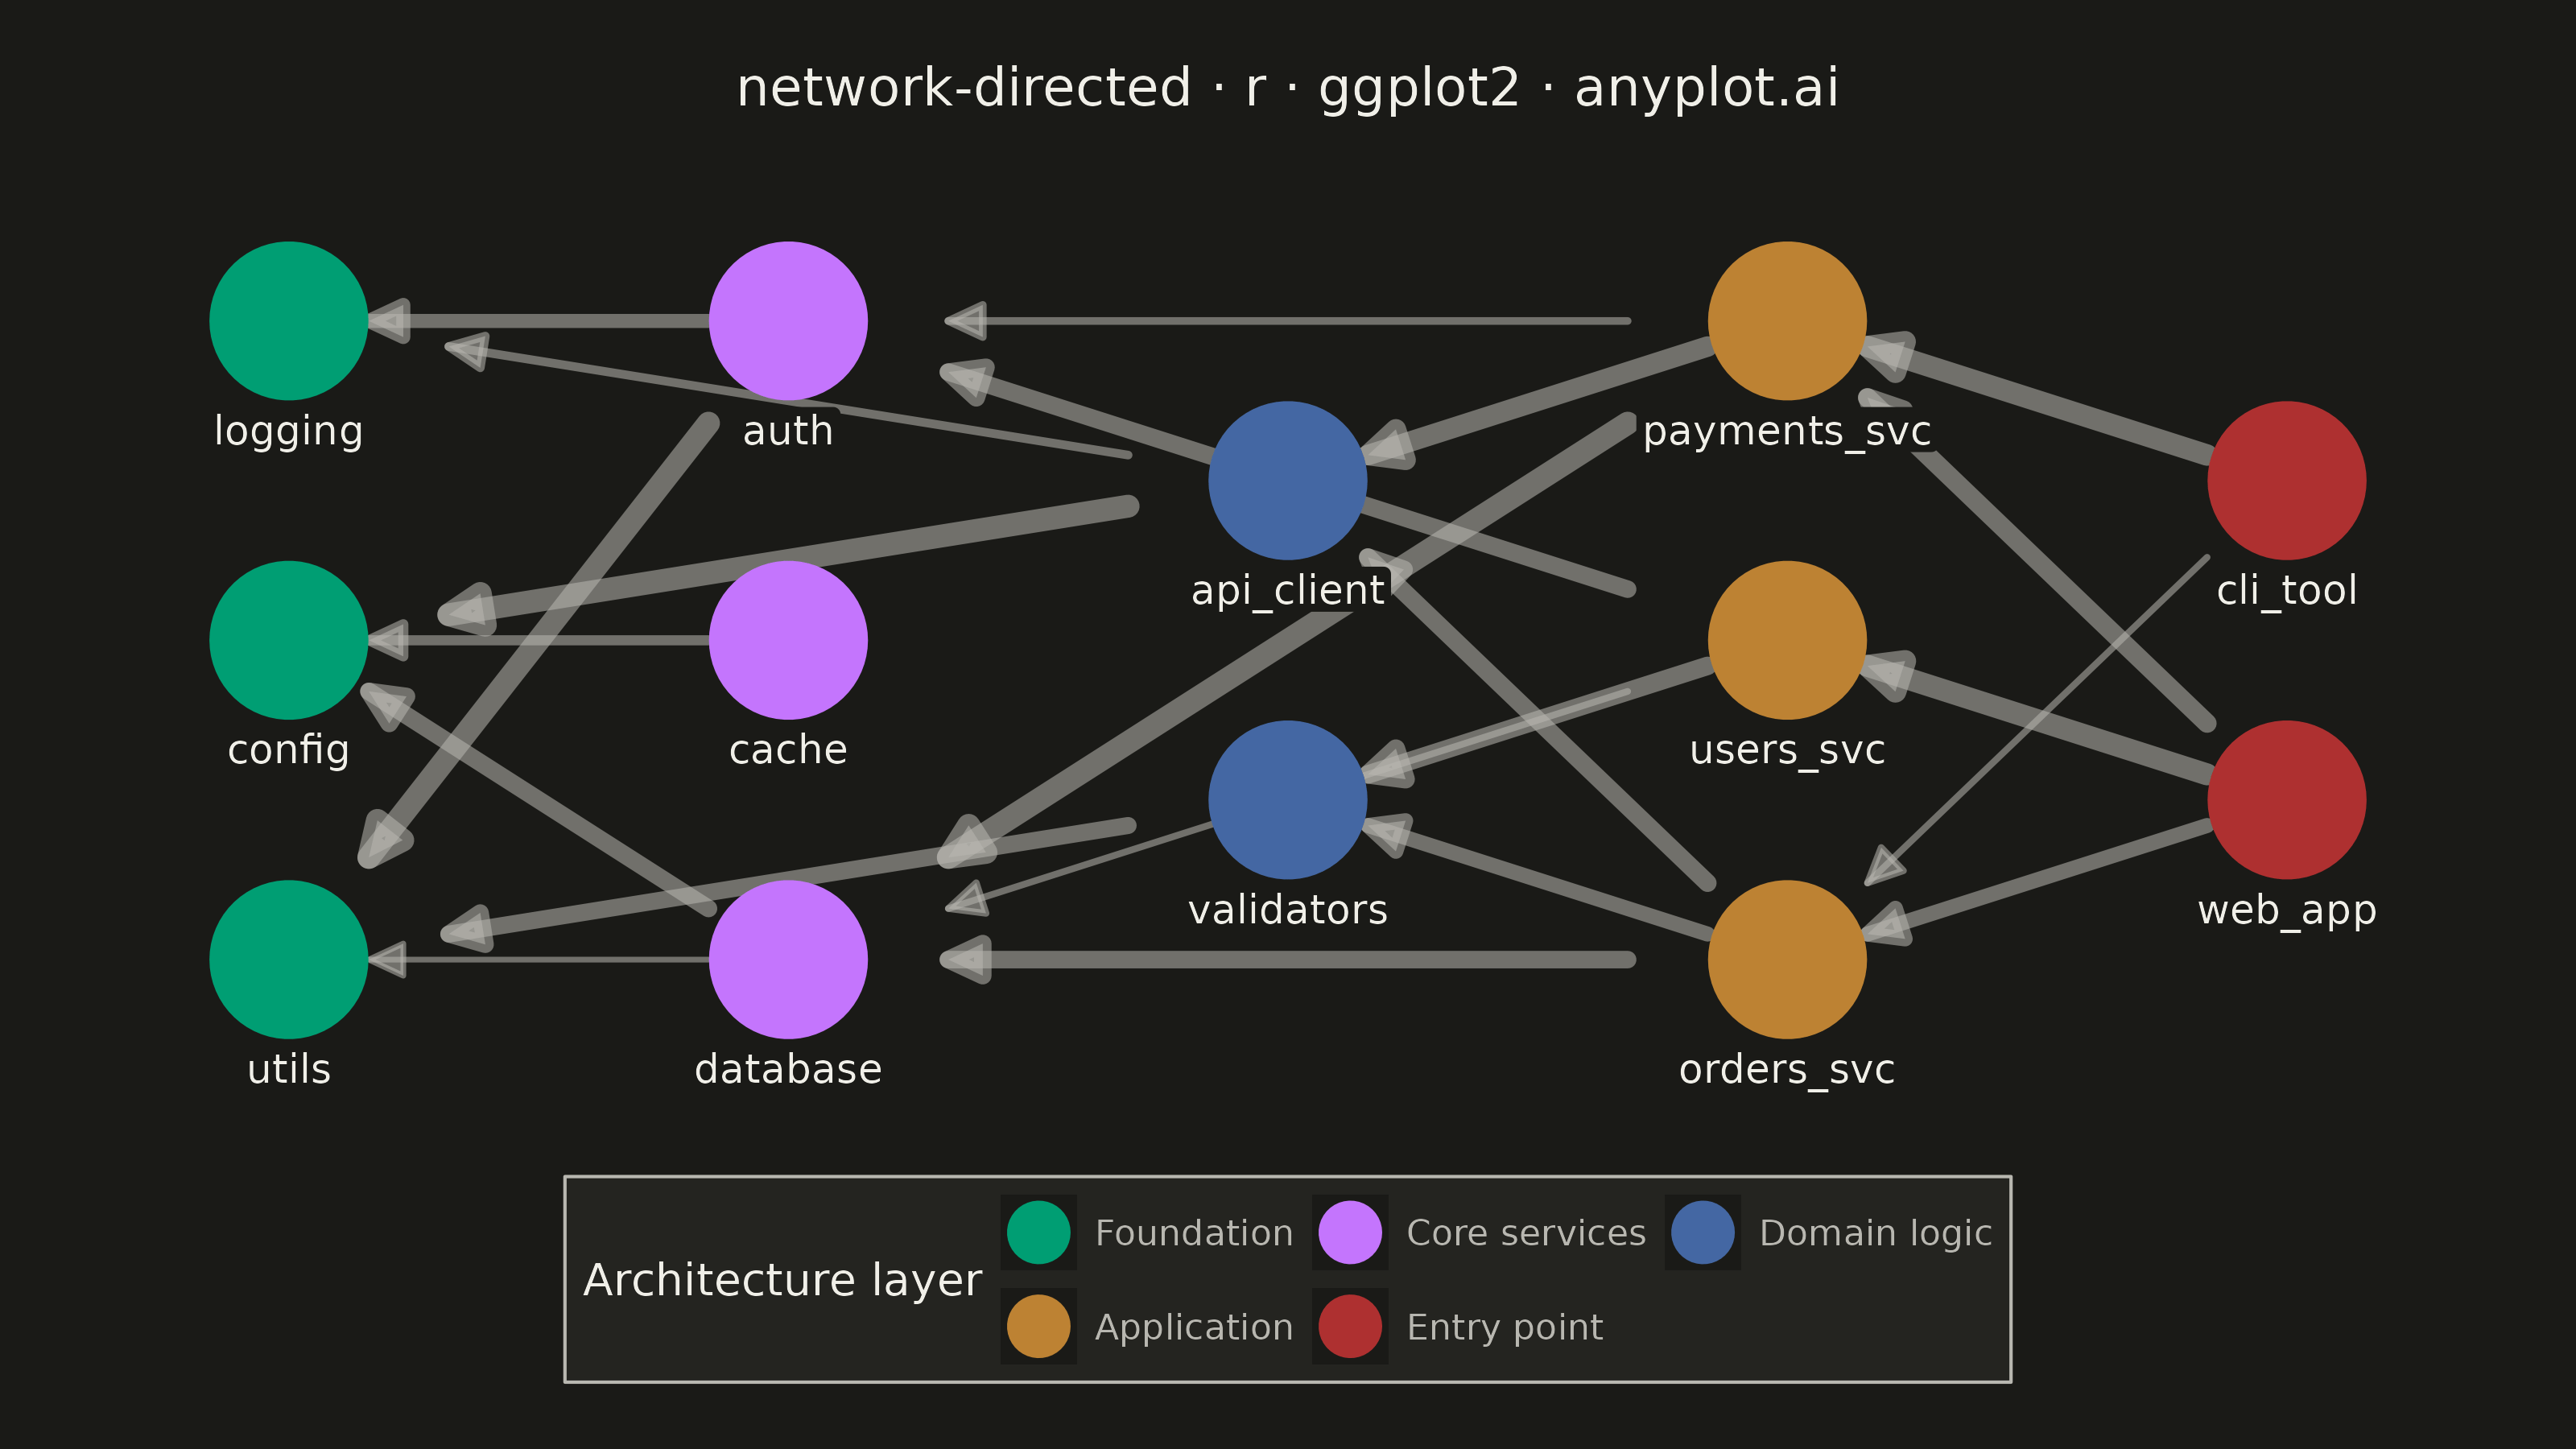
A directed network graph visualizes relationships between entities using nodes connected by edges with arrows, indicating the direction of relationships or flow. Unlike undirected graphs, directed graphs reveal asymmetric relationships such as dependencies, hierarchies, or information flow. The arrows clearly communicate which entity points to which, making cause-and-effect relationships and directional dependencies immediately visible.
#' anyplot.ai
#' network-directed: Directed Network Graph
#' Library: ggplot2 3.5.1 | R 4.4.1
#' Quality: 82/100 | Created: 2026-09-05

library(ggplot2)
library(dplyr)
library(tibble)
library(ragg)

set.seed(42)

# --- Theme tokens -------------------------------------------------------
THEME       <- Sys.getenv("ANYPLOT_THEME", "light")
PAGE_BG     <- if (THEME == "light") "#FAF8F1" else "#1A1A17"
ELEVATED_BG <- if (THEME == "light") "#FFFDF6" else "#242420"
INK         <- if (THEME == "light") "#1A1A17" else "#F0EFE8"
INK_SOFT    <- if (THEME == "light") "#4A4A44" else "#B8B7B0"
IMPRINT_PALETTE <- c("#009E73", "#C475FD", "#4467A3", "#BD8233", "#AE3030")

# --- Data: a software package dependency graph, laid out in layers ------
# layer 0 = foundational packages, layer 4 = application entry points.
# An edge (from -> to) means "from" imports "to".
group_names <- c(
  "0" = "Foundation", "1" = "Core services", "2" = "Domain logic",
  "3" = "Application", "4" = "Entry point"
)

nodes <- tribble(
  ~id,             ~layer, ~y,
  "utils",              0,   -1,
  "config",             0,    0,
  "logging",            0,    1,
  "database",           1,   -1,
  "cache",              1,    0,
  "auth",               1,    1,
  "validators",         2, -0.7,
  "api_client",         2,  0.7,
  "orders_svc",         3,   -1,
  "users_svc",          3,    0,
  "payments_svc",       3,    1,
  "web_app",            4, -0.5,
  "cli_tool",           4,  0.5
) %>%
  mutate(
    x     = layer,
    group = factor(group_names[as.character(layer)], levels = group_names)
  )

edges <- tribble(
  ~from,           ~to,
  "database",      "utils",
  "database",      "config",
  "cache",         "config",
  "auth",          "utils",
  "auth",          "logging",
  "validators",    "utils",
  "api_client",    "logging",
  "api_client",    "config",
  "orders_svc",    "database",
  "orders_svc",    "validators",
  "orders_svc",    "api_client",
  "users_svc",     "database",
  "users_svc",     "auth",
  "users_svc",     "validators",
  "payments_svc",  "database",
  "payments_svc",  "api_client",
  "payments_svc",  "auth",
  "web_app",       "orders_svc",
  "web_app",       "users_svc",
  "web_app",       "payments_svc",
  "cli_tool",      "orders_svc",
  "cli_tool",      "payments_svc"
) %>%
  mutate(calls_per_day = sample(5:40, n(), replace = TRUE))

# Trim each edge toward the node radius so the arrowhead lands just short
# of the target circle instead of disappearing underneath it.
trim_frac <- 0.16
edge_coords <- edges %>%
  left_join(nodes %>% select(id, x, y), by = c("from" = "id")) %>%
  rename(x0 = x, y0 = y) %>%
  left_join(nodes %>% select(id, x, y), by = c("to" = "id")) %>%
  rename(x1 = x, y1 = y) %>%
  mutate(
    xs = x0 + trim_frac * (x1 - x0),
    ys = y0 + trim_frac * (y1 - y0),
    xe = x1 - trim_frac * (x1 - x0),
    ye = y1 - trim_frac * (y1 - y0),
    # Long edges that skip the layer-2 column (validators/api_client) and
    # travel diagonally cut straight through those nodes' positions. Bow
    # just those three edges out of the way; everything else stays a
    # straight segment so the layout itself is untouched.
    curvature = case_when(
      from == "users_svc"    & to == "auth"     ~ -0.35,
      from == "users_svc"    & to == "database" ~  0.35,
      from == "payments_svc" & to == "database" ~  0.35,
      TRUE ~ 0
    )
  )

straight_edges <- filter(edge_coords, curvature == 0)
curved_pos     <- filter(edge_coords, curvature > 0)
curved_neg     <- filter(edge_coords, curvature < 0)

edge_arrow <- arrow(length = unit(3, "mm"), type = "closed", angle = 25)

# --- Plot ----------------------------------------------------------------
p <- ggplot() +
  geom_segment(
    data = straight_edges,
    aes(x = xs, y = ys, xend = xe, yend = ye, linewidth = calls_per_day),
    color = INK_SOFT, alpha = 0.6, lineend = "round", arrow = edge_arrow
  ) +
  geom_curve(
    data = curved_pos,
    aes(x = xs, y = ys, xend = xe, yend = ye, linewidth = calls_per_day),
    color = INK_SOFT, alpha = 0.6, lineend = "round", arrow = edge_arrow,
    curvature = 0.35
  ) +
  geom_curve(
    data = curved_neg,
    aes(x = xs, y = ys, xend = xe, yend = ye, linewidth = calls_per_day),
    color = INK_SOFT, alpha = 0.6, lineend = "round", arrow = edge_arrow,
    curvature = -0.35
  ) +
  scale_linewidth(range = c(0.5, 2.2), guide = "none") +
  geom_point(
    data = nodes, aes(x = x, y = y, color = group),
    size = 16
  ) +
  geom_label(
    data = nodes, aes(x = x, y = y - 0.34, label = id),
    size = 3.2, color = INK, fill = PAGE_BG, label.size = 0,
    label.padding = unit(0.12, "lines")
  ) +
  scale_color_manual(values = IMPRINT_PALETTE, name = "Architecture layer") +
  guides(color = guide_legend(nrow = 2, byrow = TRUE,
                               override.aes = list(size = 6))) +
  labs(title = "network-directed · r · ggplot2 · anyplot.ai") +
  coord_cartesian(xlim = c(-0.4, 4.4), ylim = c(-1.6, 1.5), expand = FALSE) +
  theme_void(base_size = 8) +
  theme(
    plot.background   = element_rect(fill = PAGE_BG, color = PAGE_BG),
    panel.background  = element_rect(fill = PAGE_BG, color = NA),
    plot.title        = element_text(color = INK, size = 12, hjust = 0.5,
                                      margin = margin(b = 10)),
    plot.margin       = margin(15, 20, 15, 20),
    legend.position   = "bottom",
    legend.background = element_rect(fill = ELEVATED_BG, color = INK_SOFT),
    legend.title      = element_text(color = INK, size = 10),
    legend.text       = element_text(color = INK_SOFT, size = 8),
    legend.key.size   = unit(0.8, "lines"),
    legend.margin     = margin(4, 4, 4, 4)
  )

# --- Save ------------------------------------------------------------------
ggsave(
  filename = sprintf("plot-%s.png", THEME),
  plot     = p,
  device   = ragg::agg_png,
  width    = 8,
  height   = 4.5,
  units    = "in",
  dpi      = 400
)
Runnable source as JSON, for any HTTP client: https://api.anyplot.ai/specs/network-directed/ggplot2/code. Any spec id and library id listed in llms-full.txt fit the same URL shape; every URL below is complete and callable.
{
  "spec_id": "network-directed",
  "language": "r",
  "library": "ggplot2",
  "page": "https://anyplot.ai/network-directed/r/ggplot2",
  "hub": "https://anyplot.ai/network-directed",
  "code_json": "https://api.anyplot.ai/specs/network-directed/ggplot2/code",
  "spec_json": "https://api.anyplot.ai/specs/network-directed",
  "render_light_png": "https://storage.googleapis.com/anyplot-images/plots/network-directed/r/ggplot2/plot-light.png",
  "render_dark_png": "https://storage.googleapis.com/anyplot-images/plots/network-directed/r/ggplot2/plot-dark.png",
  "quality_score": 82.0,
  "license": "MIT",
  "guide": "https://anyplot.ai/llms.txt"
}
Part of Directed Network Graph on anyplot.ai.