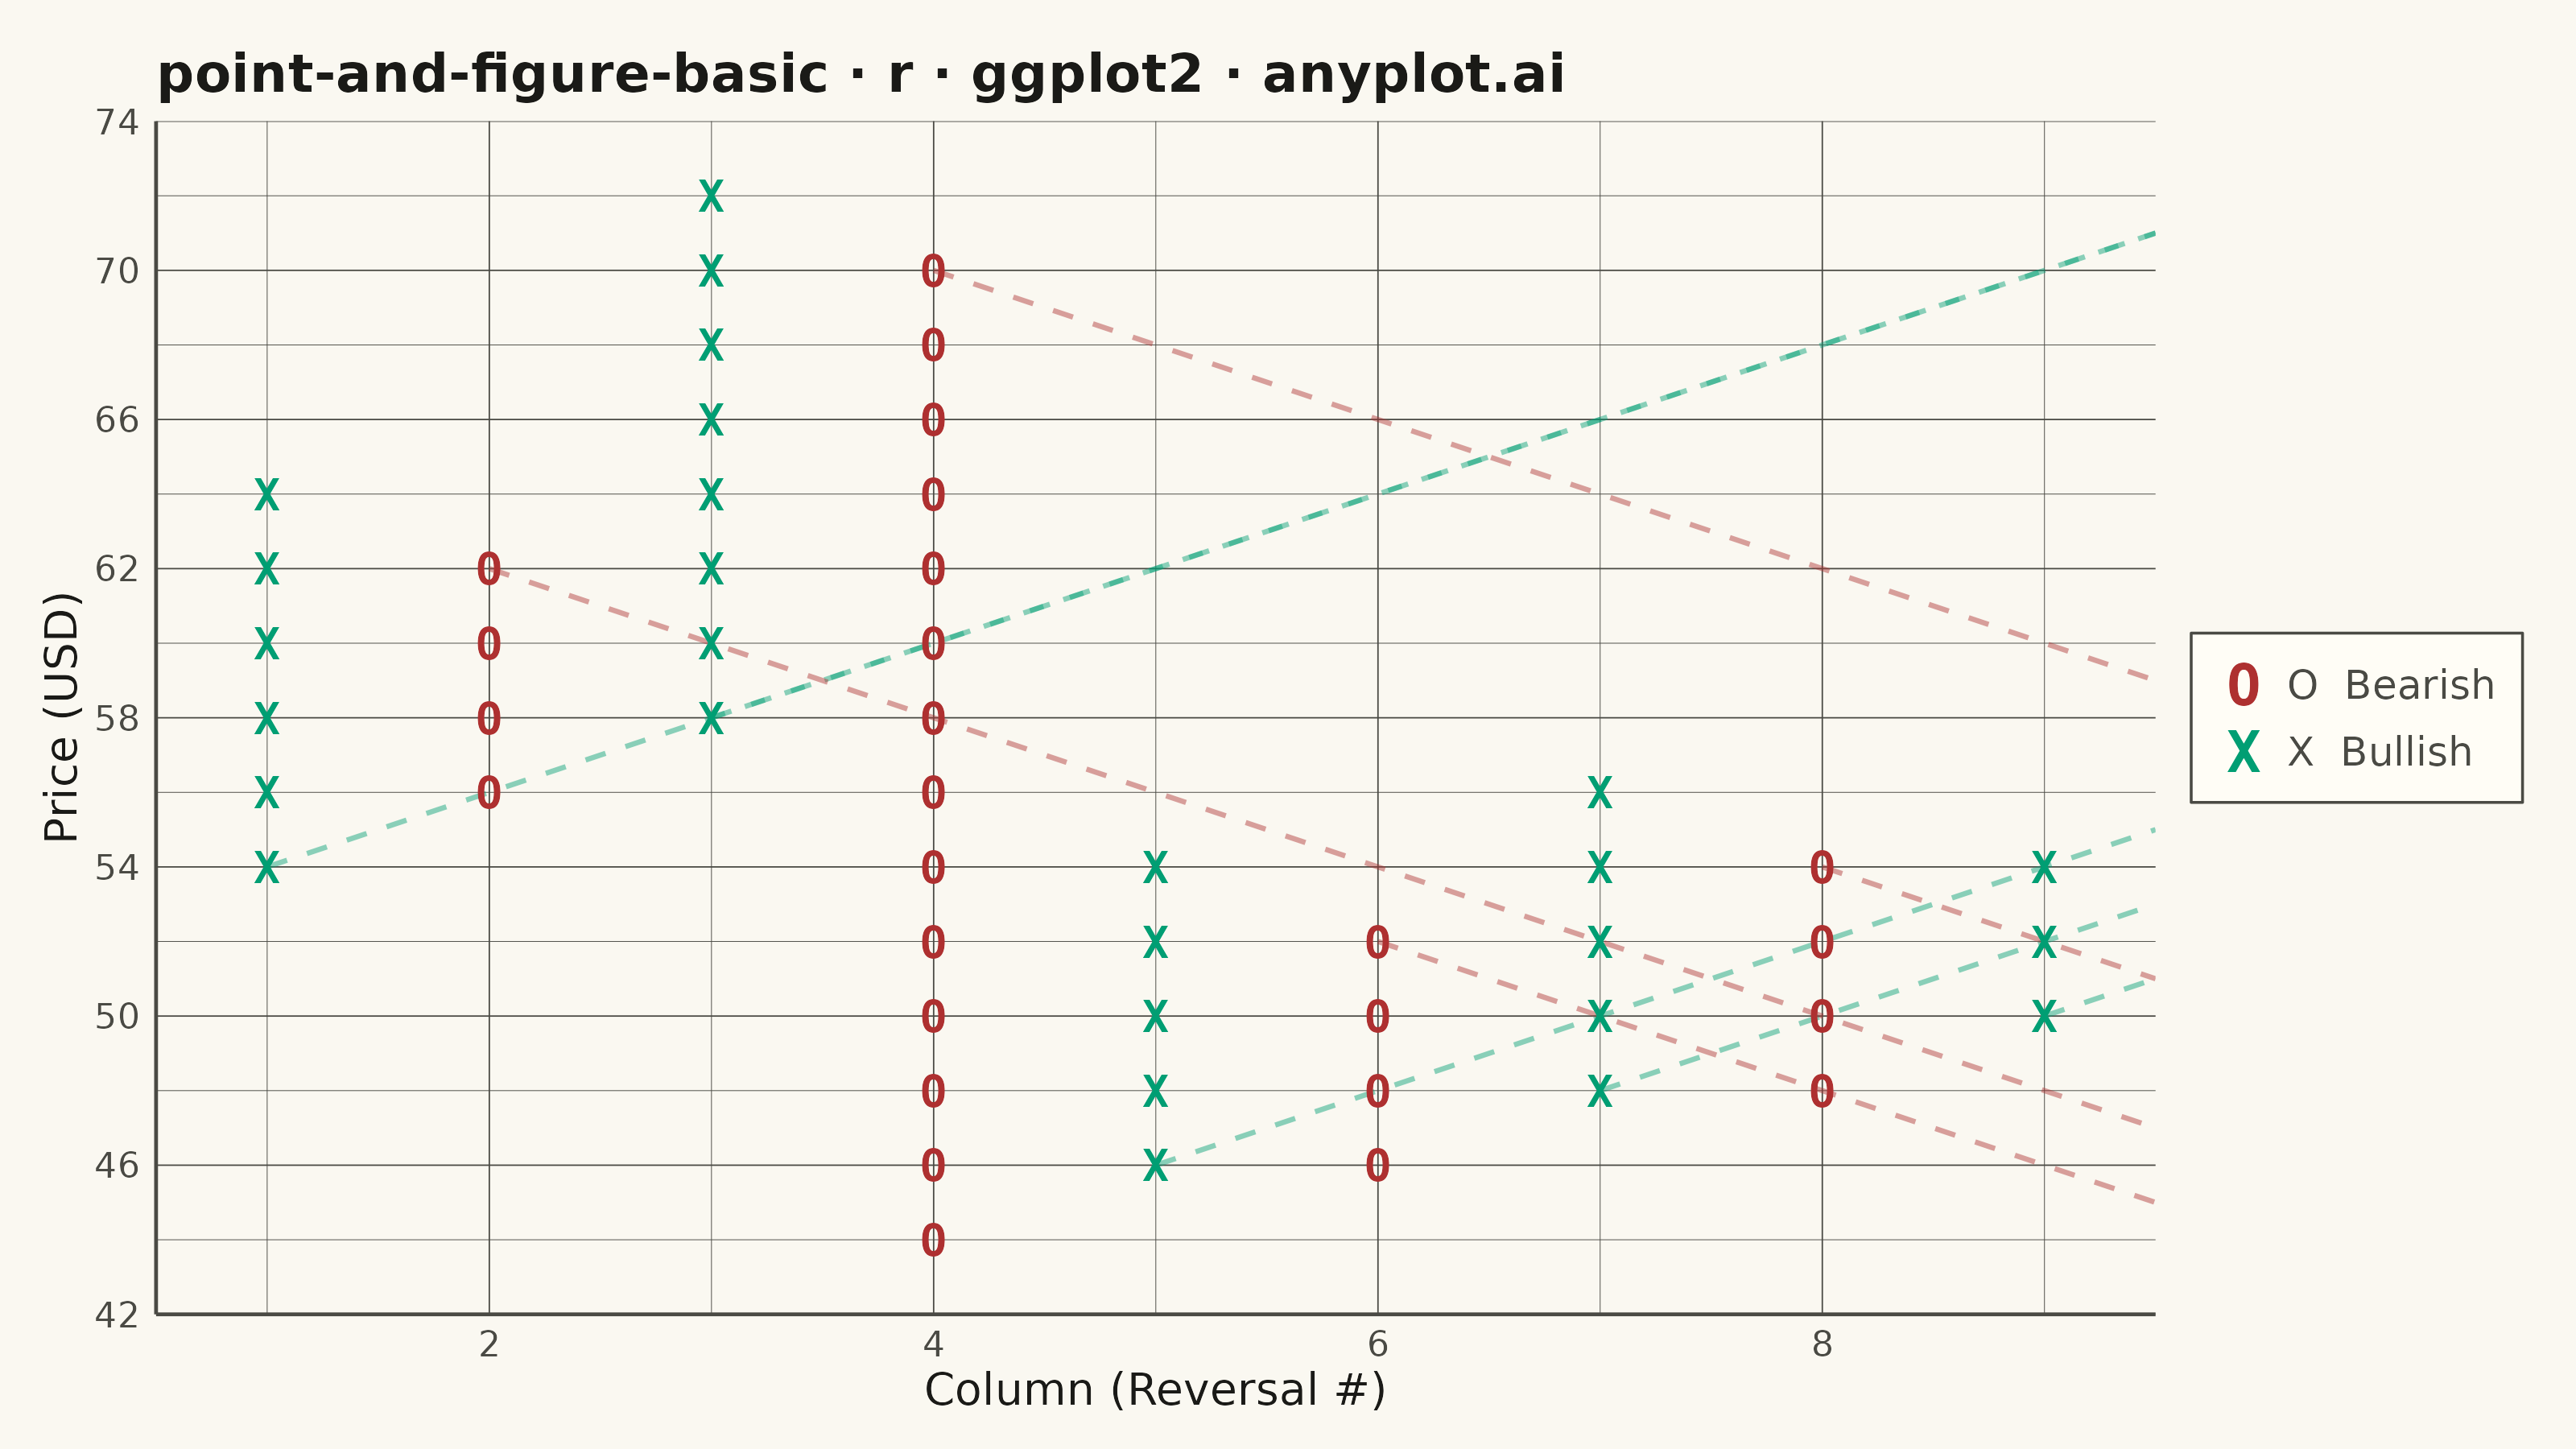
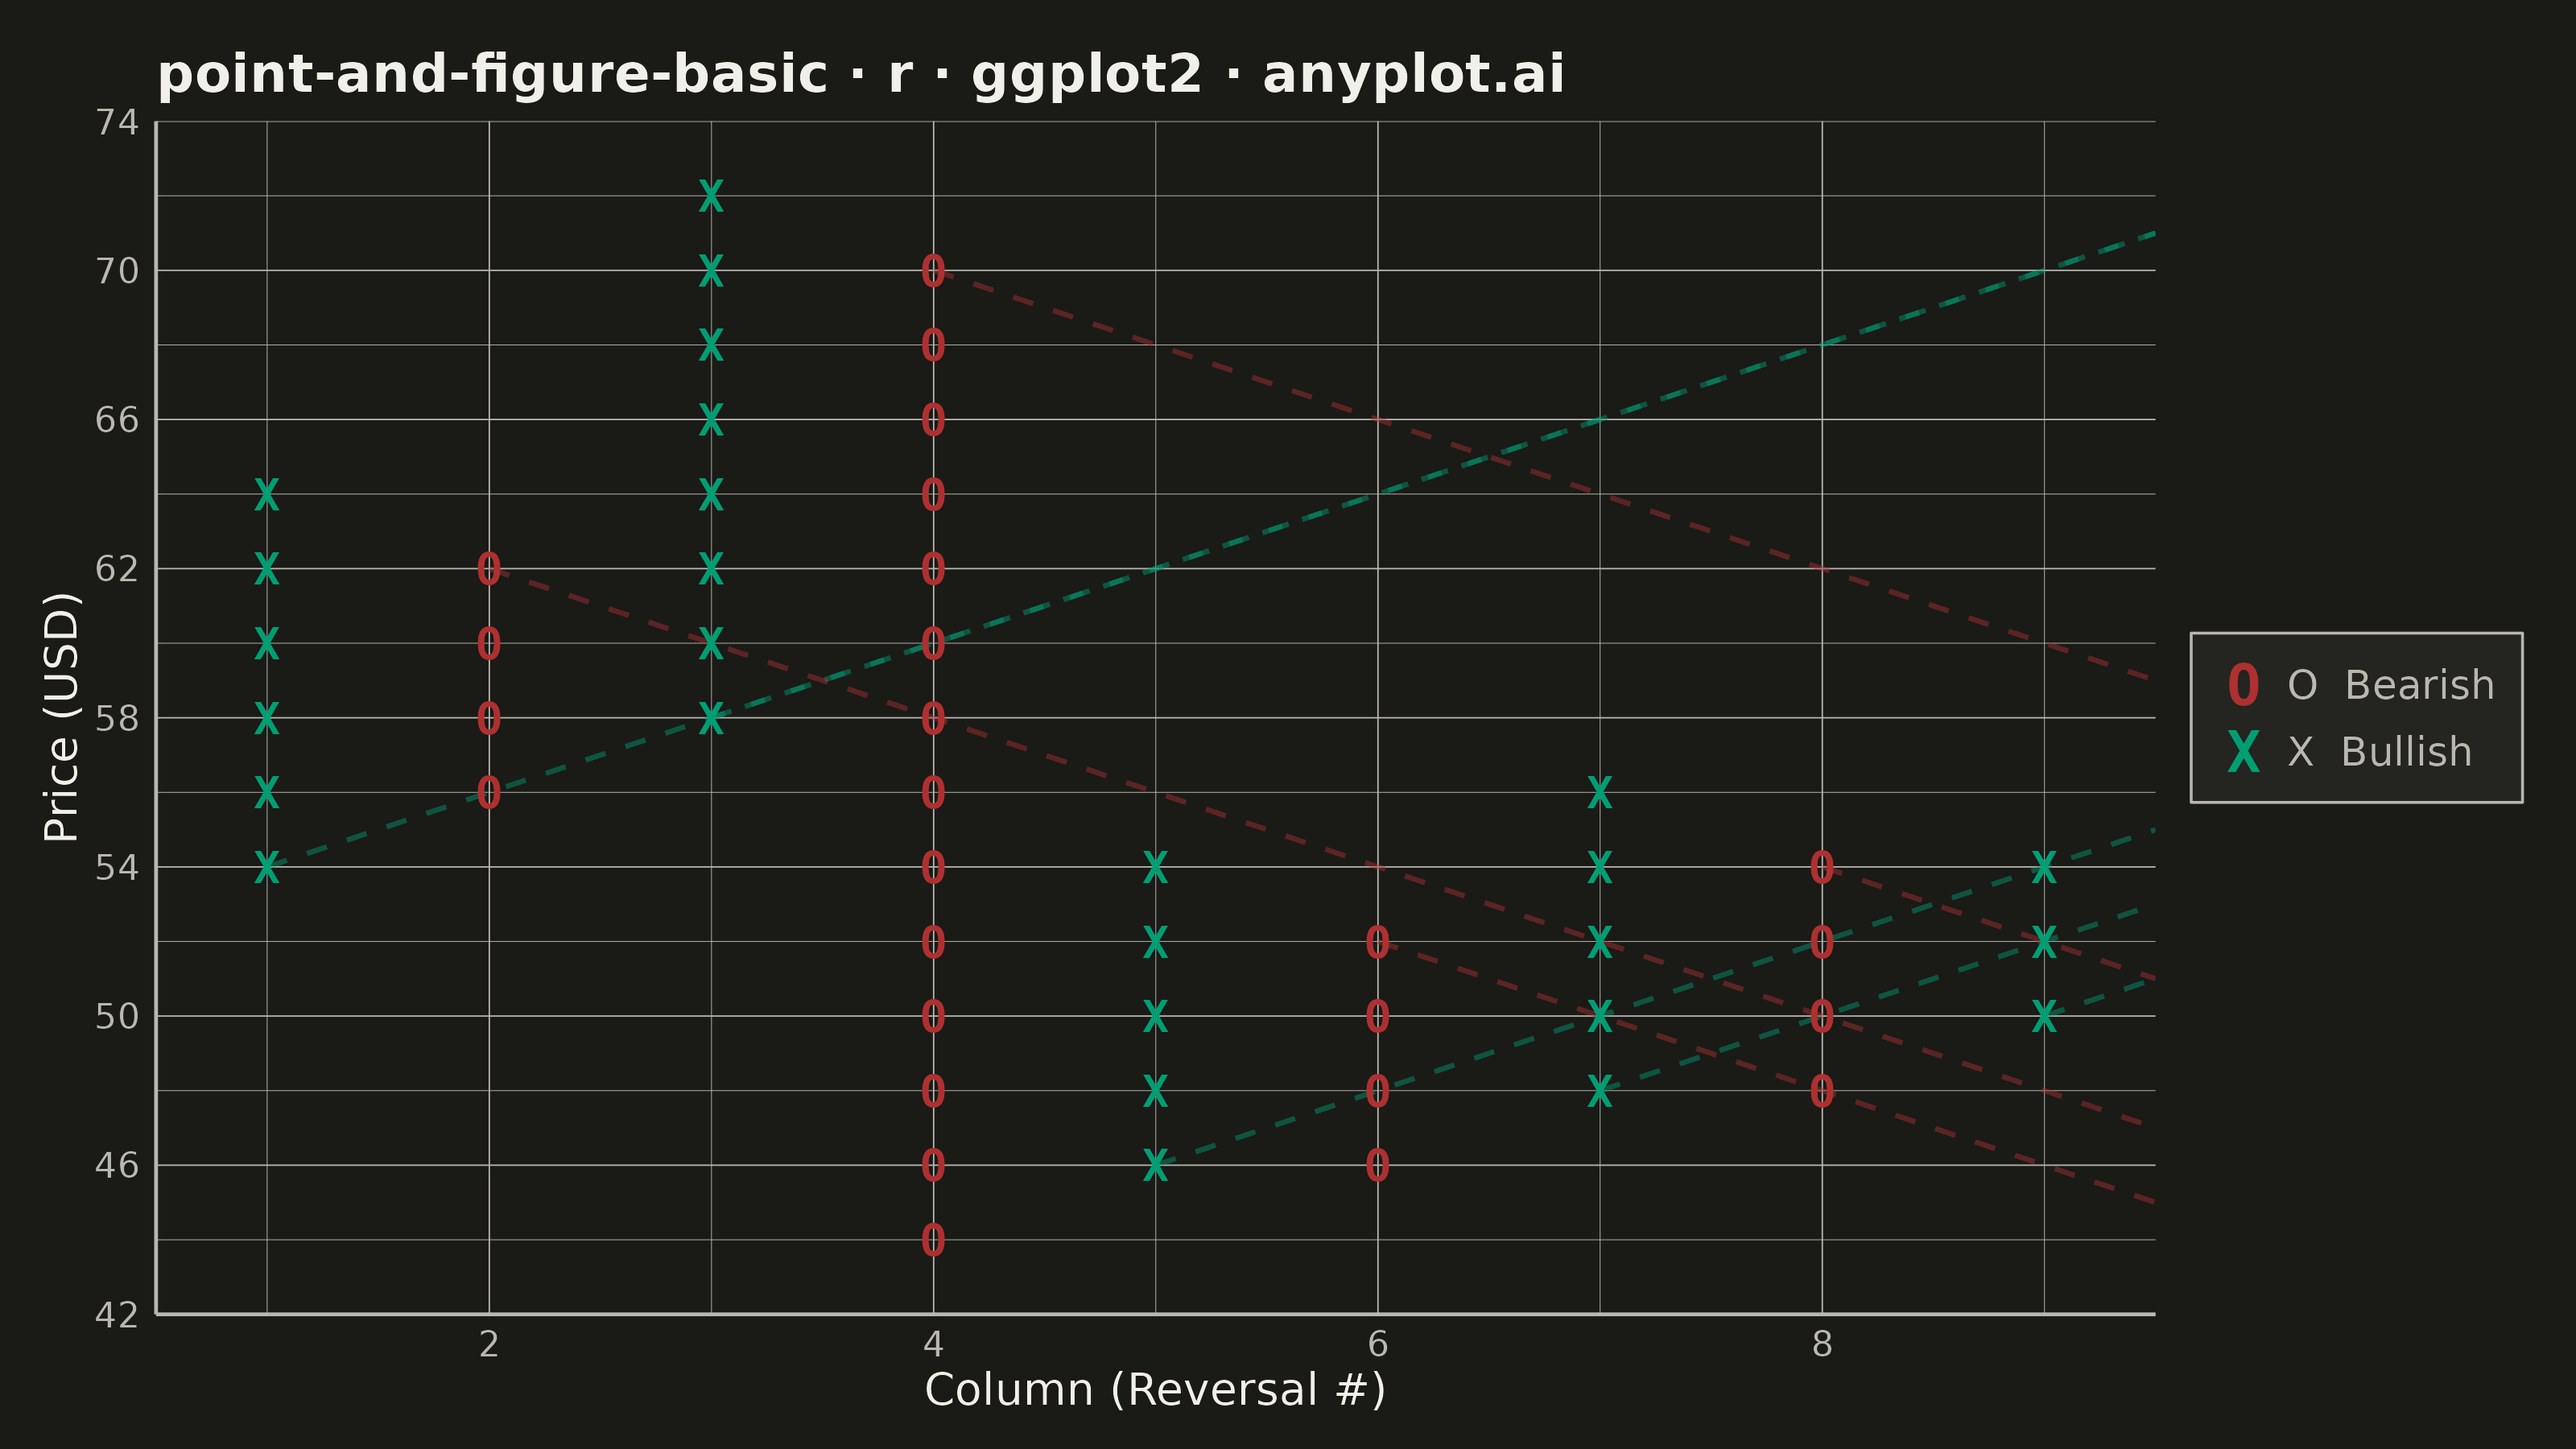
The same plot in 14 other libraries — Python: Altair, Bokeh, lets-plot, Matplotlib, Plotly, plotnine, Pygal, Seaborn; Julia: Makie.jl; JavaScript: Chart.js, D3.js, Apache ECharts, Highcharts, MUI X Charts. Compare all 15 side by side: Point and Figure Chart in Python, R, Julia and JavaScript.
A Point and Figure (P&F) chart is a price-action focused visualization that uses columns of X's (rising prices) and O's (falling prices) to display significant price movements while filtering out time and minor fluctuations. Unlike traditional time-based charts, P&F charts only plot a new symbol when price moves by a defined box size, and only start a new column when price reverses by a specified number of boxes (typically 3). This makes it ideal for identifying clear trends, support/resistance levels, and generating trading signals.
#' anyplot.ai
#' point-and-figure-basic: Point and Figure Chart
#' Library: ggplot2 3.5.1 | R 4.4.1
#' Quality: 87/100 | Created: 2026-05-20

library(ggplot2)
library(ragg)

set.seed(42)

# --- Theme tokens ---
THEME       <- Sys.getenv("ANYPLOT_THEME", "light")
PAGE_BG     <- if (THEME == "light") "#FAF8F1" else "#1A1A17"
ELEVATED_BG <- if (THEME == "light") "#FFFDF6" else "#242420"
INK         <- if (THEME == "light") "#1A1A17" else "#F0EFE8"
INK_SOFT    <- if (THEME == "light") "#4A4A44" else "#B8B7B0"
BULL_COLOR  <- "#009E73"   # Okabe-Ito #1 — bullish X columns
BEAR_COLOR  <- "#AE3030"   # imprint red — bearish O columns

# --- Synthetic daily close prices (ACME Corp., 300 trading days) ---
n_days <- 300
prices <- numeric(n_days)
prices[1] <- 52.0

for (i in 2:n_days) {
  drift <- if (i <= 80) 0.18 else if (i <= 160) -0.15 else if (i <= 240) 0.10 else -0.06
  prices[i] <- prices[i - 1] + rnorm(1, mean = drift, sd = 1.2)
}
prices <- pmax(prices, 20)

# --- P&F algorithm ---
box_size <- 2.0
reversal  <- 3L
floor_box <- function(p) floor(p / box_size) * box_size

build_pf <- function(prices, box_size, reversal) {
  symbols <- list()
  dir     <- NA_character_
  col_num <- 1L
  ref     <- floor_box(prices[1])
  current <- ref

  for (p in prices[-1]) {
    lvl <- floor_box(p)

    if (is.na(dir)) {
      if (lvl >= ref + box_size) {
        dir <- "X"
        for (v in seq(ref + box_size, lvl, by = box_size))
          symbols[[length(symbols) + 1L]] <- data.frame(col = col_num, price = v, type = "X")
        current <- lvl
      } else if (lvl <= ref - box_size) {
        dir <- "O"
        for (v in seq(ref - box_size, lvl, by = -box_size))
          symbols[[length(symbols) + 1L]] <- data.frame(col = col_num, price = v, type = "O")
        current <- lvl
      }
    } else if (dir == "X") {
      if (lvl >= current + box_size) {
        for (v in seq(current + box_size, lvl, by = box_size))
          symbols[[length(symbols) + 1L]] <- data.frame(col = col_num, price = v, type = "X")
        current <- lvl
      } else if (lvl <= current - reversal * box_size) {
        col_num <- col_num + 1L
        dir <- "O"
        for (v in seq(current - box_size, lvl, by = -box_size))
          symbols[[length(symbols) + 1L]] <- data.frame(col = col_num, price = v, type = "O")
        current <- lvl
      }
    } else {
      if (lvl <= current - box_size) {
        for (v in seq(current - box_size, lvl, by = -box_size))
          symbols[[length(symbols) + 1L]] <- data.frame(col = col_num, price = v, type = "O")
        current <- lvl
      } else if (lvl >= current + reversal * box_size) {
        col_num <- col_num + 1L
        dir <- "X"
        for (v in seq(current + box_size, lvl, by = box_size))
          symbols[[length(symbols) + 1L]] <- data.frame(col = col_num, price = v, type = "X")
        current <- lvl
      }
    }
  }

  if (length(symbols) == 0)
    return(data.frame(col = integer(), price = numeric(), type = character()))
  do.call(rbind, symbols)
}

pf <- build_pf(prices, box_size, reversal)

# --- Plot ---
n_cols <- max(pf$col)
y_lo   <- min(pf$price) - box_size
y_hi   <- max(pf$price) + box_size
x_end  <- n_cols + 0.5

# --- 45-degree trend lines (1 box per column = slope of box_size) ---
x_col_ids <- sort(unique(pf$col[pf$type == "X"]))
o_col_ids <- sort(unique(pf$col[pf$type == "O"]))

support_df <- data.frame(
  x    = x_col_ids,
  y    = sapply(x_col_ids, function(c) min(pf$price[pf$col == c])),
  xend = x_end
)
support_df$yend <- support_df$y + (x_end - support_df$x) * box_size

resist_df <- data.frame(
  x    = o_col_ids,
  y    = sapply(o_col_ids, function(c) max(pf$price[pf$col == c])),
  xend = x_end
)
resist_df$yend <- resist_df$y - (x_end - resist_df$x) * box_size

p <- ggplot(pf, aes(x = col, y = price, label = type, color = type)) +
  geom_segment(
    data        = support_df,
    aes(x = x, y = y, xend = xend, yend = yend),
    color       = BULL_COLOR, alpha = 0.45, linewidth = 0.55, linetype = "dashed",
    inherit.aes = FALSE
  ) +
  geom_segment(
    data        = resist_df,
    aes(x = x, y = y, xend = xend, yend = yend),
    color       = BEAR_COLOR, alpha = 0.45, linewidth = 0.55, linetype = "dashed",
    inherit.aes = FALSE
  ) +
  geom_text(size = 3.5, fontface = "bold", family = "mono") +
  scale_color_manual(
    values = c("X" = BULL_COLOR, "O" = BEAR_COLOR),
    labels = c("X" = "X  Bullish", "O" = "O  Bearish"),
    name   = NULL
  ) +
  guides(color = guide_legend(
    override.aes = list(label = c("O", "X"), size = 4.5, fontface = "bold", family = "mono")
  )) +
  scale_x_continuous(
    name   = "Column (Reversal #)",
    breaks = seq(2, n_cols, by = 2),
    limits = c(0.5, n_cols + 0.5),
    expand = expansion(0)
  ) +
  scale_y_continuous(
    name         = "Price (USD)",
    breaks       = seq(y_lo, y_hi, by = box_size * 2),
    minor_breaks = seq(y_lo, y_hi, by = box_size),
    limits       = c(y_lo, y_hi),
    expand       = expansion(0)
  ) +
  labs(title = "point-and-figure-basic · r · ggplot2 · anyplot.ai") +
  theme_minimal(base_size = 8) +
  theme(
    plot.background    = element_rect(fill = PAGE_BG, color = PAGE_BG),
    panel.background   = element_rect(fill = PAGE_BG, color = NA),
    panel.grid.major   = element_line(color = INK_SOFT, linewidth = 0.15),
    panel.grid.minor   = element_line(color = INK_SOFT, linewidth = 0.08),
    panel.border       = element_blank(),
    axis.title         = element_text(color = INK, size = 10),
    axis.text          = element_text(color = INK_SOFT, size = 8),
    axis.line.x.bottom = element_line(color = INK_SOFT, linewidth = 0.4),
    axis.line.y.left   = element_line(color = INK_SOFT, linewidth = 0.4),
    axis.ticks         = element_blank(),
    plot.title         = element_text(color = INK, size = 12, face = "bold"),
    legend.background  = element_rect(fill = ELEVATED_BG, color = INK_SOFT, linewidth = 0.3),
    legend.text        = element_text(color = INK_SOFT, size = 9),
    legend.margin      = margin(4, 6, 4, 6),
    legend.key.size    = unit(0.8, "lines"),
    legend.position    = "right",
    plot.margin        = margin(12, 12, 8, 10)
  )

# --- Save ---
ggsave(
  filename = sprintf("plot-%s.png", THEME),
  plot     = p,
  device   = ragg::agg_png,
  width    = 8,
  height   = 4.5,
  units    = "in",
  dpi      = 400
)
Runnable source as JSON, for any HTTP client: https://api.anyplot.ai/specs/point-and-figure-basic/ggplot2/code. Any spec id and library id listed in llms-full.txt fit the same URL shape; every URL below is complete and callable.
{
  "spec_id": "point-and-figure-basic",
  "language": "r",
  "library": "ggplot2",
  "page": "https://anyplot.ai/point-and-figure-basic/r/ggplot2",
  "hub": "https://anyplot.ai/point-and-figure-basic",
  "code_json": "https://api.anyplot.ai/specs/point-and-figure-basic/ggplot2/code",
  "spec_json": "https://api.anyplot.ai/specs/point-and-figure-basic",
  "render_light_png": "https://storage.googleapis.com/anyplot-images/plots/point-and-figure-basic/r/ggplot2/plot-light.png",
  "render_dark_png": "https://storage.googleapis.com/anyplot-images/plots/point-and-figure-basic/r/ggplot2/plot-dark.png",
  "quality_score": 87.0,
  "license": "MIT",
  "guide": "https://anyplot.ai/llms.txt"
}
Part of Point and Figure Chart on anyplot.ai.