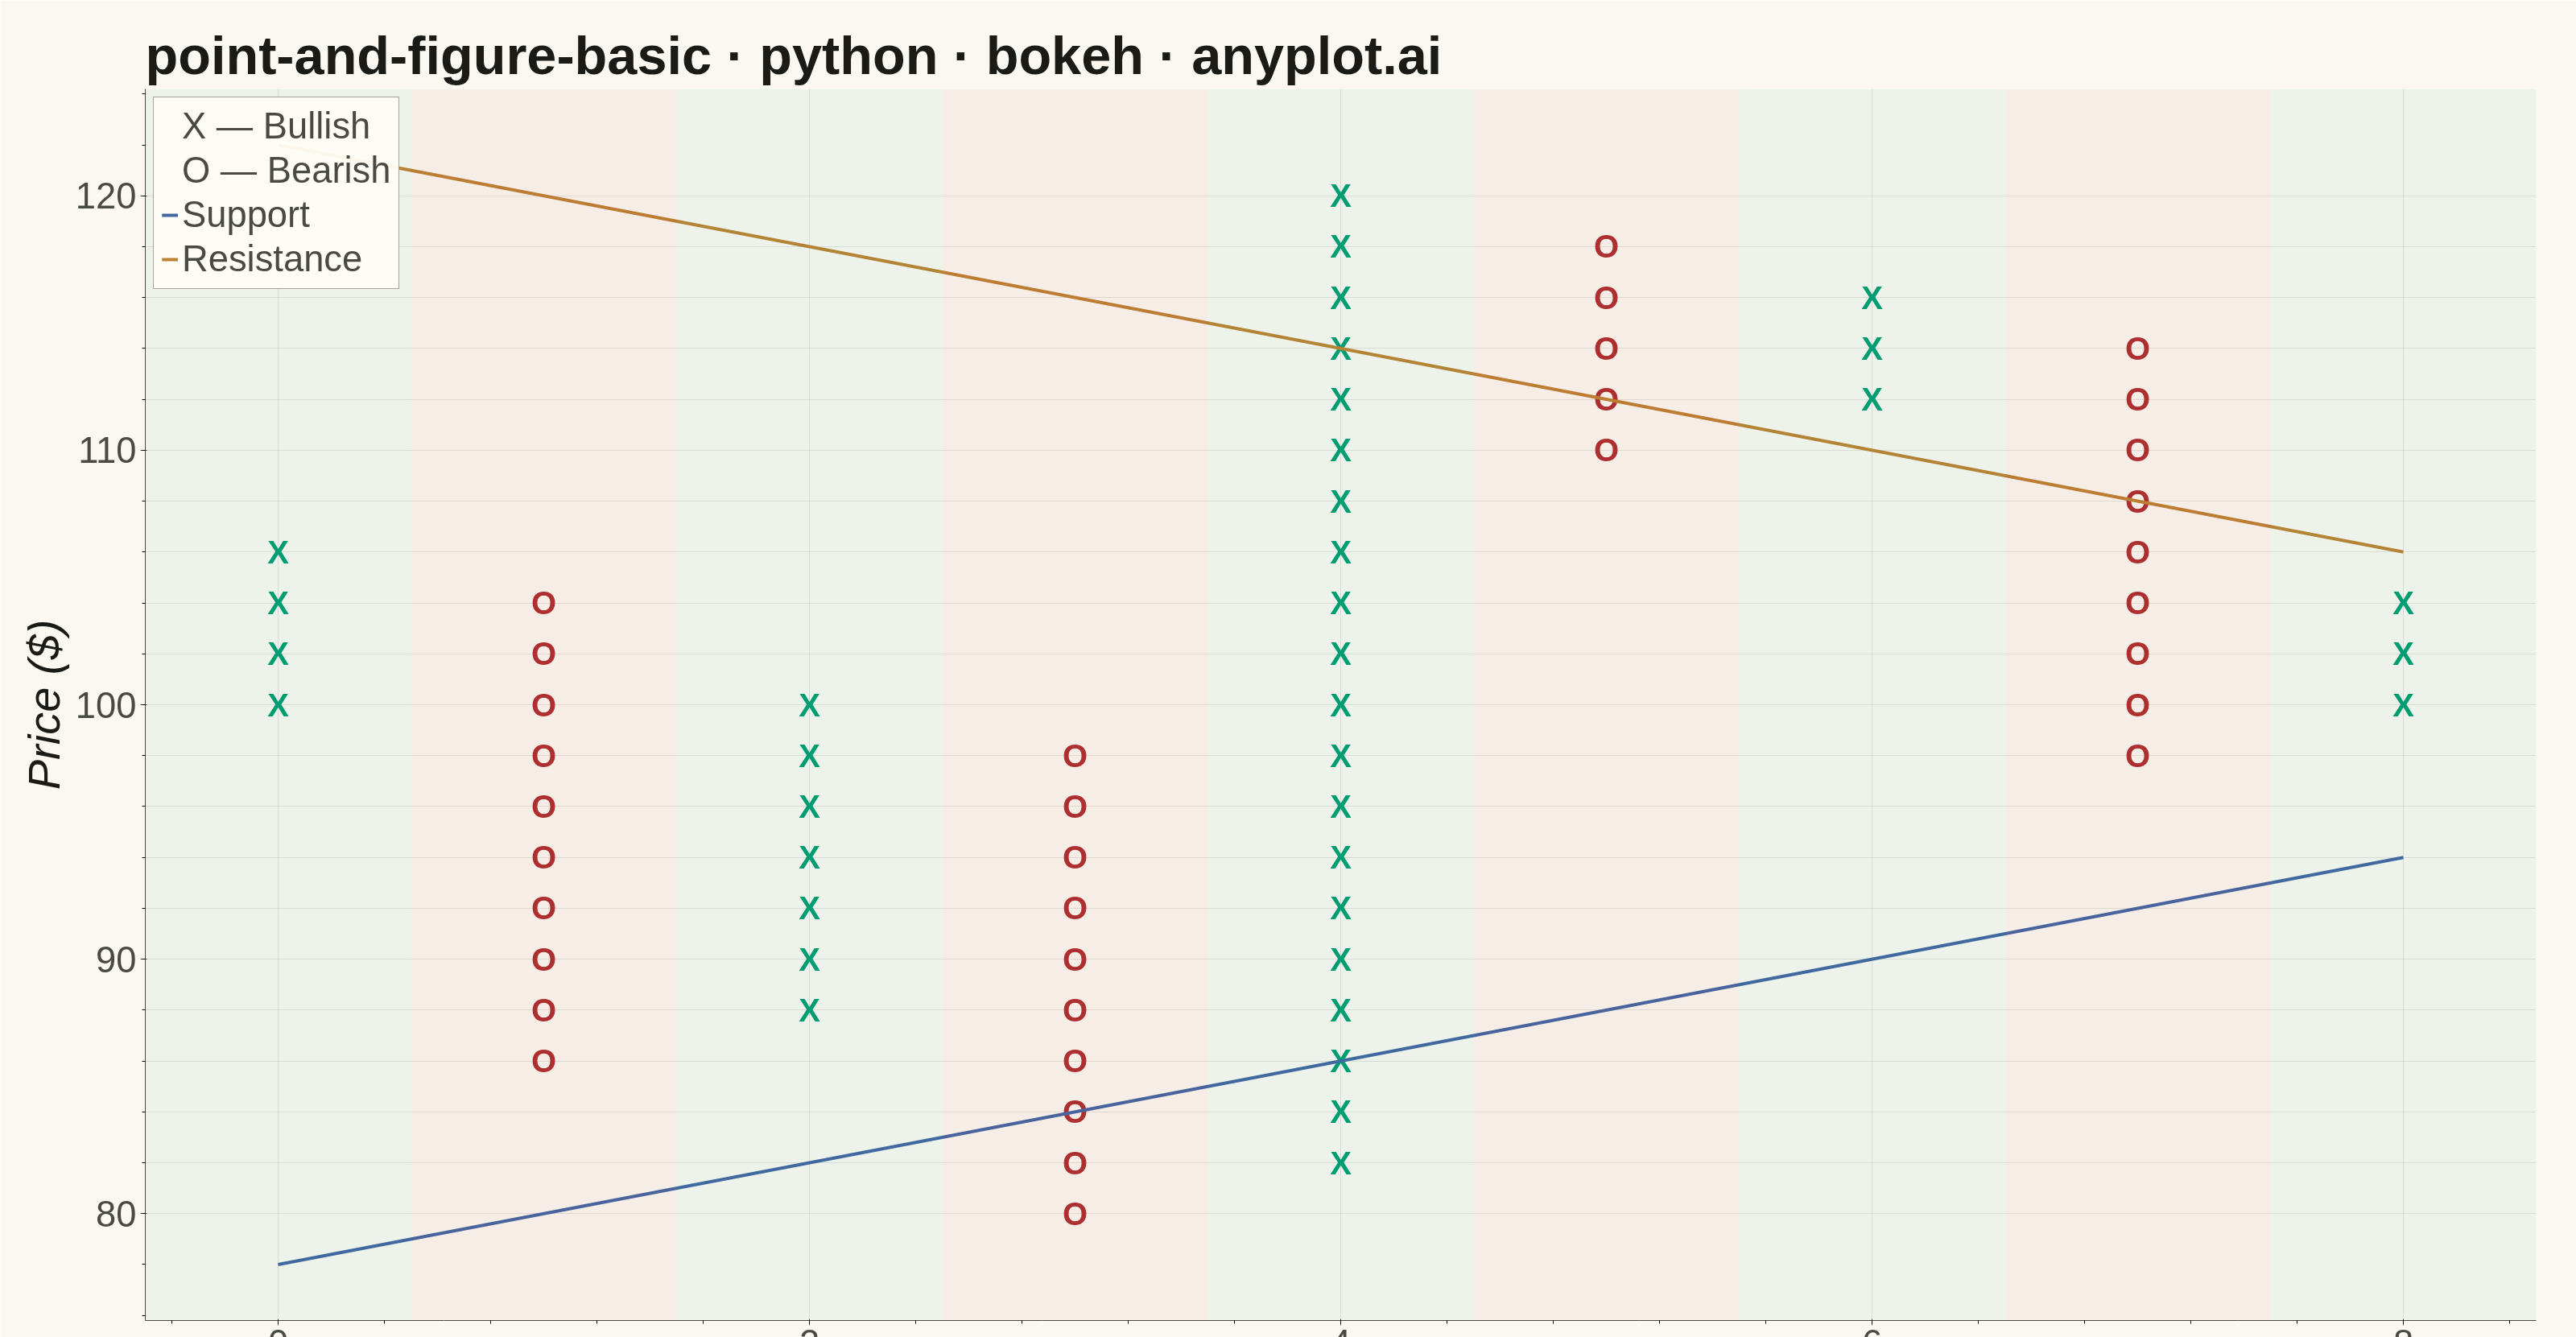
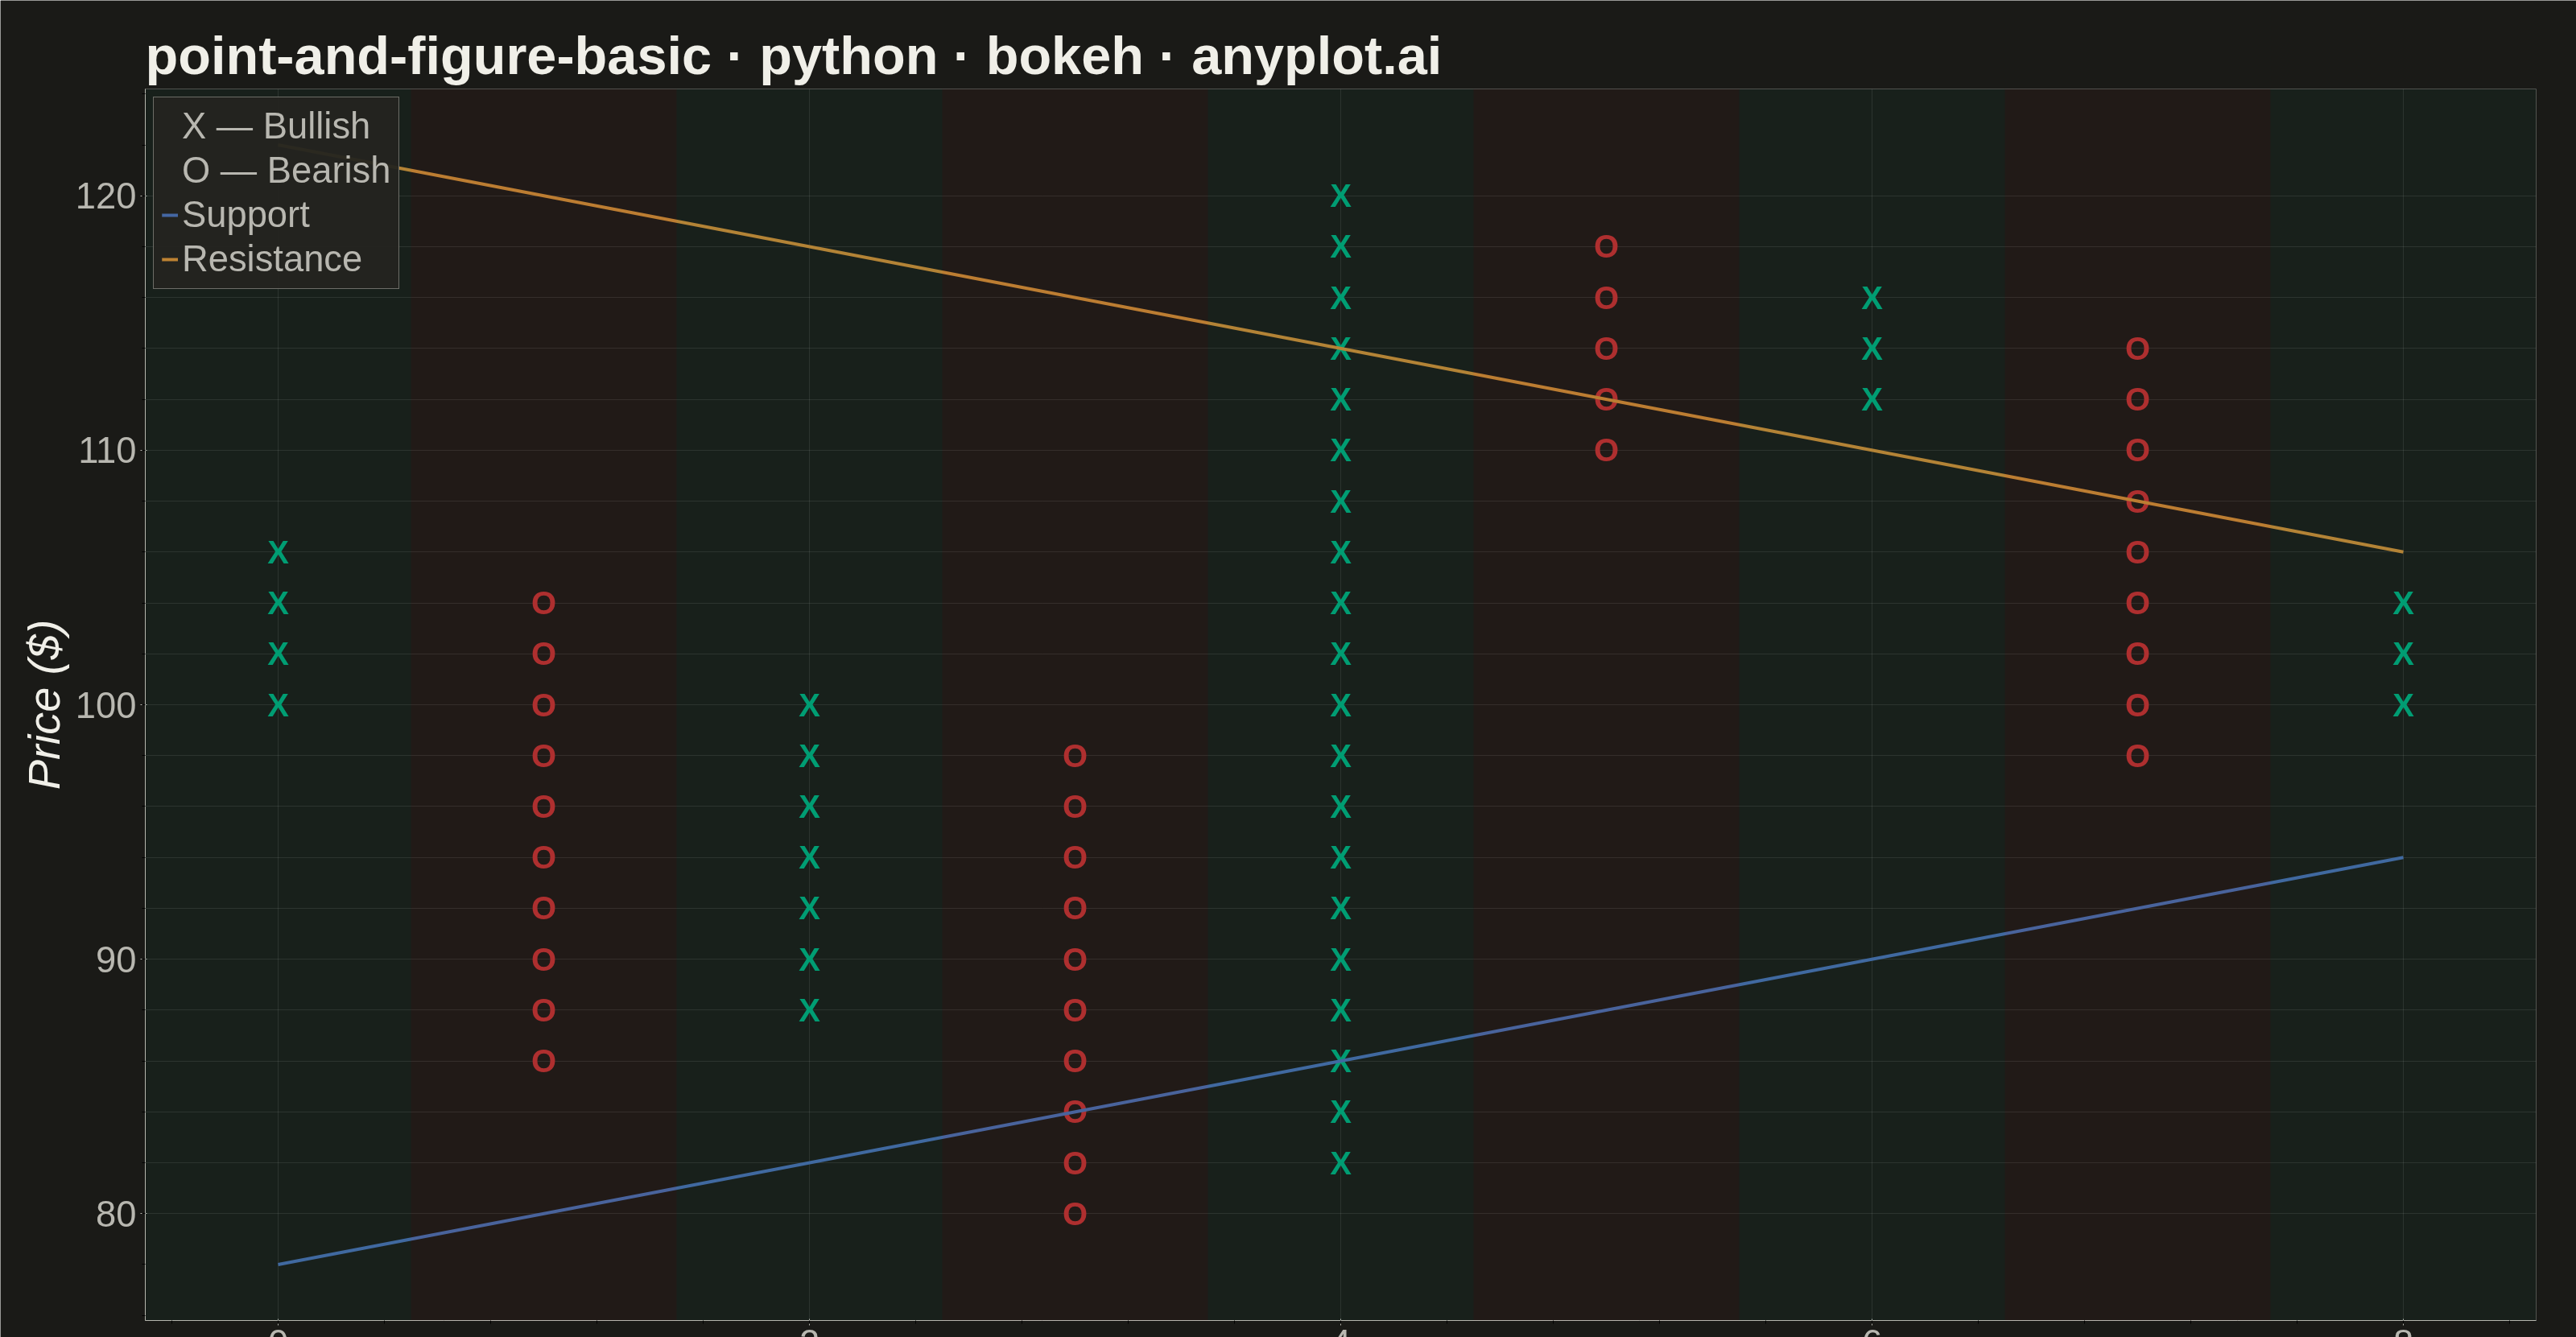
A Point and Figure (P&F) chart is a price-action focused visualization that uses columns of X's (rising prices) and O's (falling prices) to display significant price movements while filtering out time and minor fluctuations. Unlike traditional time-based charts, P&F charts only plot a new symbol when price moves by a defined box size, and only start a new column when price reverses by a specified number of boxes (typically 3). This makes it ideal for identifying clear trends, support/resistance levels, and generating trading signals.
""" anyplot.ai
point-and-figure-basic: Point and Figure Chart
Library: bokeh 3.9.0 | Python 3.13.13
Quality: 93/100 | Updated: 2026-05-20
"""

import os
import time
from pathlib import Path

import numpy as np
import pandas as pd
from bokeh.io import output_file, save
from bokeh.models import BoxAnnotation, ColumnDataSource, FixedTicker, HoverTool, Range1d
from bokeh.plotting import figure
from selenium import webdriver
from selenium.webdriver.chrome.options import Options


# Theme
THEME = os.getenv("ANYPLOT_THEME", "light")
PAGE_BG = "#FAF8F1" if THEME == "light" else "#1A1A17"
ELEVATED_BG = "#FFFDF6" if THEME == "light" else "#242420"
INK = "#1A1A17" if THEME == "light" else "#F0EFE8"
INK_SOFT = "#4A4A44" if THEME == "light" else "#B8B7B0"

# Okabe-Ito palette positions used
X_COLOR = "#009E73"  # position 1 — brand green, bullish X columns
O_COLOR = "#AE3030"  # imprint red — bearish O columns
SUPPORT_COLOR = "#4467A3"  # position 3 — blue, ascending support line
RESISTANCE_COLOR = "#BD8233"  # position 4 — purple, descending resistance line

# Data
np.random.seed(42)
n_days = 300
start_price = 100
daily_returns = np.random.normal(0.0005, 0.015, n_days)

# Add trending periods for visible breakout patterns
daily_returns[50:80] += 0.003
daily_returns[100:140] -= 0.004
daily_returns[180:220] += 0.0035
daily_returns[240:280] -= 0.003

close_prices = start_price * np.cumprod(1 + daily_returns)
volatility = np.abs(np.random.normal(0, 0.01, n_days))
high_prices = close_prices * (1 + volatility)
low_prices = close_prices * (1 - volatility)
dates = pd.date_range("2024-01-01", periods=n_days, freq="D")
df = pd.DataFrame({"date": dates, "high": high_prices, "low": low_prices, "close": close_prices})

# Point and Figure algorithm
box_size = 2.0  # $2 per box
reversal = 3  # 3-box reversal to start a new column

columns = []
current_direction = None
current_column_start = None
current_column_end = None

first_price = df["close"].iloc[0]
box_start = np.floor(first_price / box_size) * box_size

for row in df.itertuples():
    price = row.close
    box_price = np.floor(price / box_size) * box_size

    if current_direction is None:
        current_column_start = box_start
        current_column_end = box_start
        if price >= box_start + box_size:
            current_direction = "X"
            current_column_end = box_price
        elif price <= box_start - box_size:
            current_direction = "O"
            current_column_end = box_price
    elif current_direction == "X":
        if box_price >= current_column_end + box_size:
            current_column_end = box_price
        elif box_price <= current_column_end - reversal * box_size:
            columns.append({"type": "X", "start": current_column_start, "end": current_column_end})
            current_direction = "O"
            current_column_start = current_column_end - box_size
            current_column_end = box_price
    else:
        if box_price <= current_column_end - box_size:
            current_column_end = box_price
        elif box_price >= current_column_end + reversal * box_size:
            columns.append({"type": "O", "start": current_column_start, "end": current_column_end})
            current_direction = "X"
            current_column_start = current_column_end + box_size
            current_column_end = box_price

if current_direction is not None:
    columns.append({"type": current_direction, "start": current_column_start, "end": current_column_end})

# Prepare plotting data
x_cols, x_prices, x_labels = [], [], []
o_cols, o_prices, o_labels = [], [], []

for col_idx, col in enumerate(columns):
    if col["type"] == "X":
        lo = min(col["start"], col["end"])
        hi = max(col["start"], col["end"])
        for box in np.arange(lo, hi + box_size / 2, box_size):
            x_cols.append(col_idx)
            x_prices.append(float(box))
            x_labels.append("X")
    else:
        lo = min(col["start"], col["end"])
        hi = max(col["start"], col["end"])
        for box in np.arange(lo, hi + box_size / 2, box_size):
            o_cols.append(col_idx)
            o_prices.append(float(box))
            o_labels.append("O")

all_prices = x_prices + o_prices
min_price = min(all_prices)
max_price = max(all_prices)

# Grid ticks at exact box-size intervals
price_ticks = list(
    np.arange(np.floor(min_price / box_size) * box_size, np.ceil(max_price / box_size) * box_size + box_size, box_size)
)

# Plot
hover = HoverTool(tooltips=[("Price", "@price{$0.00}"), ("Column", "@col")])

p = figure(
    width=3200,
    height=1800,
    title="point-and-figure-basic · python · bokeh · anyplot.ai",
    x_axis_label="Column (Reversal)",
    y_axis_label="Price ($)",
    toolbar_location=None,
    tools=[hover],
    x_range=Range1d(-0.5, len(columns) - 0.5),
    min_border_bottom=160,
    min_border_left=180,
    min_border_top=110,
    min_border_right=50,
)

# Font sizes for 3200×1800 canvas
p.title.text_font_size = "50pt"
p.xaxis.axis_label_text_font_size = "42pt"
p.yaxis.axis_label_text_font_size = "42pt"
p.xaxis.major_label_text_font_size = "34pt"
p.yaxis.major_label_text_font_size = "34pt"

# Theme-adaptive chrome
p.background_fill_color = PAGE_BG
p.border_fill_color = PAGE_BG
p.outline_line_color = None
p.title.text_color = INK
p.xaxis.axis_label_text_color = INK
p.yaxis.axis_label_text_color = INK
p.xaxis.major_label_text_color = INK_SOFT
p.yaxis.major_label_text_color = INK_SOFT
p.xaxis.axis_line_color = INK_SOFT
p.yaxis.axis_line_color = INK_SOFT
p.xaxis.major_tick_line_color = INK_SOFT
p.yaxis.major_tick_line_color = INK_SOFT

# Grid at exact box-size intervals
p.ygrid.ticker = FixedTicker(ticks=price_ticks)
p.xgrid.grid_line_color = INK
p.ygrid.grid_line_color = INK
p.xgrid.grid_line_alpha = 0.10
p.ygrid.grid_line_alpha = 0.10

# Alternating column background shading via BoxAnnotation (Bokeh-native feature)
for col_idx, col in enumerate(columns):
    fill = X_COLOR if col["type"] == "X" else O_COLOR
    p.add_layout(
        BoxAnnotation(left=col_idx - 0.5, right=col_idx + 0.5, fill_color=fill, fill_alpha=0.05, line_color=None)
    )

# X markers — bullish rising price columns
x_source = ColumnDataSource(data={"col": x_cols, "price": x_prices, "label": x_labels})
p.text(
    x="col",
    y="price",
    text="label",
    source=x_source,
    text_font_size="30pt",
    text_color=X_COLOR,
    text_align="center",
    text_baseline="middle",
    text_font_style="bold",
    legend_label="X — Bullish",
)

# O markers — bearish falling price columns
o_source = ColumnDataSource(data={"col": o_cols, "price": o_prices, "label": o_labels})
p.text(
    x="col",
    y="price",
    text="label",
    source=o_source,
    text_font_size="30pt",
    text_color=O_COLOR,
    text_align="center",
    text_baseline="middle",
    text_font_style="bold",
    legend_label="O — Bearish",
)

# Support trend line (45-degree ascending from lowest point)
support_price_start = min_price - box_size
support_price_end = support_price_start + (len(columns) - 1) * box_size
if support_price_end <= max_price + 2 * box_size:
    p.line(
        x=[0, len(columns) - 1],
        y=[support_price_start, support_price_end],
        line_width=4,
        line_color=SUPPORT_COLOR,
        legend_label="Support",
    )

# Resistance trend line (45-degree descending from highest point)
resistance_price_start = max_price + box_size
resistance_price_end = resistance_price_start - (len(columns) - 1) * box_size
if resistance_price_end >= min_price - 2 * box_size:
    p.line(
        x=[0, len(columns) - 1],
        y=[resistance_price_start, resistance_price_end],
        line_width=4,
        line_color=RESISTANCE_COLOR,
        legend_label="Resistance",
    )

# Legend
p.legend.location = "top_left"
p.legend.label_text_font_size = "34pt"
p.legend.background_fill_color = ELEVATED_BG
p.legend.border_line_color = INK_SOFT
p.legend.label_text_color = INK_SOFT

# Save HTML
output_file(f"plot-{THEME}.html")
save(p)

# Screenshot with headless Chrome (export_png unavailable in this env)
W, H = 3200, 1800
opts = Options()
for arg in (
    "--headless=new",
    "--no-sandbox",
    "--disable-dev-shm-usage",
    "--disable-gpu",
    f"--window-size={W},{H}",
    "--hide-scrollbars",
):
    opts.add_argument(arg)
driver = webdriver.Chrome(options=opts)
driver.set_window_size(W, H)
driver.get(f"file://{Path(f'plot-{THEME}.html').resolve()}")
time.sleep(3)
driver.save_screenshot(f"plot-{THEME}.png")
driver.quit()
Runnable source as JSON, for any HTTP client: https://api.anyplot.ai/specs/point-and-figure-basic/bokeh/code. Any spec id and library id listed in llms-full.txt fit the same URL shape; every URL below is complete and callable.
{
  "spec_id": "point-and-figure-basic",
  "language": "python",
  "library": "bokeh",
  "page": "https://anyplot.ai/point-and-figure-basic/python/bokeh",
  "hub": "https://anyplot.ai/point-and-figure-basic",
  "code_json": "https://api.anyplot.ai/specs/point-and-figure-basic/bokeh/code",
  "spec_json": "https://api.anyplot.ai/specs/point-and-figure-basic",
  "render_light_png": "https://storage.googleapis.com/anyplot-images/plots/point-and-figure-basic/python/bokeh/plot-light.png",
  "render_dark_png": "https://storage.googleapis.com/anyplot-images/plots/point-and-figure-basic/python/bokeh/plot-dark.png",
  "interactive_light_html": "https://storage.googleapis.com/anyplot-images/plots/point-and-figure-basic/python/bokeh/plot-light.html",
  "interactive_dark_html": "https://storage.googleapis.com/anyplot-images/plots/point-and-figure-basic/python/bokeh/plot-dark.html",
  "quality_score": 93.0,
  "license": "MIT",
  "guide": "https://anyplot.ai/llms.txt"
}
Part of Point and Figure Chart on anyplot.ai.