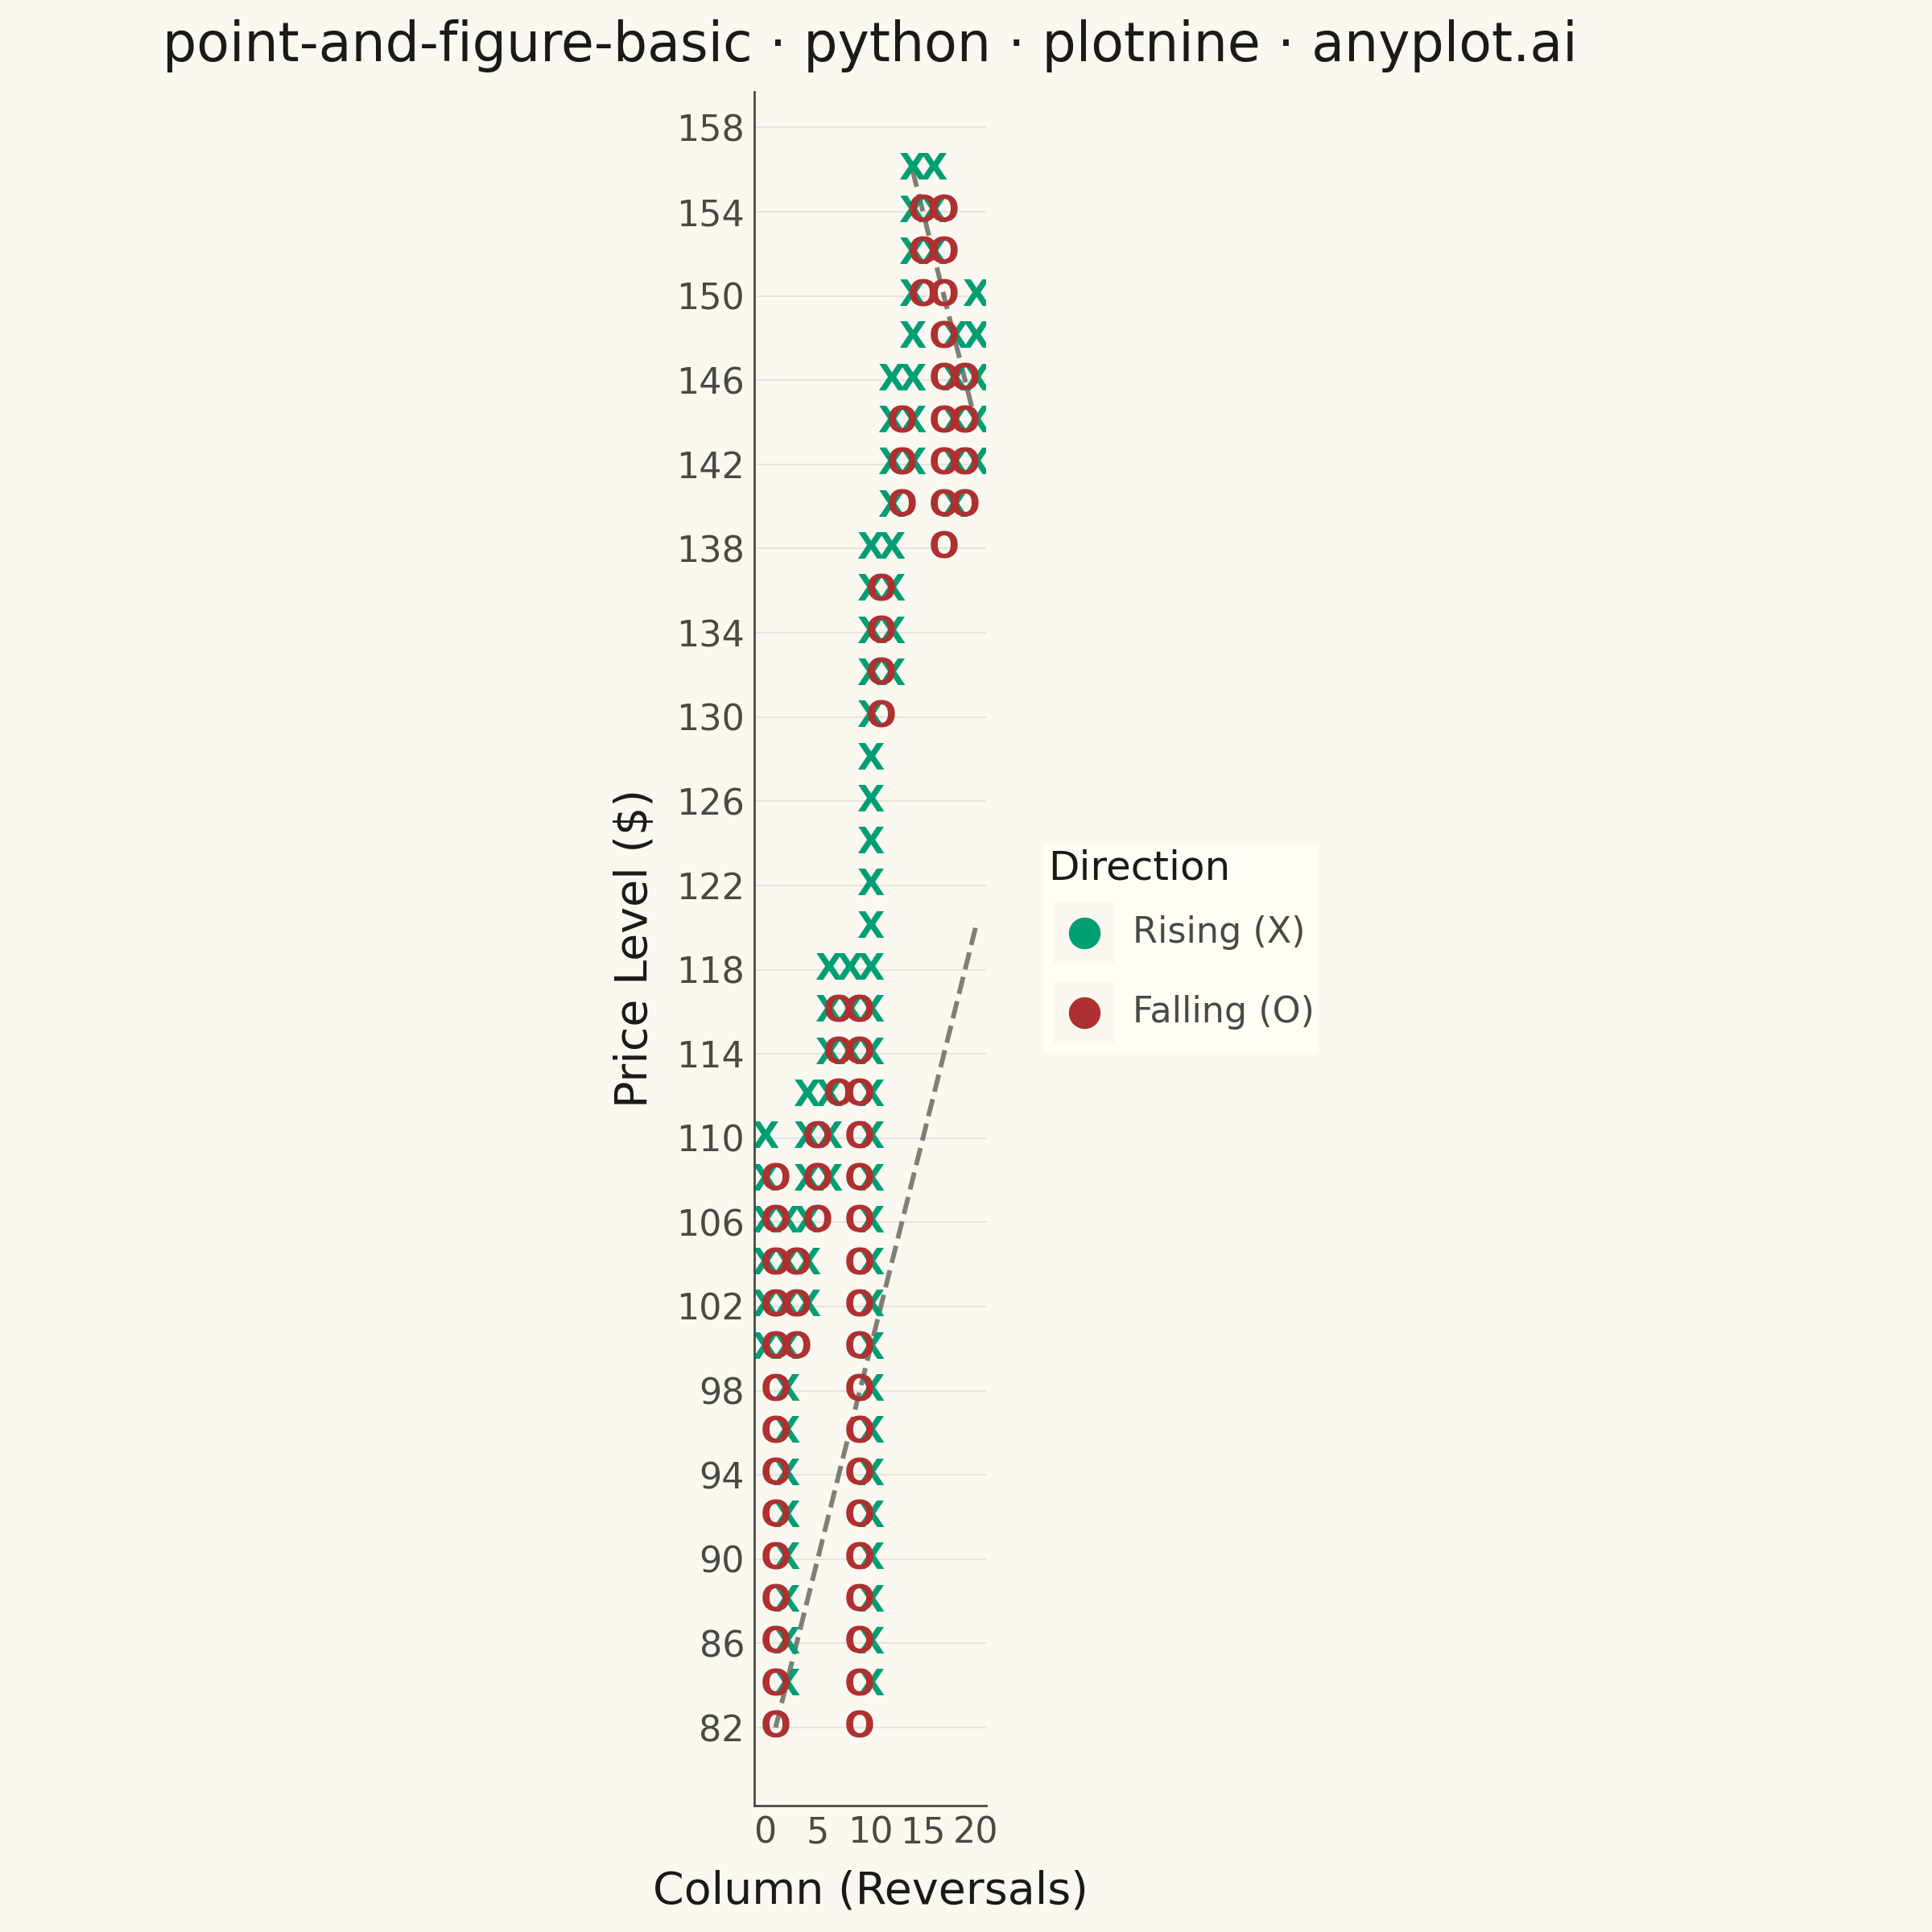
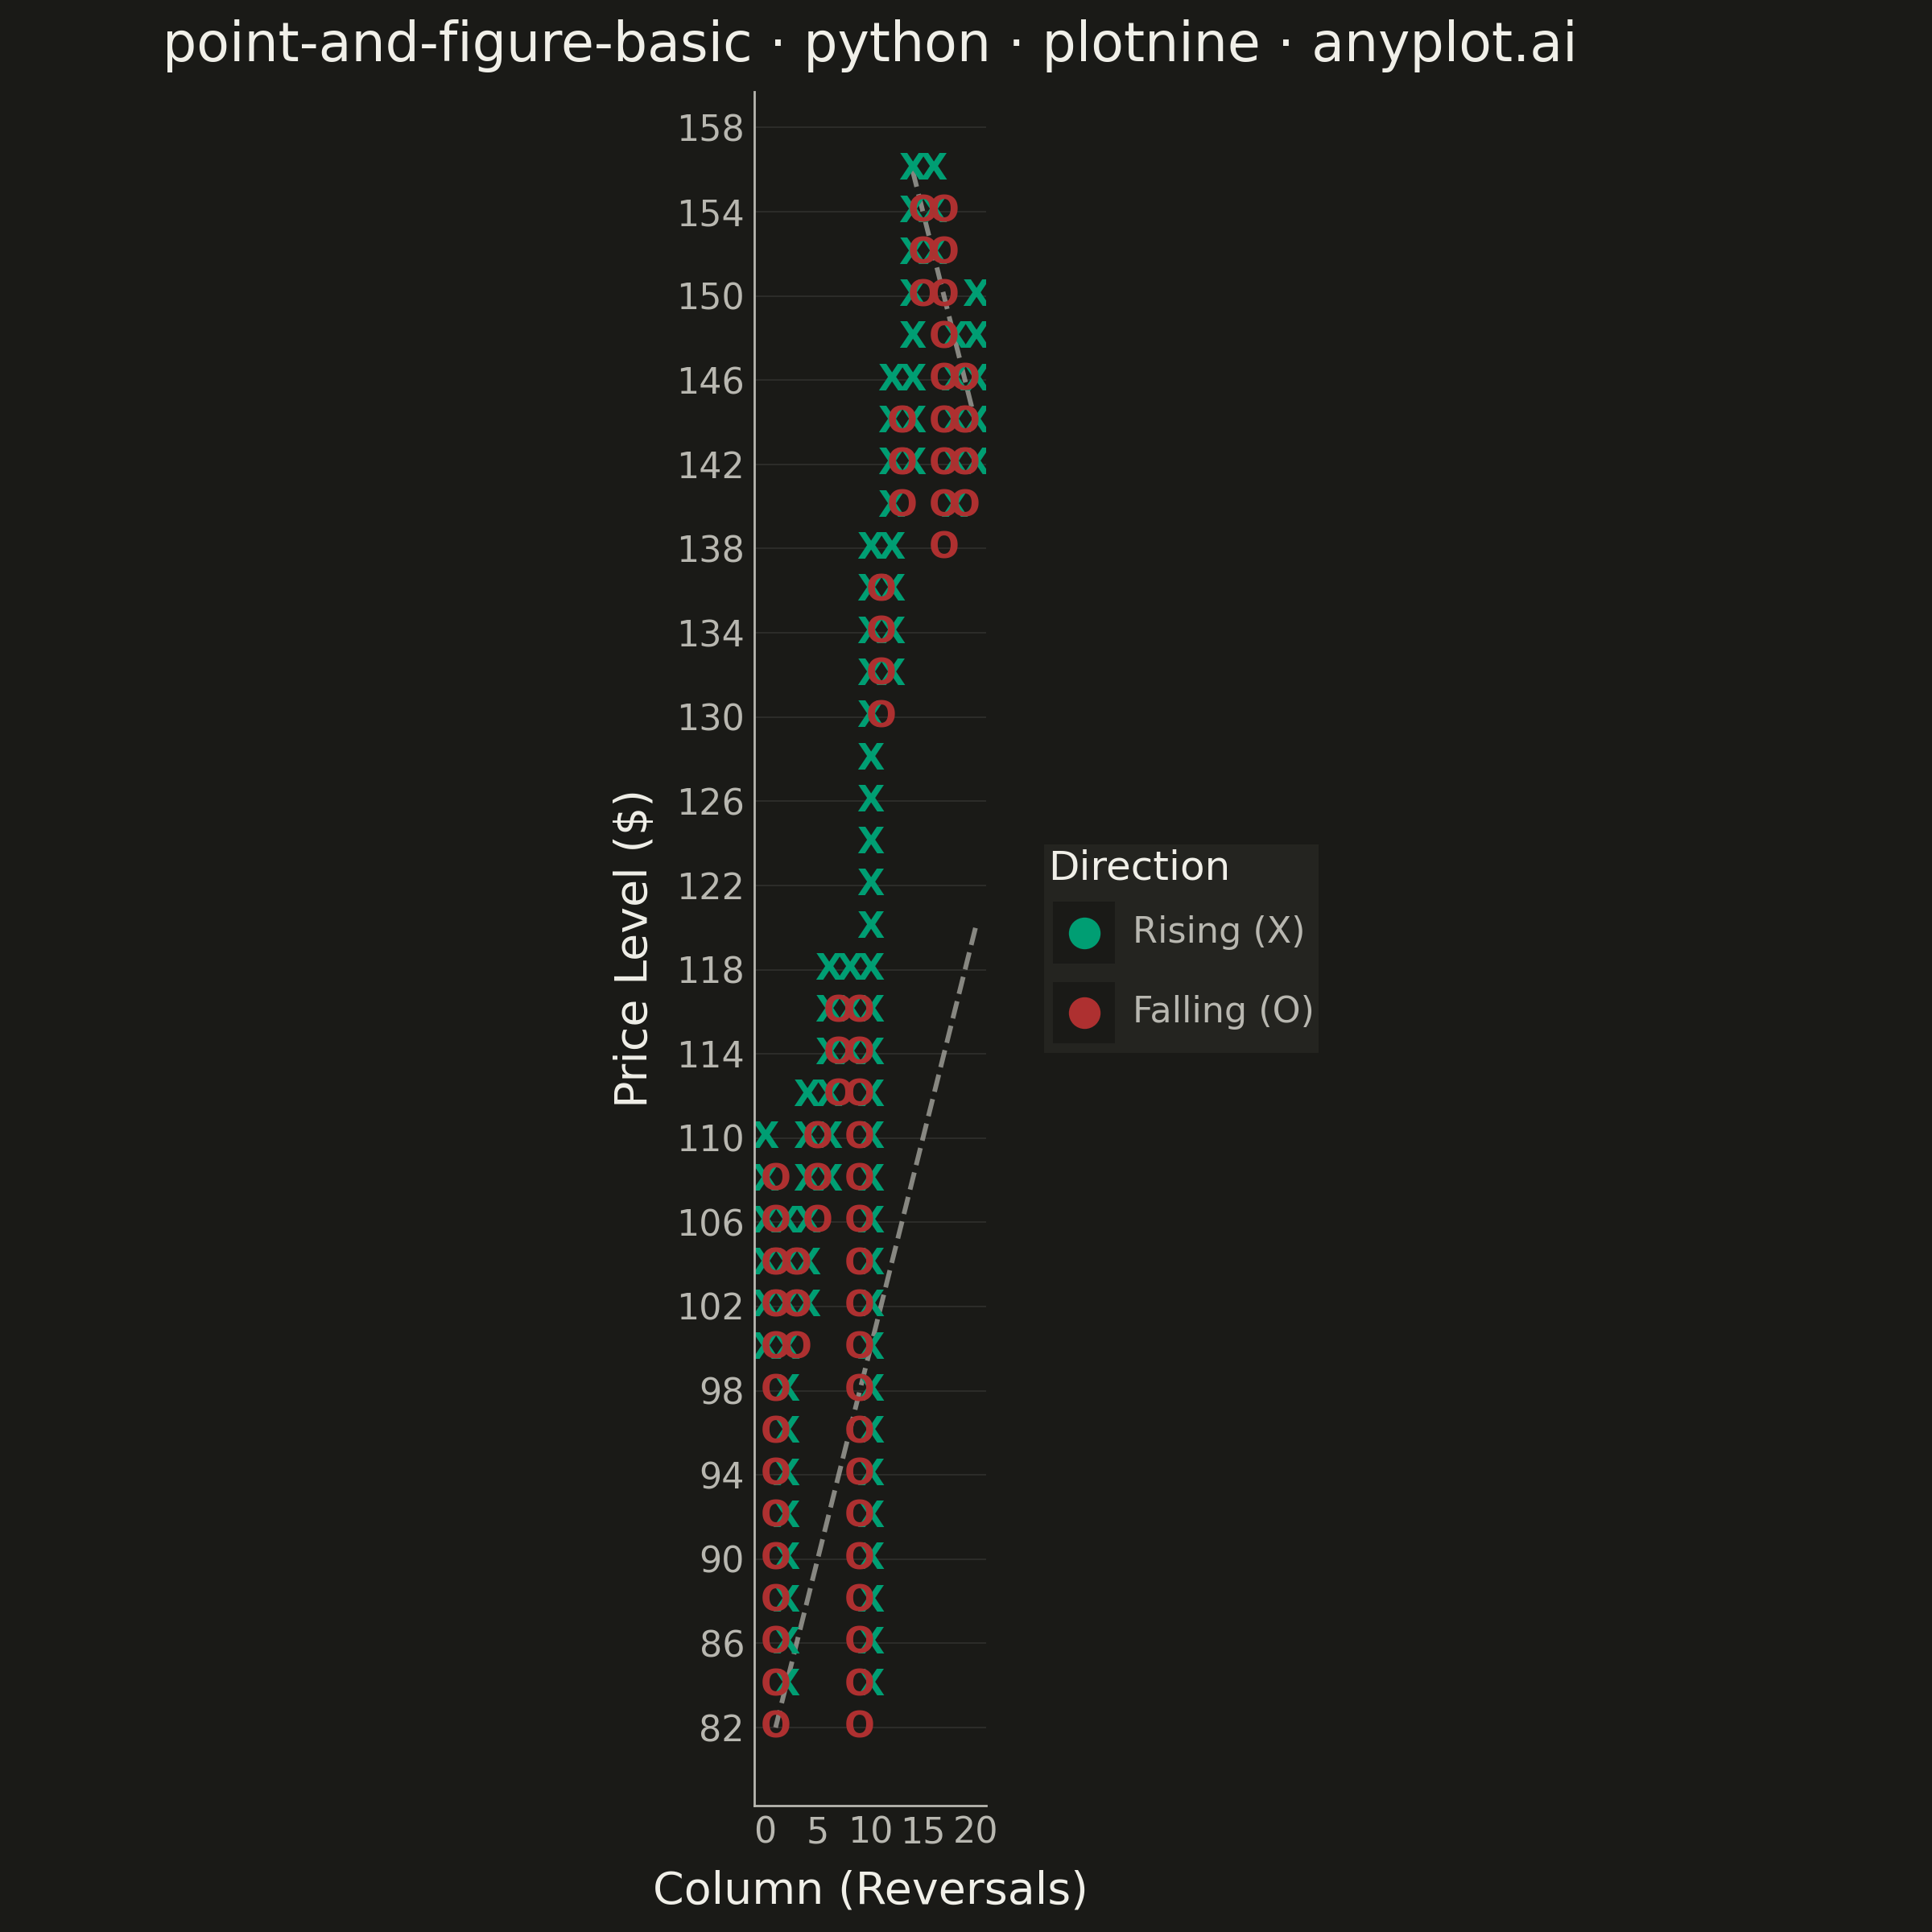
A Point and Figure (P&F) chart is a price-action focused visualization that uses columns of X's (rising prices) and O's (falling prices) to display significant price movements while filtering out time and minor fluctuations. Unlike traditional time-based charts, P&F charts only plot a new symbol when price moves by a defined box size, and only start a new column when price reverses by a specified number of boxes (typically 3). This makes it ideal for identifying clear trends, support/resistance levels, and generating trading signals.
""" anyplot.ai
point-and-figure-basic: Point and Figure Chart
Library: plotnine 0.15.4 | Python 3.13.13
Quality: 83/100 | Updated: 2026-05-20
"""

import os
import sys


# Work around filename shadowing the plotnine library
sys.path.pop(0)
import numpy as np
import pandas as pd
from plotnine import (
    aes,
    coord_fixed,
    element_blank,
    element_line,
    element_rect,
    element_text,
    geom_point,
    geom_segment,
    geom_text,
    ggplot,
    guide_legend,
    guides,
    labs,
    scale_color_manual,
    scale_y_continuous,
    theme,
    theme_minimal,
)


THEME = os.getenv("ANYPLOT_THEME", "light")
PAGE_BG = "#FAF8F1" if THEME == "light" else "#1A1A17"
ELEVATED_BG = "#FFFDF6" if THEME == "light" else "#242420"
INK = "#1A1A17" if THEME == "light" else "#F0EFE8"
INK_SOFT = "#4A4A44" if THEME == "light" else "#B8B7B0"

X_COLOR = "#009E73"  # imprint green - rising columns
O_COLOR = "#AE3030"  # imprint red - falling columns

# Data
np.random.seed(42)
n_days = 300

returns = np.random.normal(0.001, 0.02, n_days)
returns[50:100] += 0.005
returns[120:160] -= 0.008
returns[180:250] += 0.004

price = 100 * np.cumprod(1 + returns)
close = price

box_size = 2.0
reversal = 3

# Build Point and Figure data
pf_data = []
current_direction = None
current_column = 0

start_box = int(np.floor(close[0] / box_size))
current_high_box = start_box
current_low_box = start_box

for i in range(1, len(close)):
    current_box = int(np.floor(close[i] / box_size))

    if current_direction is None:
        if current_box > current_high_box:
            current_direction = "X"
            for b in range(current_low_box, current_box + 1):
                pf_data.append((current_column, b * box_size, "X"))
            current_high_box = current_box
        elif current_box < current_low_box:
            current_direction = "O"
            for b in range(current_box, current_high_box + 1):
                pf_data.append((current_column, b * box_size, "O"))
            current_low_box = current_box

    elif current_direction == "X":
        if current_box > current_high_box:
            for b in range(current_high_box + 1, current_box + 1):
                pf_data.append((current_column, b * box_size, "X"))
            current_high_box = current_box
        elif current_box <= current_high_box - reversal:
            current_column += 1
            current_direction = "O"
            current_low_box = current_box
            for b in range(current_box, current_high_box):
                pf_data.append((current_column, b * box_size, "O"))

    elif current_direction == "O":
        if current_box < current_low_box:
            for b in range(current_box, current_low_box):
                pf_data.append((current_column, b * box_size, "O"))
            current_low_box = current_box
        elif current_box >= current_low_box + reversal:
            current_column += 1
            current_direction = "X"
            current_high_box = current_box
            for b in range(current_low_box + 1, current_box + 1):
                pf_data.append((current_column, b * box_size, "X"))

df = pd.DataFrame(pf_data, columns=["column", "price", "symbol"])
# Use full label text as the color aesthetic value to avoid plotnine legend prefix bug
df["direction"] = pd.Categorical(
    df["symbol"].map({"X": "Rising (X)", "O": "Falling (O)"}), categories=["Rising (X)", "Falling (O)"]
)

# 45-degree support and resistance trend lines (one box per column)
min_idx = df["price"].idxmin()
max_idx = df["price"].idxmax()
max_col = float(df["column"].max())
support_col = float(df.loc[min_idx, "column"])
support_price = float(df.loc[min_idx, "price"])
resist_col = float(df.loc[max_idx, "column"])
resist_price = float(df.loc[max_idx, "price"])

trend_lines = pd.DataFrame(
    {
        "x": [support_col, resist_col],
        "y": [support_price, resist_price],
        "xend": [max_col, max_col],
        "yend": [support_price + (max_col - support_col) * box_size, resist_price - (max_col - resist_col) * box_size],
    }
)

# Plot
plot = (
    ggplot(df, aes(x="column", y="price"))
    + geom_segment(
        data=trend_lines,
        mapping=aes(x="x", y="y", xend="xend", yend="yend"),
        color=INK_SOFT,
        size=0.6,
        linetype="dashed",
        alpha=0.7,
        inherit_aes=False,
    )
    + geom_text(mapping=aes(color="direction", label="symbol"), size=8, fontweight="bold", show_legend=False)
    + geom_point(mapping=aes(color="direction"), size=0.01, alpha=0.01)
    + coord_fixed(ratio=box_size)
    + scale_color_manual(values={"Rising (X)": X_COLOR, "Falling (O)": O_COLOR}, name="Direction")
    + guides(color=guide_legend(override_aes={"size": 3, "alpha": 1}))
    + scale_y_continuous(
        breaks=np.arange(
            int(df["price"].min() / box_size) * box_size, int(df["price"].max() / box_size + 2) * box_size, box_size * 2
        )
    )
    + labs(x="Column (Reversals)", y="Price Level ($)", title="point-and-figure-basic · python · plotnine · anyplot.ai")
    + theme_minimal()
    + theme(
        figure_size=(6, 6),
        text=element_text(size=7, color=INK),
        axis_title=element_text(size=10, color=INK),
        axis_text=element_text(size=8, color=INK_SOFT),
        plot_title=element_text(size=12, color=INK),
        legend_text=element_text(size=8, color=INK_SOFT),
        legend_title=element_text(size=9, color=INK),
        plot_background=element_rect(fill=PAGE_BG, color=PAGE_BG),
        panel_background=element_rect(fill=PAGE_BG),
        legend_background=element_rect(fill=ELEVATED_BG, size=0),
        panel_border=element_blank(),
        axis_line=element_line(color=INK_SOFT, size=0.5),
        panel_grid_major_x=element_blank(),
        panel_grid_minor=element_blank(),
        panel_grid_major_y=element_line(color=INK, size=0.3, alpha=0.10),
    )
)

plot.save(f"plot-{THEME}.png", dpi=400, width=6, height=6, units="in")
Runnable source as JSON, for any HTTP client: https://api.anyplot.ai/specs/point-and-figure-basic/plotnine/code. Any spec id and library id listed in llms-full.txt fit the same URL shape; every URL below is complete and callable.
{
  "spec_id": "point-and-figure-basic",
  "language": "python",
  "library": "plotnine",
  "page": "https://anyplot.ai/point-and-figure-basic/python/plotnine",
  "hub": "https://anyplot.ai/point-and-figure-basic",
  "code_json": "https://api.anyplot.ai/specs/point-and-figure-basic/plotnine/code",
  "spec_json": "https://api.anyplot.ai/specs/point-and-figure-basic",
  "render_light_png": "https://storage.googleapis.com/anyplot-images/plots/point-and-figure-basic/python/plotnine/plot-light.png",
  "render_dark_png": "https://storage.googleapis.com/anyplot-images/plots/point-and-figure-basic/python/plotnine/plot-dark.png",
  "quality_score": 83.0,
  "license": "MIT",
  "guide": "https://anyplot.ai/llms.txt"
}
Part of Point and Figure Chart on anyplot.ai.