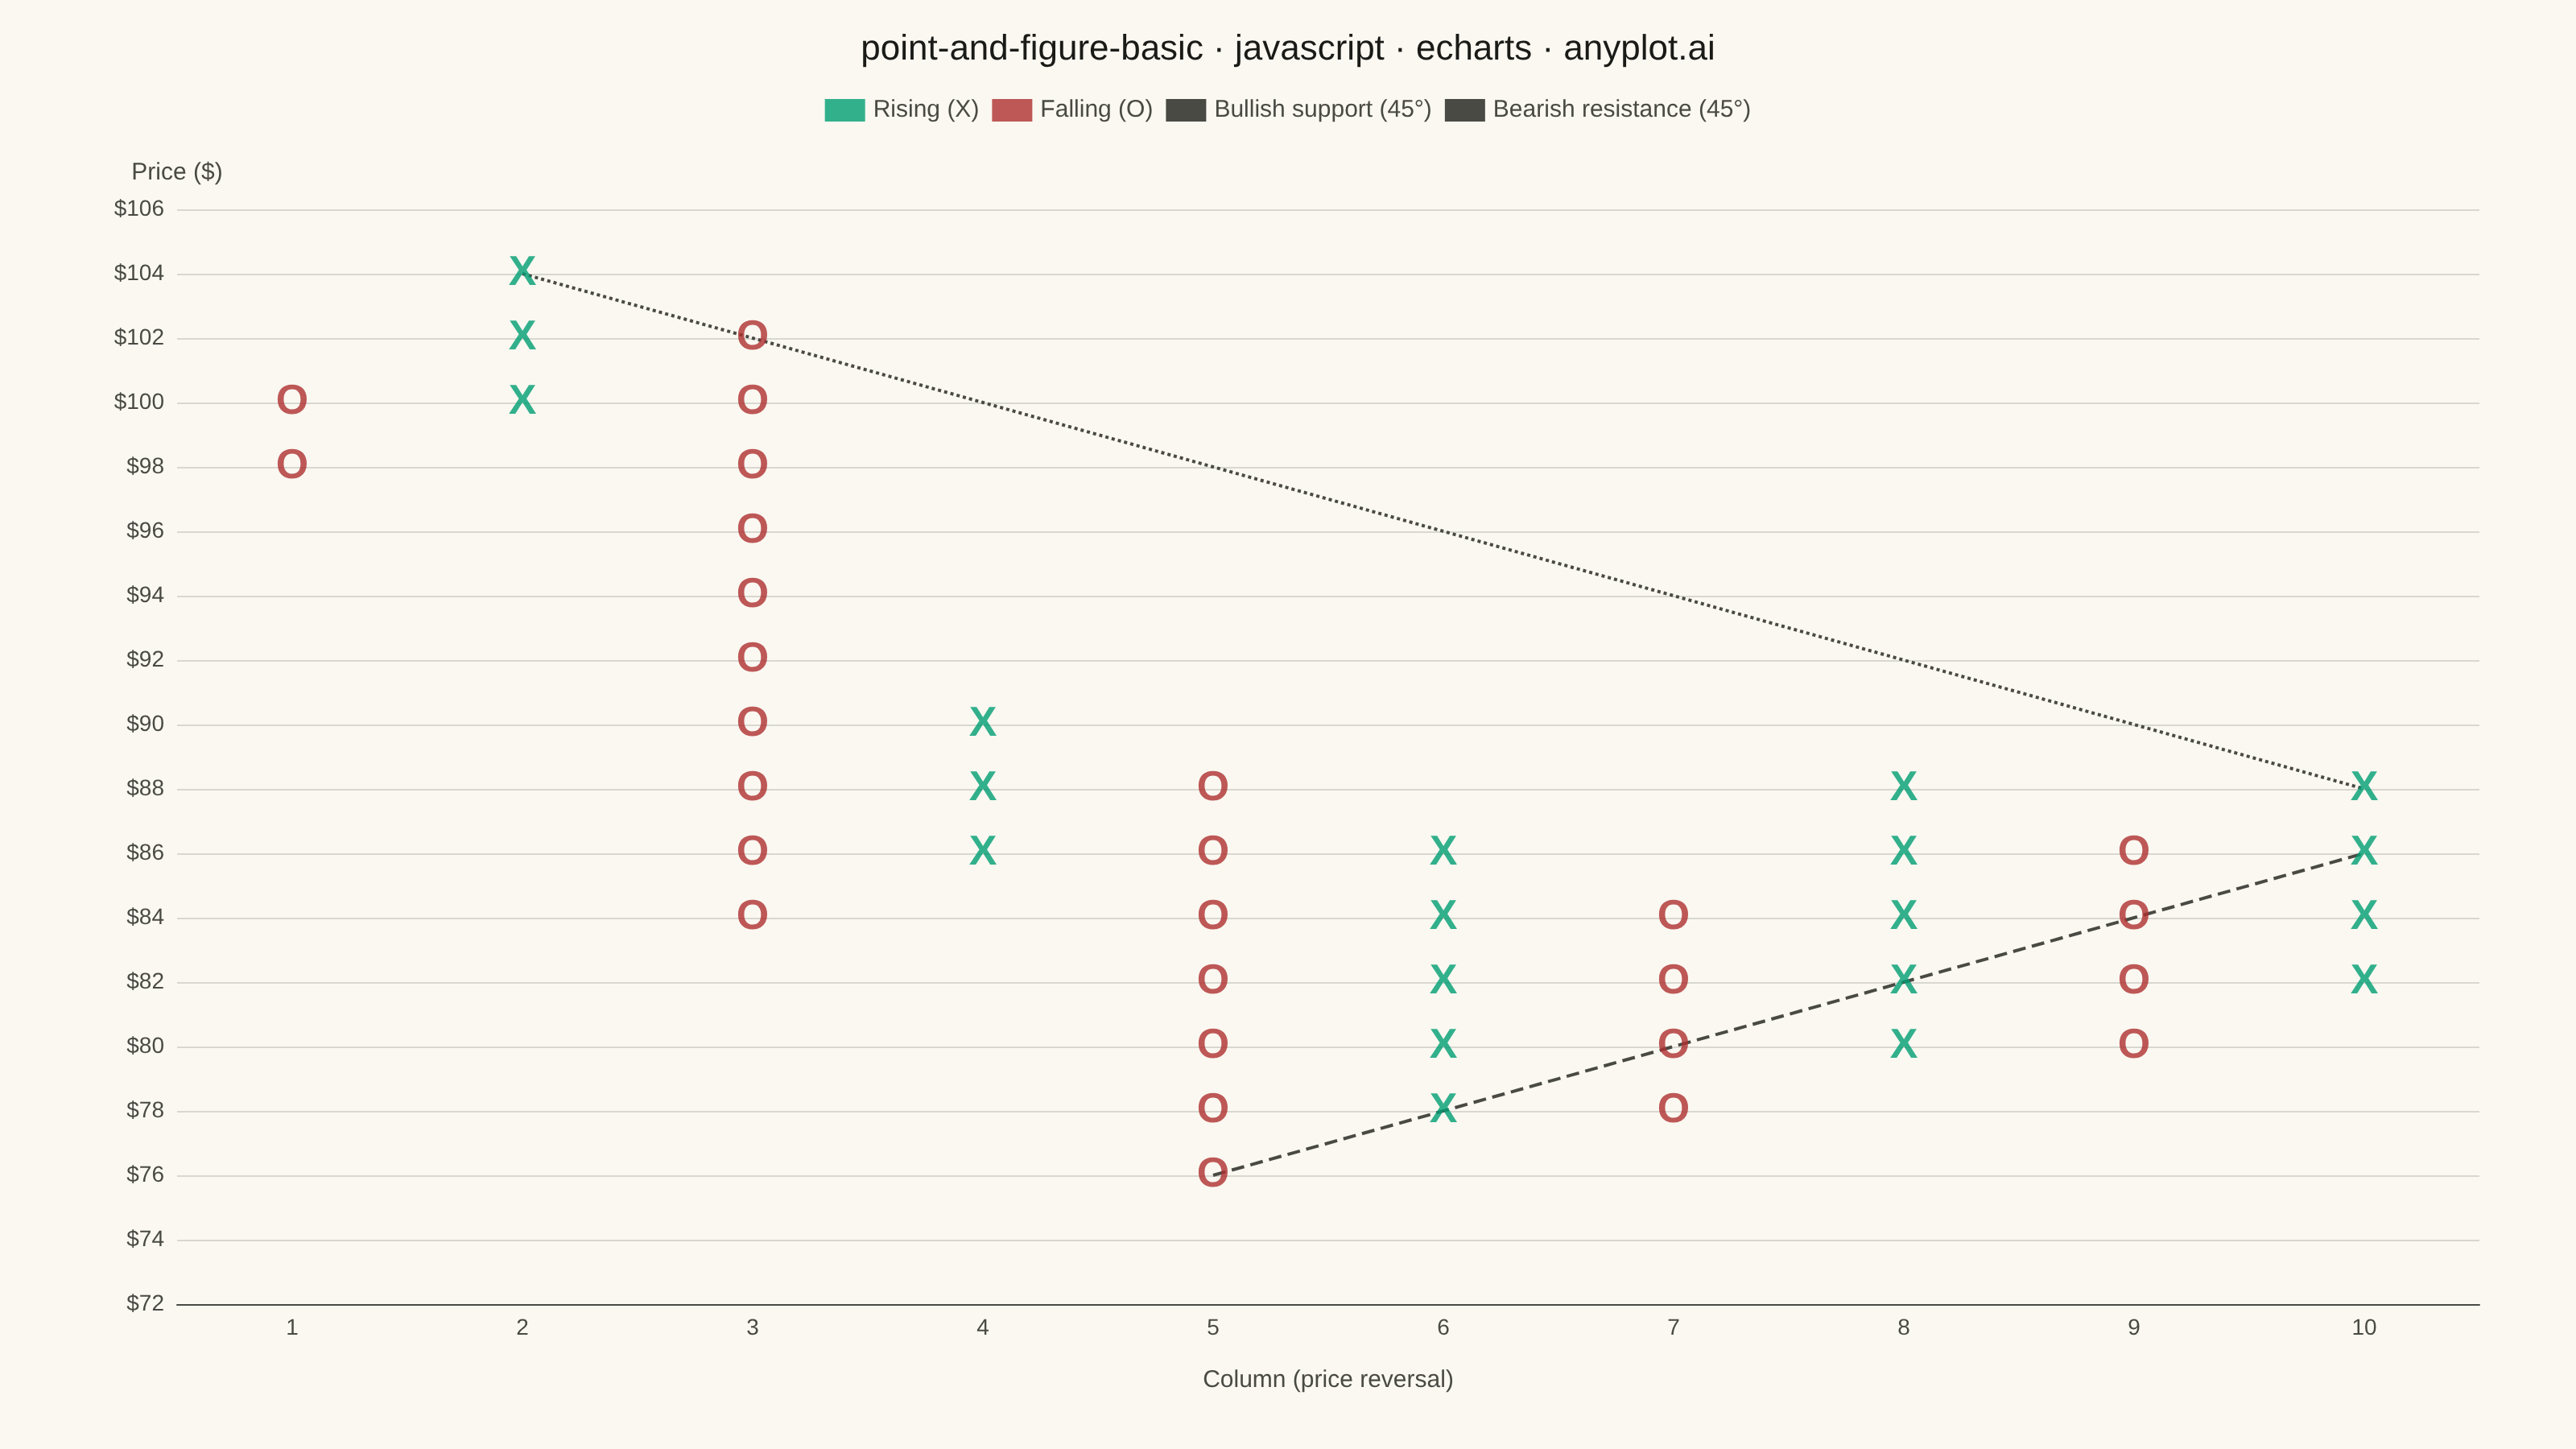
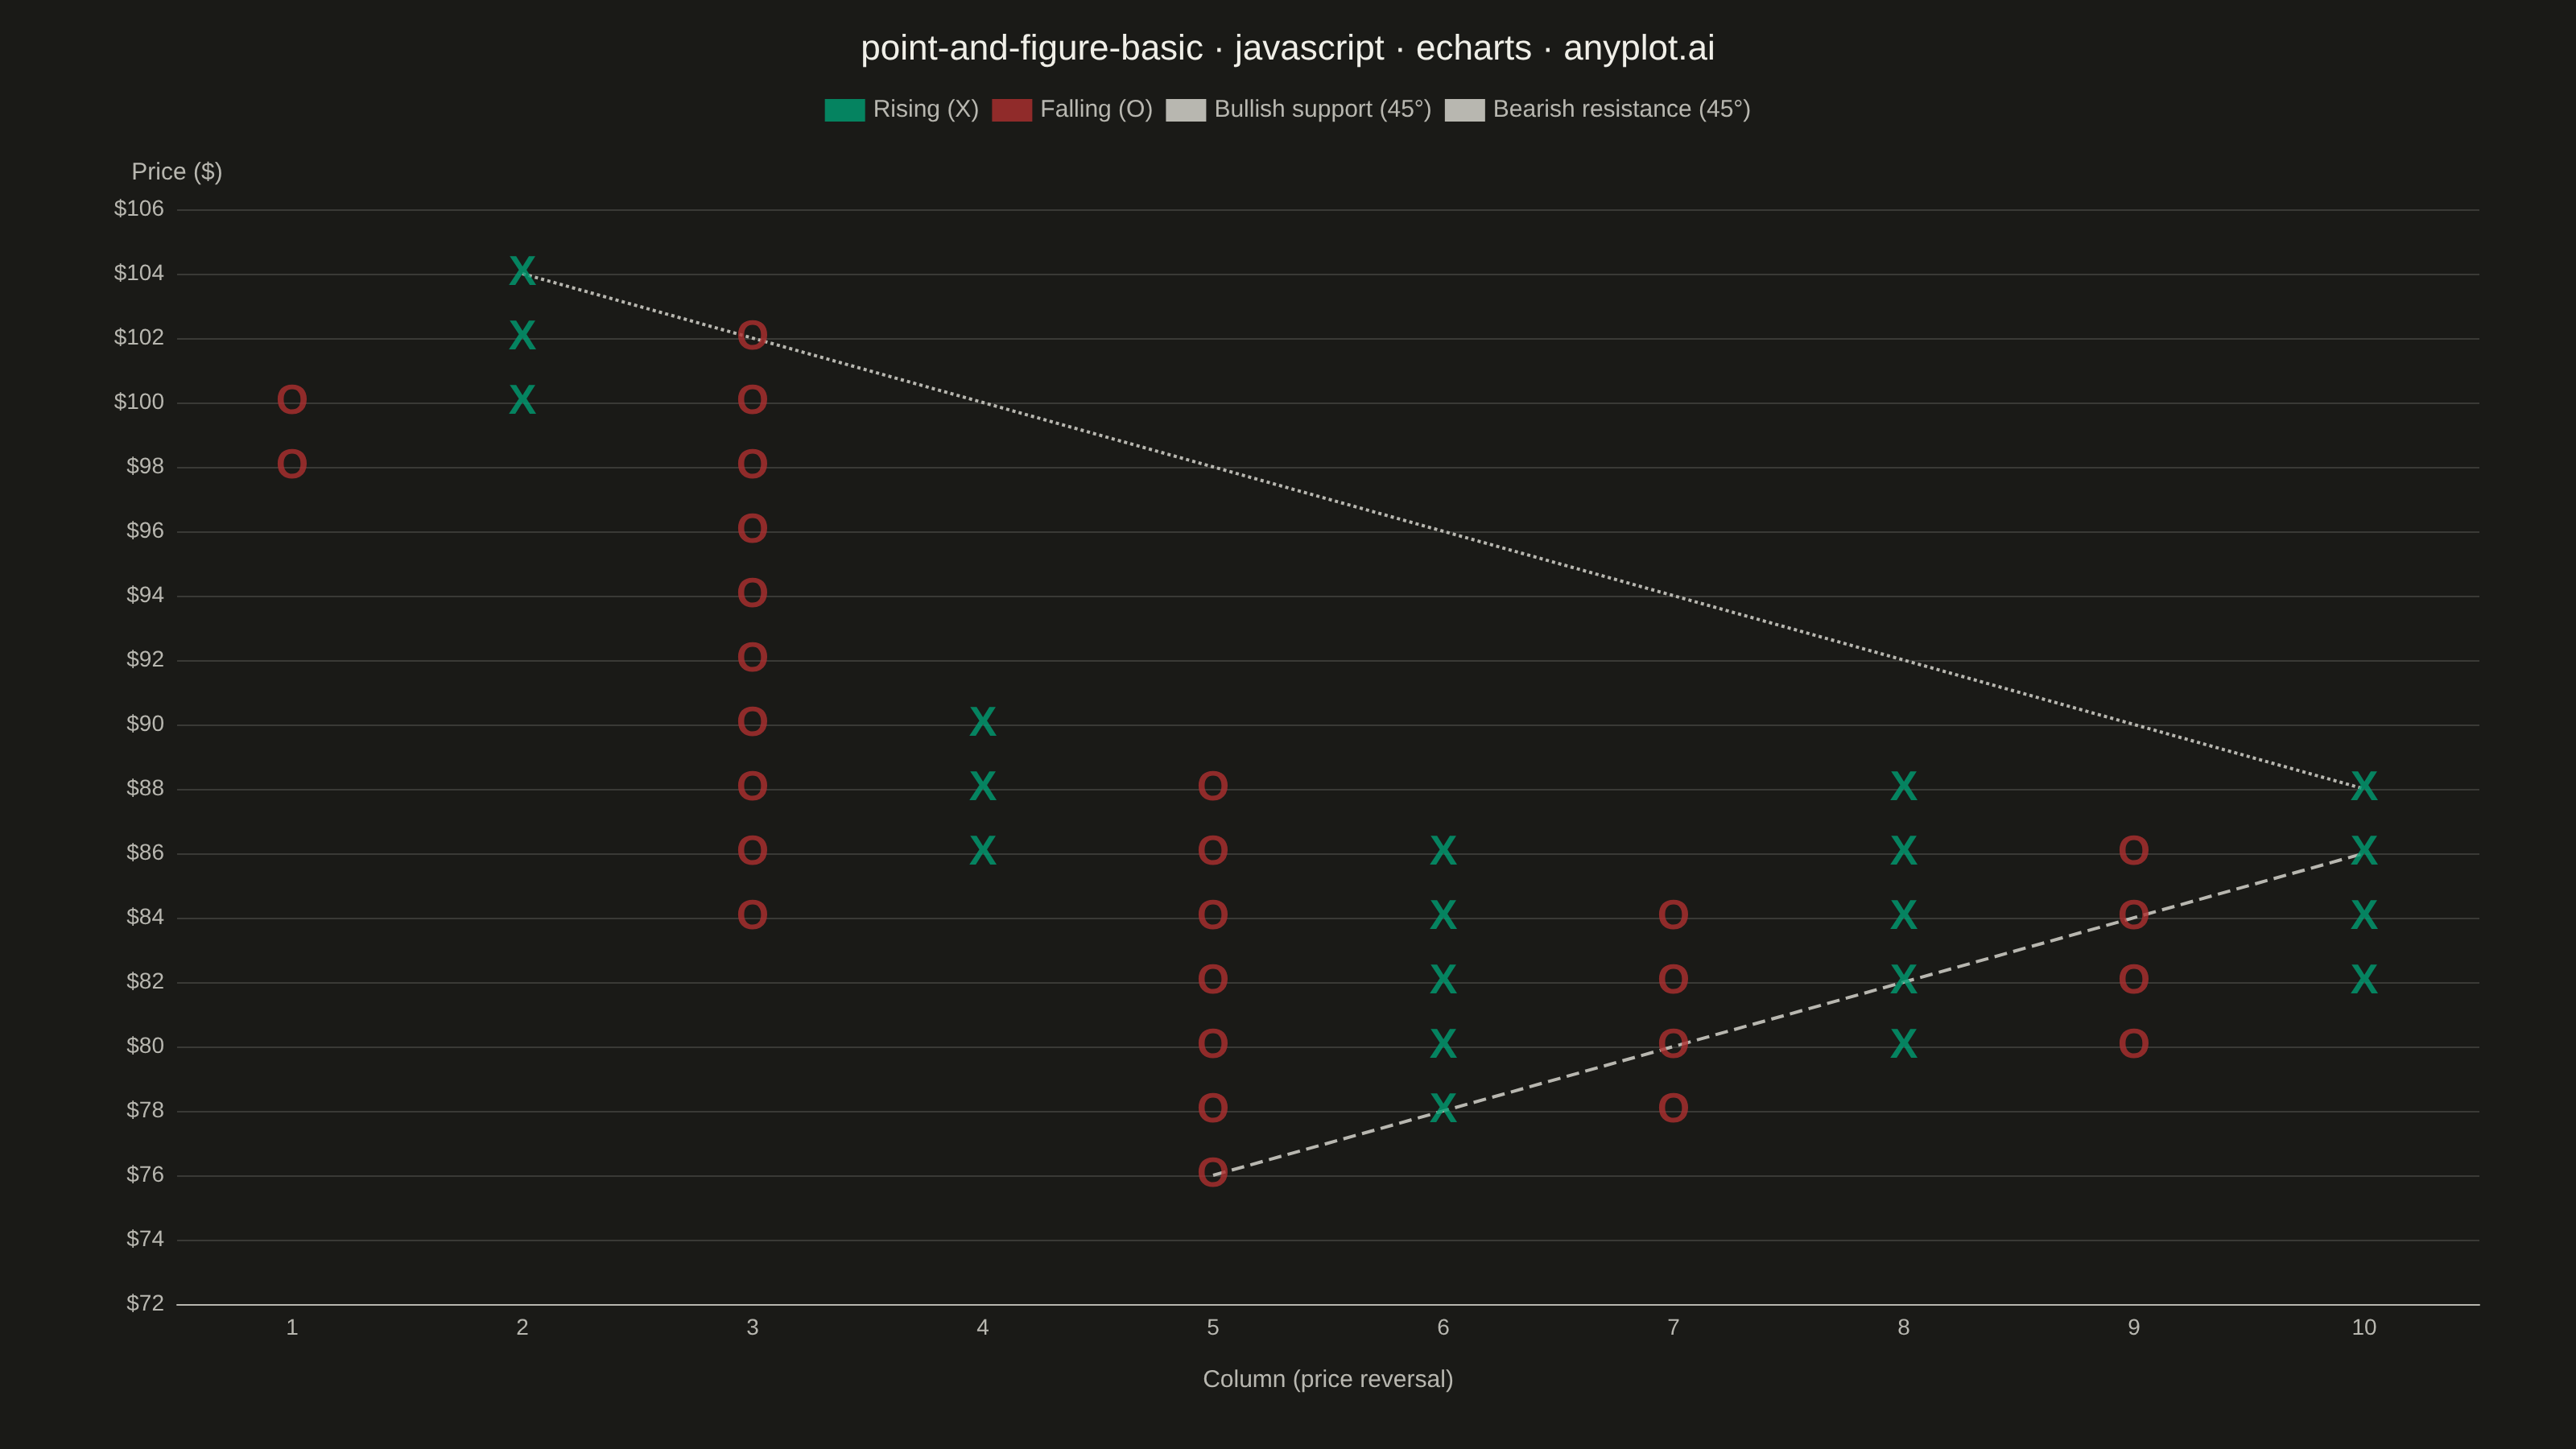
The same plot in 14 other libraries — JavaScript: Chart.js, D3.js, Highcharts, MUI X Charts; Python: Altair, Bokeh, lets-plot, Matplotlib, Plotly, plotnine, Pygal, Seaborn; R: ggplot2; Julia: Makie.jl. Compare all 15 side by side: Point and Figure Chart in Python, R, Julia and JavaScript.
A Point and Figure (P&F) chart is a price-action focused visualization that uses columns of X's (rising prices) and O's (falling prices) to display significant price movements while filtering out time and minor fluctuations. Unlike traditional time-based charts, P&F charts only plot a new symbol when price moves by a defined box size, and only start a new column when price reverses by a specified number of boxes (typically 3). This makes it ideal for identifying clear trends, support/resistance levels, and generating trading signals.
// anyplot.ai
// point-and-figure-basic: Point and Figure Chart
// Library: echarts 6.1.0 | JavaScript 22.23.2
// Quality: 91/100 | Created: 2026-09-02

const t = window.ANYPLOT_TOKENS;

// --- Data: simulated daily closes for a mid-cap tech stock -----------------
// Deterministic LCG (no network, no Math.random) driving a regime-switching
// random walk so the price alternates between multi-week up/down swings.
function makeLcg(seed) {
  let state = seed >>> 0;
  return () => {
    state = (state * 1664525 + 1013904223) >>> 0;
    return state / 4294967296;
  };
}
const rnd = makeLcg(391);

const CLOSE_COUNT = 280;
const closes = [];
let price = 100;
let regime = 1;
let regimeDaysLeft = 0;
for (let i = 0; i < CLOSE_COUNT; i++) {
  regimeDaysLeft -= 1;
  if (regimeDaysLeft <= 0) {
    regime = (rnd() - 0.5) * 2;
    regimeDaysLeft = 8 + Math.floor(rnd() * 12);
  }
  price += regime * 0.35 + (rnd() - 0.5) * 3.2;
  price = Math.max(20, price);
  closes.push(Math.round(price * 100) / 100);
}

// --- Point-and-figure column construction -----------------------------------
// Box size: $2 per box. Reversal: 3 boxes required to start a new column.
const BOX_SIZE = 2;
const REVERSAL = 3;
const priceToBox = (p) => Math.round(p / BOX_SIZE);

const columns = [];
let direction = null; // "up" | "down"
let boxes = [priceToBox(closes[0])];
for (let i = 1; i < closes.length; i++) {
  const box = priceToBox(closes[i]);
  const lastBox = boxes[boxes.length - 1];
  if (direction === null) {
    if (box > lastBox) {
      for (let b = lastBox + 1; b <= box; b++) boxes.push(b);
      direction = "up";
    } else if (box < lastBox) {
      for (let b = lastBox - 1; b >= box; b--) boxes.push(b);
      direction = "down";
    }
  } else if (direction === "up") {
    if (box > lastBox) {
      for (let b = lastBox + 1; b <= box; b++) boxes.push(b);
    } else if (box <= lastBox - REVERSAL) {
      columns.push({ direction, boxes });
      const start = lastBox - 1;
      boxes = [];
      for (let b = start; b >= box; b--) boxes.push(b);
      direction = "down";
    }
  } else {
    if (box < lastBox) {
      for (let b = lastBox - 1; b >= box; b--) boxes.push(b);
    } else if (box >= lastBox + REVERSAL) {
      columns.push({ direction, boxes });
      const start = lastBox + 1;
      boxes = [];
      for (let b = start; b <= box; b++) boxes.push(b);
      direction = "up";
    }
  }
}
columns.push({ direction, boxes });

// --- Chart-ready points -------------------------------------------------
const risingPoints = []; // X — rising columns
const fallingPoints = []; // O — falling columns
let globalMinBox = Infinity;
let globalMaxBox = -Infinity;
let bottomColumn = 0;
let topColumn = 0;
// Category-axis x-values must match the category strings exactly — a plain
// number is treated as a 0-based category *index*, which silently drops the
// last column and shifts every other column by one.
columns.forEach((col, colIndex) => {
  const colNumber = colIndex + 1;
  const target = col.direction === "up" ? risingPoints : fallingPoints;
  col.boxes.forEach((b) => {
    target.push([String(colNumber), b * BOX_SIZE]);
    if (b < globalMinBox) {
      globalMinBox = b;
      bottomColumn = colNumber;
    }
    if (b > globalMaxBox) {
      globalMaxBox = b;
      topColumn = colNumber;
    }
  });
});

// Bullish support line: a classic P&F trend line anchored on the deepest
// reversal low, rising at the canonical 45-degree rate of one box per column.
const supportStart = [String(bottomColumn), globalMinBox * BOX_SIZE];
const supportEnd = [
  String(columns.length),
  (globalMinBox + (columns.length - bottomColumn)) * BOX_SIZE,
];

// Bearish resistance line: mirrors the support line's construction, anchored
// on the highest reversal high and descending at the same 45-degree rate.
const resistanceStart = [String(topColumn), globalMaxBox * BOX_SIZE];
const resistanceEnd = [
  String(columns.length),
  (globalMaxBox - (columns.length - topColumn)) * BOX_SIZE,
];

// --- Option -------------------------------------------------------------
const chart = echarts.init(document.getElementById("container"));
chart.setOption({
  animation: false,
  backgroundColor: "transparent",
  title: {
    text: "point-and-figure-basic · javascript · echarts · anyplot.ai",
    left: "center",
    textStyle: { color: t.ink, fontSize: 22, fontWeight: 500 },
  },
  legend: {
    top: 56,
    // Series markers are transparent (only the X/O label glyph is visible),
    // so the legend needs its own swatch colors rather than inheriting them.
    data: [
      { name: "Rising (X)", icon: "rect", itemStyle: { color: t.palette[0] } },
      { name: "Falling (O)", icon: "rect", itemStyle: { color: t.palette[4] } },
      { name: "Bullish support (45°)", icon: "rect", itemStyle: { color: t.inkSoft } },
      { name: "Bearish resistance (45°)", icon: "rect", itemStyle: { color: t.inkSoft } },
    ],
    textStyle: { color: t.inkSoft, fontSize: 15 },
  },
  grid: { left: 110, right: 60, top: 130, bottom: 90 },
  xAxis: {
    type: "category",
    name: "Column (price reversal)",
    nameLocation: "middle",
    nameGap: 40,
    nameTextStyle: { color: t.inkSoft, fontSize: 15 },
    data: columns.map((_, i) => String(i + 1)),
    axisLabel: { color: t.inkSoft, fontSize: 14 },
    axisLine: { lineStyle: { color: t.inkSoft } },
    axisTick: { show: false },
    splitLine: { show: false },
  },
  yAxis: {
    type: "value",
    name: "Price ($)",
    nameTextStyle: { color: t.inkSoft, fontSize: 15 },
    min: (globalMinBox - 2) * BOX_SIZE,
    max: (globalMaxBox + 1) * BOX_SIZE,
    interval: BOX_SIZE,
    axisLabel: { color: t.inkSoft, fontSize: 14, formatter: "${value}" },
    axisLine: { show: false },
    axisTick: { show: false },
    splitLine: { lineStyle: { color: t.grid } },
  },
  series: [
    {
      name: "Rising (X)",
      type: "scatter",
      data: risingPoints,
      symbol: "circle",
      symbolSize: 30,
      itemStyle: { color: "transparent" },
      label: {
        show: true,
        position: "inside",
        formatter: "X",
        fontSize: 26,
        fontWeight: 700,
        color: t.palette[0],
      },
      tooltip: { valueFormatter: (v) => `$${v}` },
      z: 3,
    },
    {
      name: "Falling (O)",
      type: "scatter",
      data: fallingPoints,
      symbol: "circle",
      symbolSize: 30,
      itemStyle: { color: "transparent" },
      label: {
        show: true,
        position: "inside",
        formatter: "O",
        fontSize: 26,
        fontWeight: 700,
        color: t.palette[4],
      },
      tooltip: { valueFormatter: (v) => `$${v}` },
      z: 3,
    },
    {
      name: "Bullish support (45°)",
      type: "line",
      data: [supportStart, supportEnd],
      showSymbol: false,
      lineStyle: { color: t.inkSoft, width: 2, type: "dashed" },
      z: 2,
      tooltip: { show: false },
    },
    {
      name: "Bearish resistance (45°)",
      type: "line",
      data: [resistanceStart, resistanceEnd],
      showSymbol: false,
      lineStyle: { color: t.inkSoft, width: 2, type: "dotted" },
      z: 2,
      tooltip: { show: false },
    },
  ],
});
Runnable source as JSON, for any HTTP client: https://api.anyplot.ai/specs/point-and-figure-basic/echarts/code. Any spec id and library id listed in llms-full.txt fit the same URL shape; every URL below is complete and callable.
{
  "spec_id": "point-and-figure-basic",
  "language": "javascript",
  "library": "echarts",
  "page": "https://anyplot.ai/point-and-figure-basic/javascript/echarts",
  "hub": "https://anyplot.ai/point-and-figure-basic",
  "code_json": "https://api.anyplot.ai/specs/point-and-figure-basic/echarts/code",
  "spec_json": "https://api.anyplot.ai/specs/point-and-figure-basic",
  "render_light_png": "https://storage.googleapis.com/anyplot-images/plots/point-and-figure-basic/javascript/echarts/plot-light.png",
  "render_dark_png": "https://storage.googleapis.com/anyplot-images/plots/point-and-figure-basic/javascript/echarts/plot-dark.png",
  "interactive_light_html": "https://storage.googleapis.com/anyplot-images/plots/point-and-figure-basic/javascript/echarts/plot-light.html",
  "interactive_dark_html": "https://storage.googleapis.com/anyplot-images/plots/point-and-figure-basic/javascript/echarts/plot-dark.html",
  "quality_score": 91.0,
  "license": "MIT",
  "guide": "https://anyplot.ai/llms.txt"
}
Part of Point and Figure Chart on anyplot.ai.