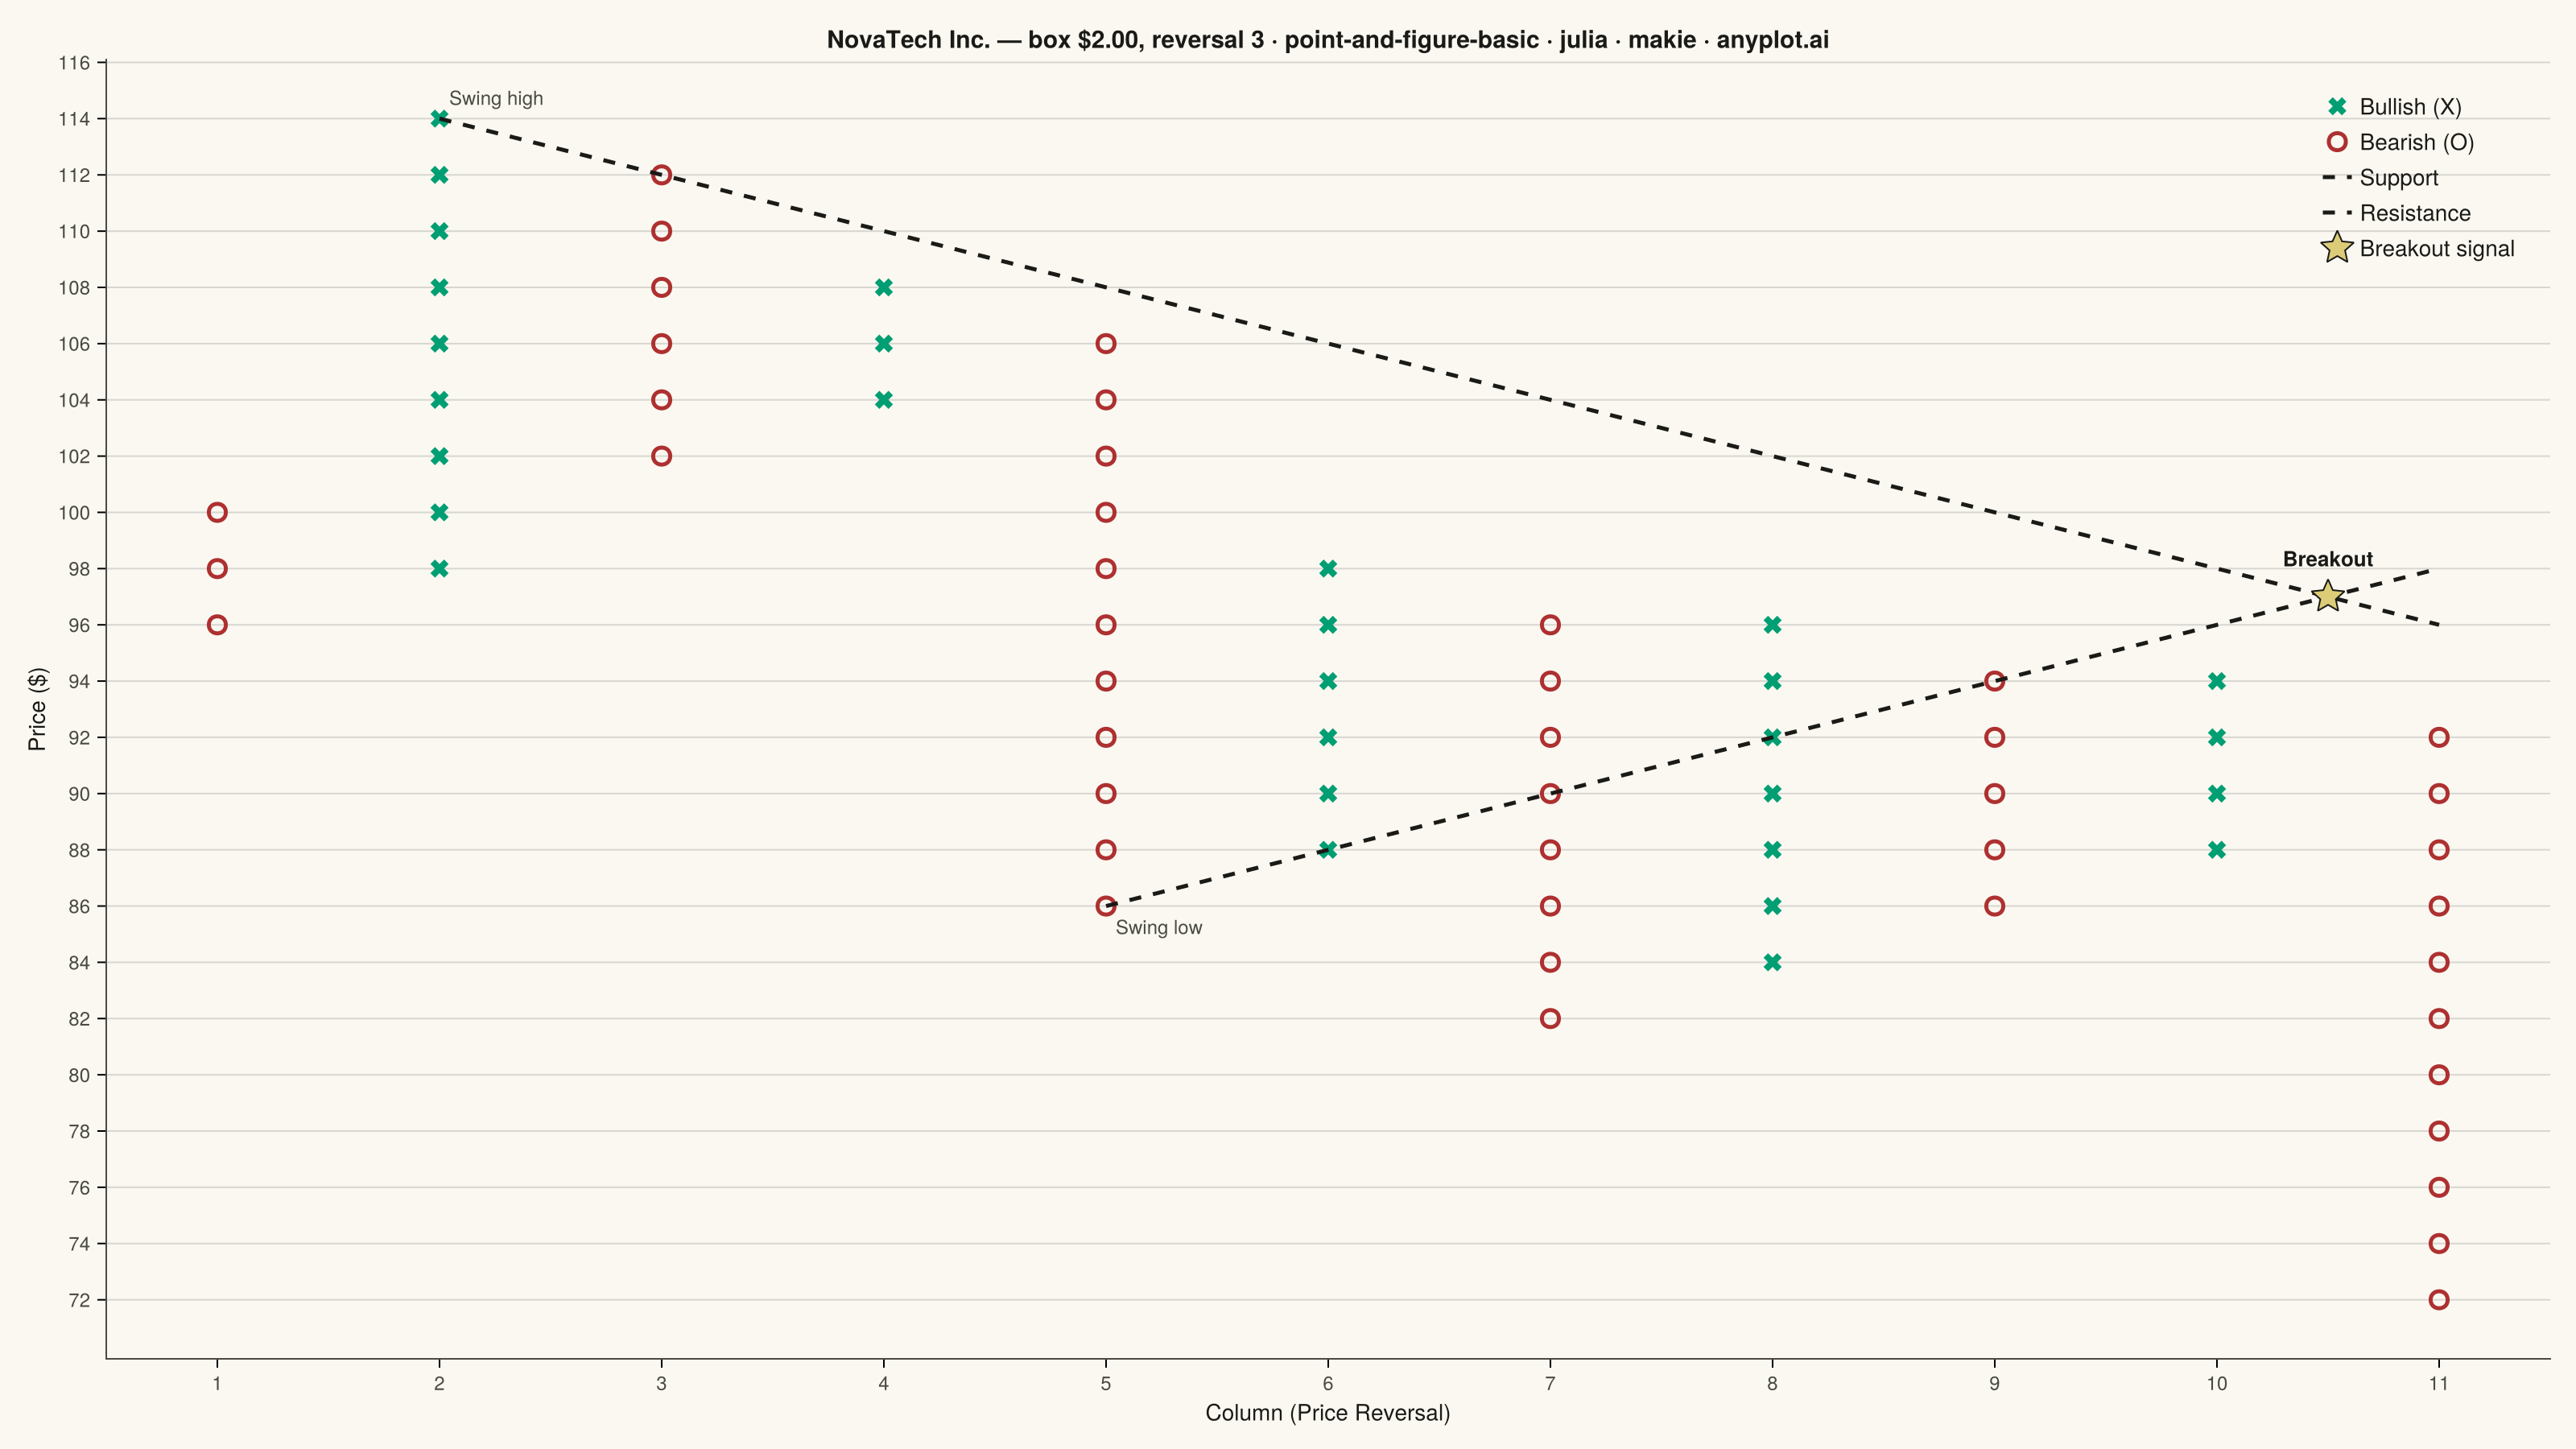
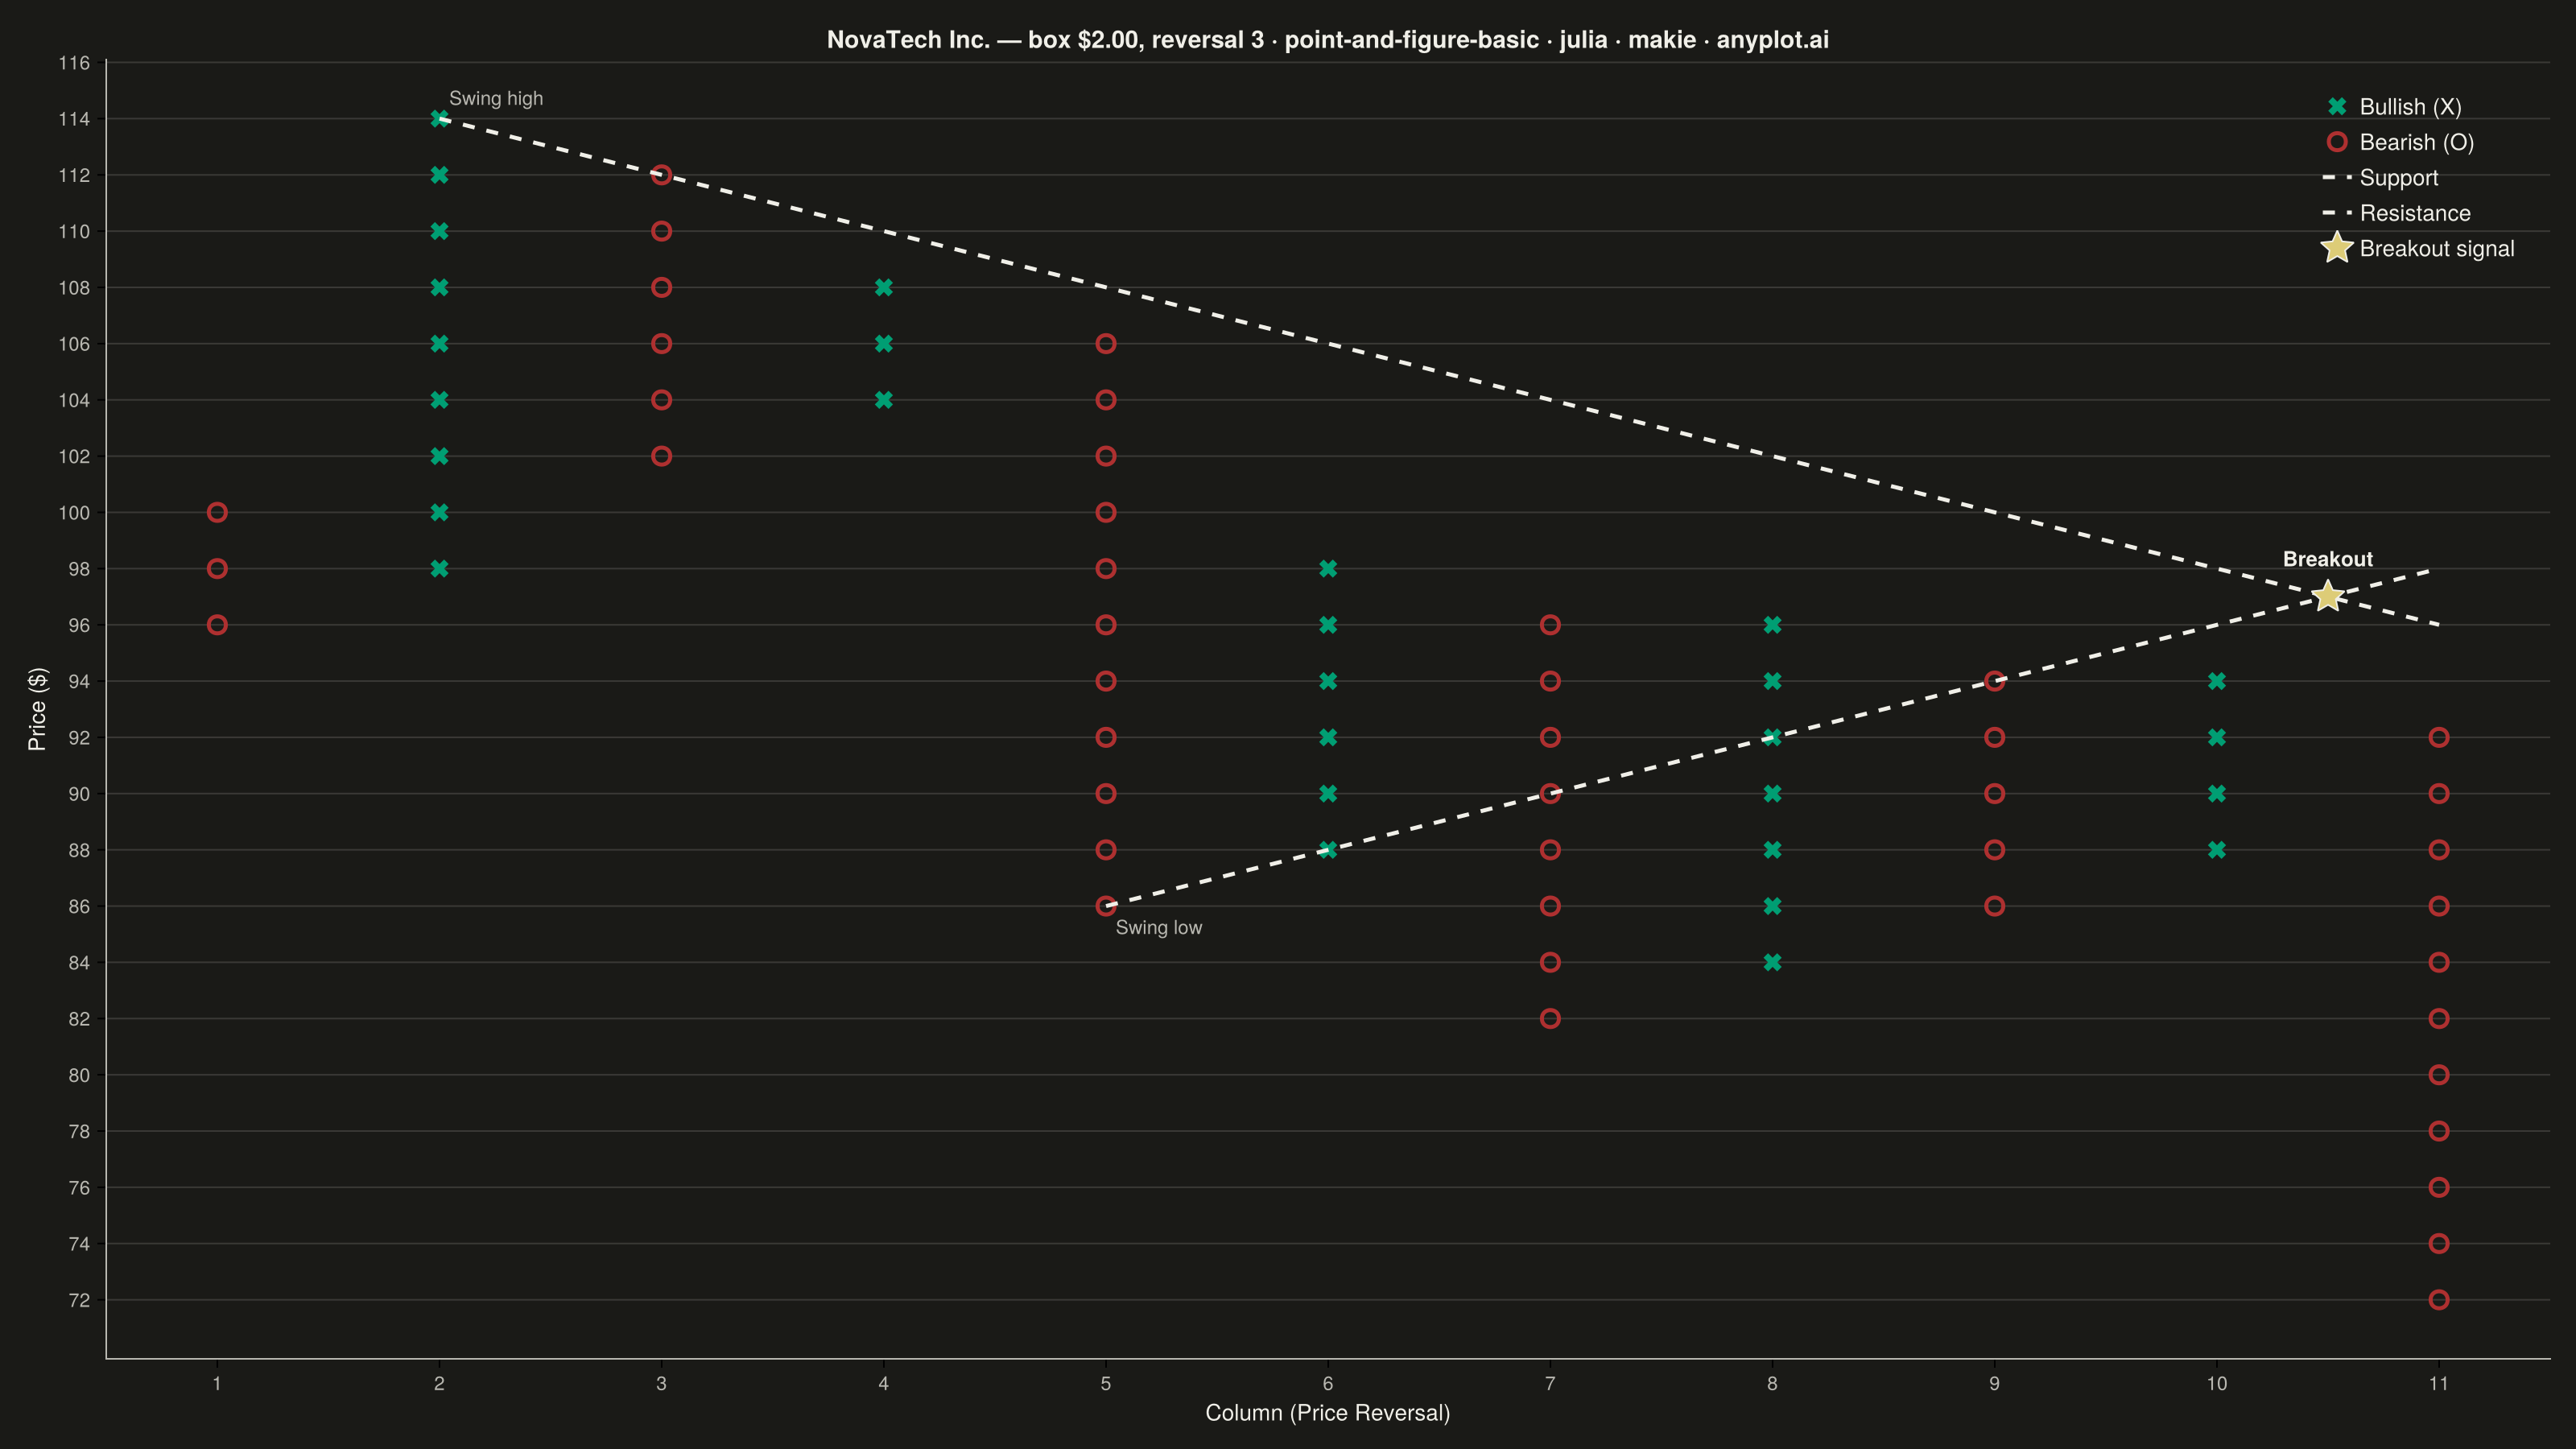
The same plot in 14 other libraries — Python: Altair, Bokeh, lets-plot, Matplotlib, Plotly, plotnine, Pygal, Seaborn; R: ggplot2; JavaScript: Chart.js, D3.js, Apache ECharts, Highcharts, MUI X Charts. Compare all 15 side by side: Point and Figure Chart in Python, R, Julia and JavaScript.
A Point and Figure (P&F) chart is a price-action focused visualization that uses columns of X's (rising prices) and O's (falling prices) to display significant price movements while filtering out time and minor fluctuations. Unlike traditional time-based charts, P&F charts only plot a new symbol when price moves by a defined box size, and only start a new column when price reverses by a specified number of boxes (typically 3). This makes it ideal for identifying clear trends, support/resistance levels, and generating trading signals.
# anyplot.ai
# point-and-figure-basic: Point and Figure Chart
# Library: makie 0.21.9 | Julia 1.11.9
# Quality: 94/100 | Created: 2026-09-02

using CairoMakie
using Colors
using Random

Random.seed!(42)

# --- Theme tokens -----------------------------------------------------------
const THEME    = get(ENV, "ANYPLOT_THEME", "light")
const PAGE_BG  = THEME == "light" ? colorant"#FAF8F1" : colorant"#1A1A17"
const ELEVATED_BG = THEME == "light" ? colorant"#FFFDF6" : colorant"#242420"
const INK      = THEME == "light" ? colorant"#1A1A17" : colorant"#F0EFE8"
const INK_SOFT = THEME == "light" ? colorant"#4A4A44" : colorant"#B8B7B0"
const IMPRINT_PALETTE = [
    colorant"#009E73", colorant"#C475FD", colorant"#4467A3", colorant"#BD8233",
    colorant"#AE3030", colorant"#2ABCCD", colorant"#954477", colorant"#99B314",
]
const BULL_COLOR = IMPRINT_PALETTE[1]  # brand green, doubles as "gain" semantic anchor
const BEAR_COLOR = IMPRINT_PALETTE[5]  # matte red, semantic anchor for "loss"
const SIGNAL_COLOR = colorant"#DDCC77"  # anyplot amber, reserved for caution/callout marks

# --- Data: synthetic daily closing prices with alternating trend regimes ----
n_days = 260
day_idx = 0:(n_days - 1)
rising_regime = mod.(day_idx, 84) .< 42
drift_seq = ifelse.(rising_regime, 0.16, -0.16)
daily_steps = drift_seq .+ randn(n_days) .* 1.3
daily_steps[1] = 0.0
prices = 100.0 .+ cumsum(daily_steps)

# --- Point & Figure construction --------------------------------------------
box_size = 2.0
reversal_boxes = 3

current_box = floor(Int, prices[1] / box_size)
direction = 0  # 0 = undetermined, 1 = X column (rising), -1 = O column (falling)

col_dir = Int[]
col_low = Int[]
col_high = Int[]

for price in prices[2:end]
    box = floor(Int, price / box_size)
    if direction == 0
        if box > current_box
            global direction = 1
            push!(col_dir, 1); push!(col_low, current_box); push!(col_high, box)
            global current_box = box
        elseif box < current_box
            global direction = -1
            push!(col_dir, -1); push!(col_low, box); push!(col_high, current_box)
            global current_box = box
        end
    elseif direction == 1
        if box > current_box
            col_high[end] = box
            global current_box = box
        elseif box <= current_box - reversal_boxes
            global direction = -1
            push!(col_dir, -1); push!(col_low, box); push!(col_high, current_box - 1)
            global current_box = box
        end
    else
        if box < current_box
            col_low[end] = box
            global current_box = box
        elseif box >= current_box + reversal_boxes
            global direction = 1
            push!(col_dir, 1); push!(col_low, current_box + 1); push!(col_high, box)
            global current_box = box
        end
    end
end

n_cols = length(col_dir)

x_up = Float64[]; y_up = Float64[]
x_down = Float64[]; y_down = Float64[]
for col in 1:n_cols
    boxes = col_low[col]:col_high[col]
    if col_dir[col] == 1
        append!(x_up, fill(Float64(col), length(boxes)))
        append!(y_up, boxes .* box_size)
    else
        append!(x_down, fill(Float64(col), length(boxes)))
        append!(y_down, boxes .* box_size)
    end
end

price_min = minimum(prices)
price_max = maximum(prices)

# 45-degree support line: rises one box per column from an early swing low
# (restricted to the first part of the chart so the line has room to run)
trend_window = 1:max(1, n_cols - 5)
low_col = trend_window[argmin(col_low[trend_window])]
support_x = collect(low_col:n_cols)
support_y = [(col_low[low_col] + (col - low_col)) * box_size for col in support_x]
keep_support = support_y .<= price_max + box_size
support_x = support_x[keep_support]
support_y = support_y[keep_support]

# 45-degree resistance line: falls one box per column from an early swing high
high_col = trend_window[argmax(col_high[trend_window])]
resistance_x = collect(high_col:n_cols)
resistance_y = [(col_high[high_col] - (col - high_col)) * box_size for col in resistance_x]
keep_resistance = resistance_y .>= price_min - box_size
resistance_x = resistance_x[keep_resistance]
resistance_y = resistance_y[keep_resistance]

# Breakout point: analytic intersection of the two 45-degree lines
# (support(x) = resistance(x)), used to anchor the crossover annotation
cross_x = (col_high[high_col] + high_col - col_low[low_col] + low_col) / 2
cross_y = (col_low[low_col] + (cross_x - low_col)) * box_size
has_crossover = cross_x >= max(low_col, high_col) && cross_x <= n_cols

# --- Plot ---------------------------------------------------------------
title_text = "NovaTech Inc. — box \$2.00, reversal 3 · point-and-figure-basic · julia · makie · anyplot.ai"
title_ratio = length(title_text) > 67 ? 67 / length(title_text) : 1.0
title_size = max(14, round(Int, 20 * title_ratio))

fig = Figure(
    resolution      = (1600, 900),
    fontsize        = 14,
    backgroundcolor = PAGE_BG,
)

y_min = floor(price_min / box_size) * box_size
y_max = ceil(price_max / box_size) * box_size
xtick_step = max(1, round(Int, n_cols / 10))

ax = Axis(
    fig[1, 1];
    title              = title_text,
    titlesize          = title_size,
    titlecolor         = INK,
    xlabel             = "Column (Price Reversal)",
    ylabel             = "Price (\$)",
    xlabelcolor        = INK,
    ylabelcolor        = INK,
    xlabelsize         = 14,
    ylabelsize         = 14,
    xticklabelcolor    = INK_SOFT,
    yticklabelcolor    = INK_SOFT,
    xticklabelsize     = 12,
    yticklabelsize     = 12,
    backgroundcolor    = PAGE_BG,
    topspinevisible     = false,
    rightspinevisible   = false,
    leftspinecolor      = INK_SOFT,
    bottomspinecolor    = INK_SOFT,
    xgridvisible        = false,
    ygridvisible        = true,
    ygridcolor          = RGBAf(INK.r, INK.g, INK.b, 0.15),
    xticks              = 1:xtick_step:n_cols,
    yticks              = y_min:box_size:y_max,
)

scatter!(ax, x_up, y_up;
    marker = :xcross, markersize = 16, color = BULL_COLOR,
    label = "Bullish (X)")
scatter!(ax, x_down, y_down;
    marker = :circle, markersize = 15, color = :transparent,
    strokecolor = BEAR_COLOR, strokewidth = 2.5,
    label = "Bearish (O)")
lines!(ax, support_x, support_y;
    color = INK, linestyle = :dash, linewidth = 2.5, label = "Support")
lines!(ax, resistance_x, resistance_y;
    color = INK, linestyle = :dash, linewidth = 2.5, label = "Resistance")

# Annotate the swing points that anchor each trend line, so the viewer sees
# *why* the lines start where they do rather than just that they exist.
text!(ax, low_col, col_low[low_col] * box_size;
    text = "Swing low", color = INK_SOFT, fontsize = 12,
    align = (:left, :top), offset = (6, -6))
text!(ax, high_col, col_high[high_col] * box_size;
    text = "Swing high", color = INK_SOFT, fontsize = 12,
    align = (:left, :bottom), offset = (6, 6))

# Call out the support/resistance crossover as the chart's focal breakout
# signal, rather than leaving the viewer to spot it unassisted.
if has_crossover
    scatter!(ax, [cross_x], [cross_y];
        marker = :star5, markersize = 24, color = SIGNAL_COLOR,
        strokecolor = INK, strokewidth = 1, label = "Breakout signal")
    text!(ax, cross_x, cross_y;
        text = "Breakout", color = INK, fontsize = 13, font = :bold,
        align = (:center, :bottom), offset = (0, 16))
end

Legend(fig[1, 1], ax;
    tellwidth = false, tellheight = false,
    halign = :right, valign = :top,
    margin = (12, 12, 12, 12),
    padding = (10, 10, 8, 8),
    patchsize = (18, 18),
    rowgap = 4,
    backgroundcolor = ELEVATED_BG,
    labelcolor = INK,
    framevisible = false)

# --- Save -------------------------------------------------------------------
save("plot-$(THEME).png", fig; px_per_unit = 2)
Runnable source as JSON, for any HTTP client: https://api.anyplot.ai/specs/point-and-figure-basic/makie/code. Any spec id and library id listed in llms-full.txt fit the same URL shape; every URL below is complete and callable.
{
  "spec_id": "point-and-figure-basic",
  "language": "julia",
  "library": "makie",
  "page": "https://anyplot.ai/point-and-figure-basic/julia/makie",
  "hub": "https://anyplot.ai/point-and-figure-basic",
  "code_json": "https://api.anyplot.ai/specs/point-and-figure-basic/makie/code",
  "spec_json": "https://api.anyplot.ai/specs/point-and-figure-basic",
  "render_light_png": "https://storage.googleapis.com/anyplot-images/plots/point-and-figure-basic/julia/makie/plot-light.png",
  "render_dark_png": "https://storage.googleapis.com/anyplot-images/plots/point-and-figure-basic/julia/makie/plot-dark.png",
  "quality_score": 94.0,
  "license": "MIT",
  "guide": "https://anyplot.ai/llms.txt"
}
Part of Point and Figure Chart on anyplot.ai.