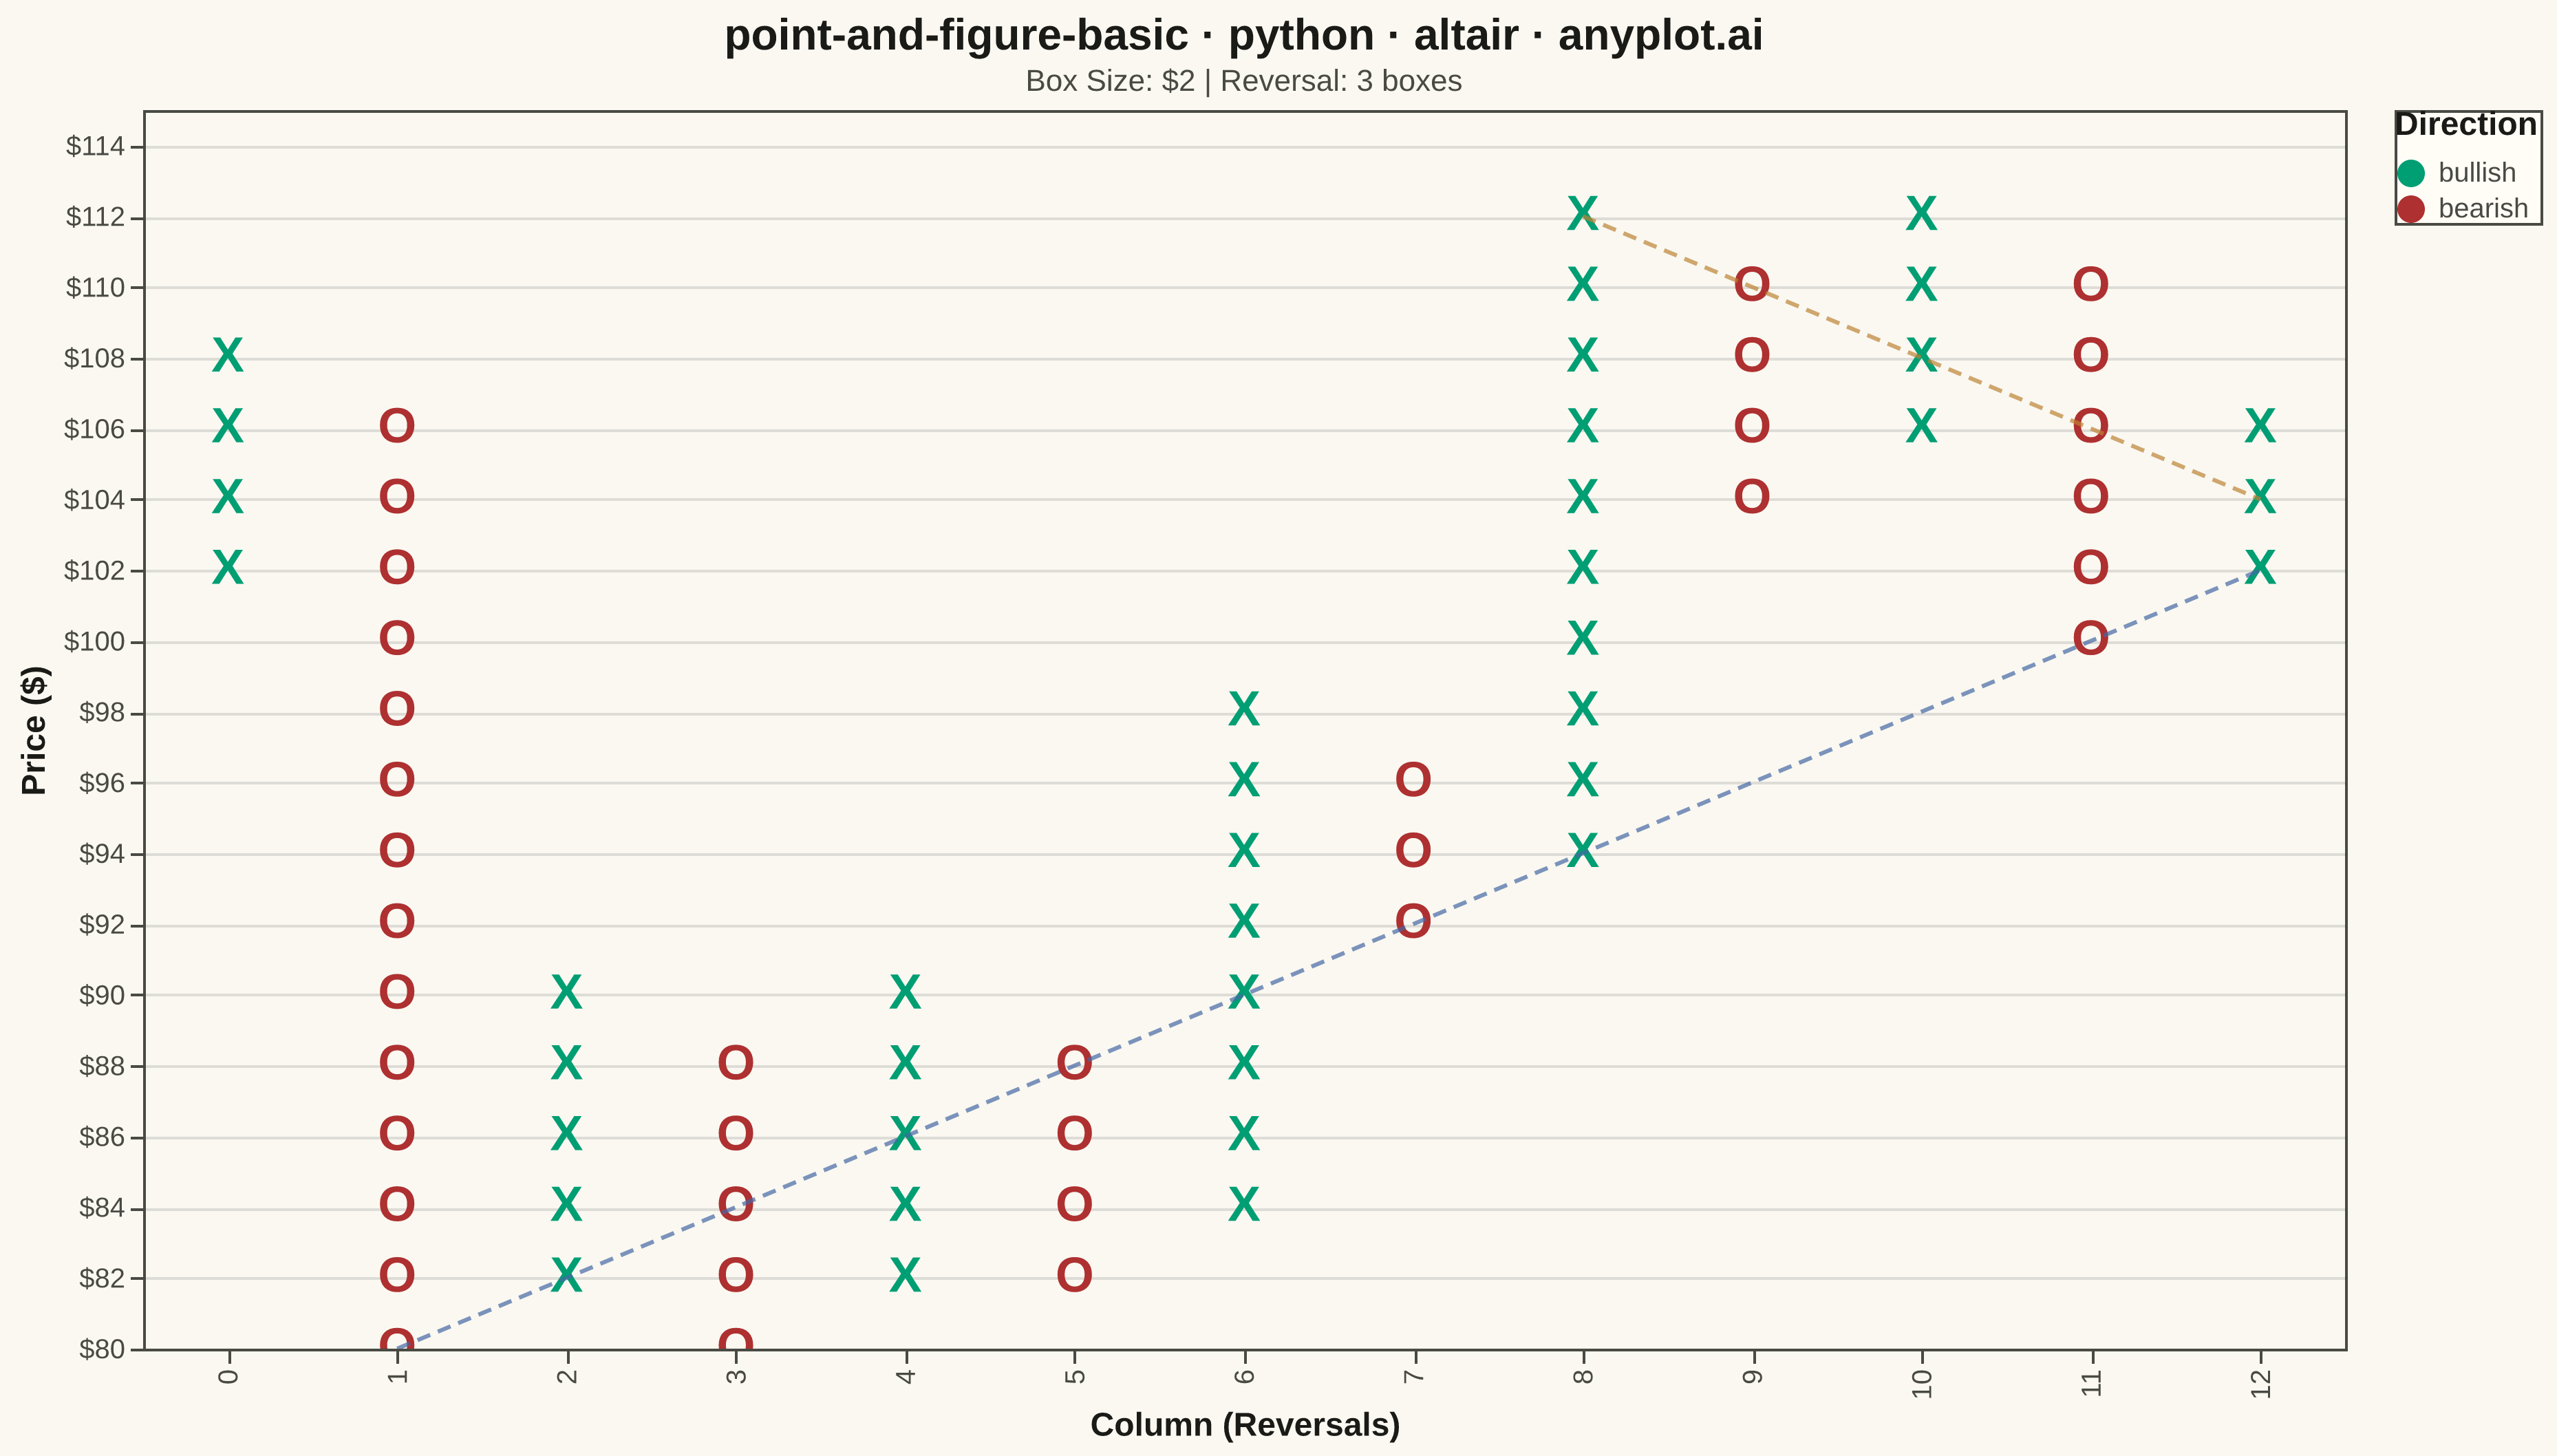
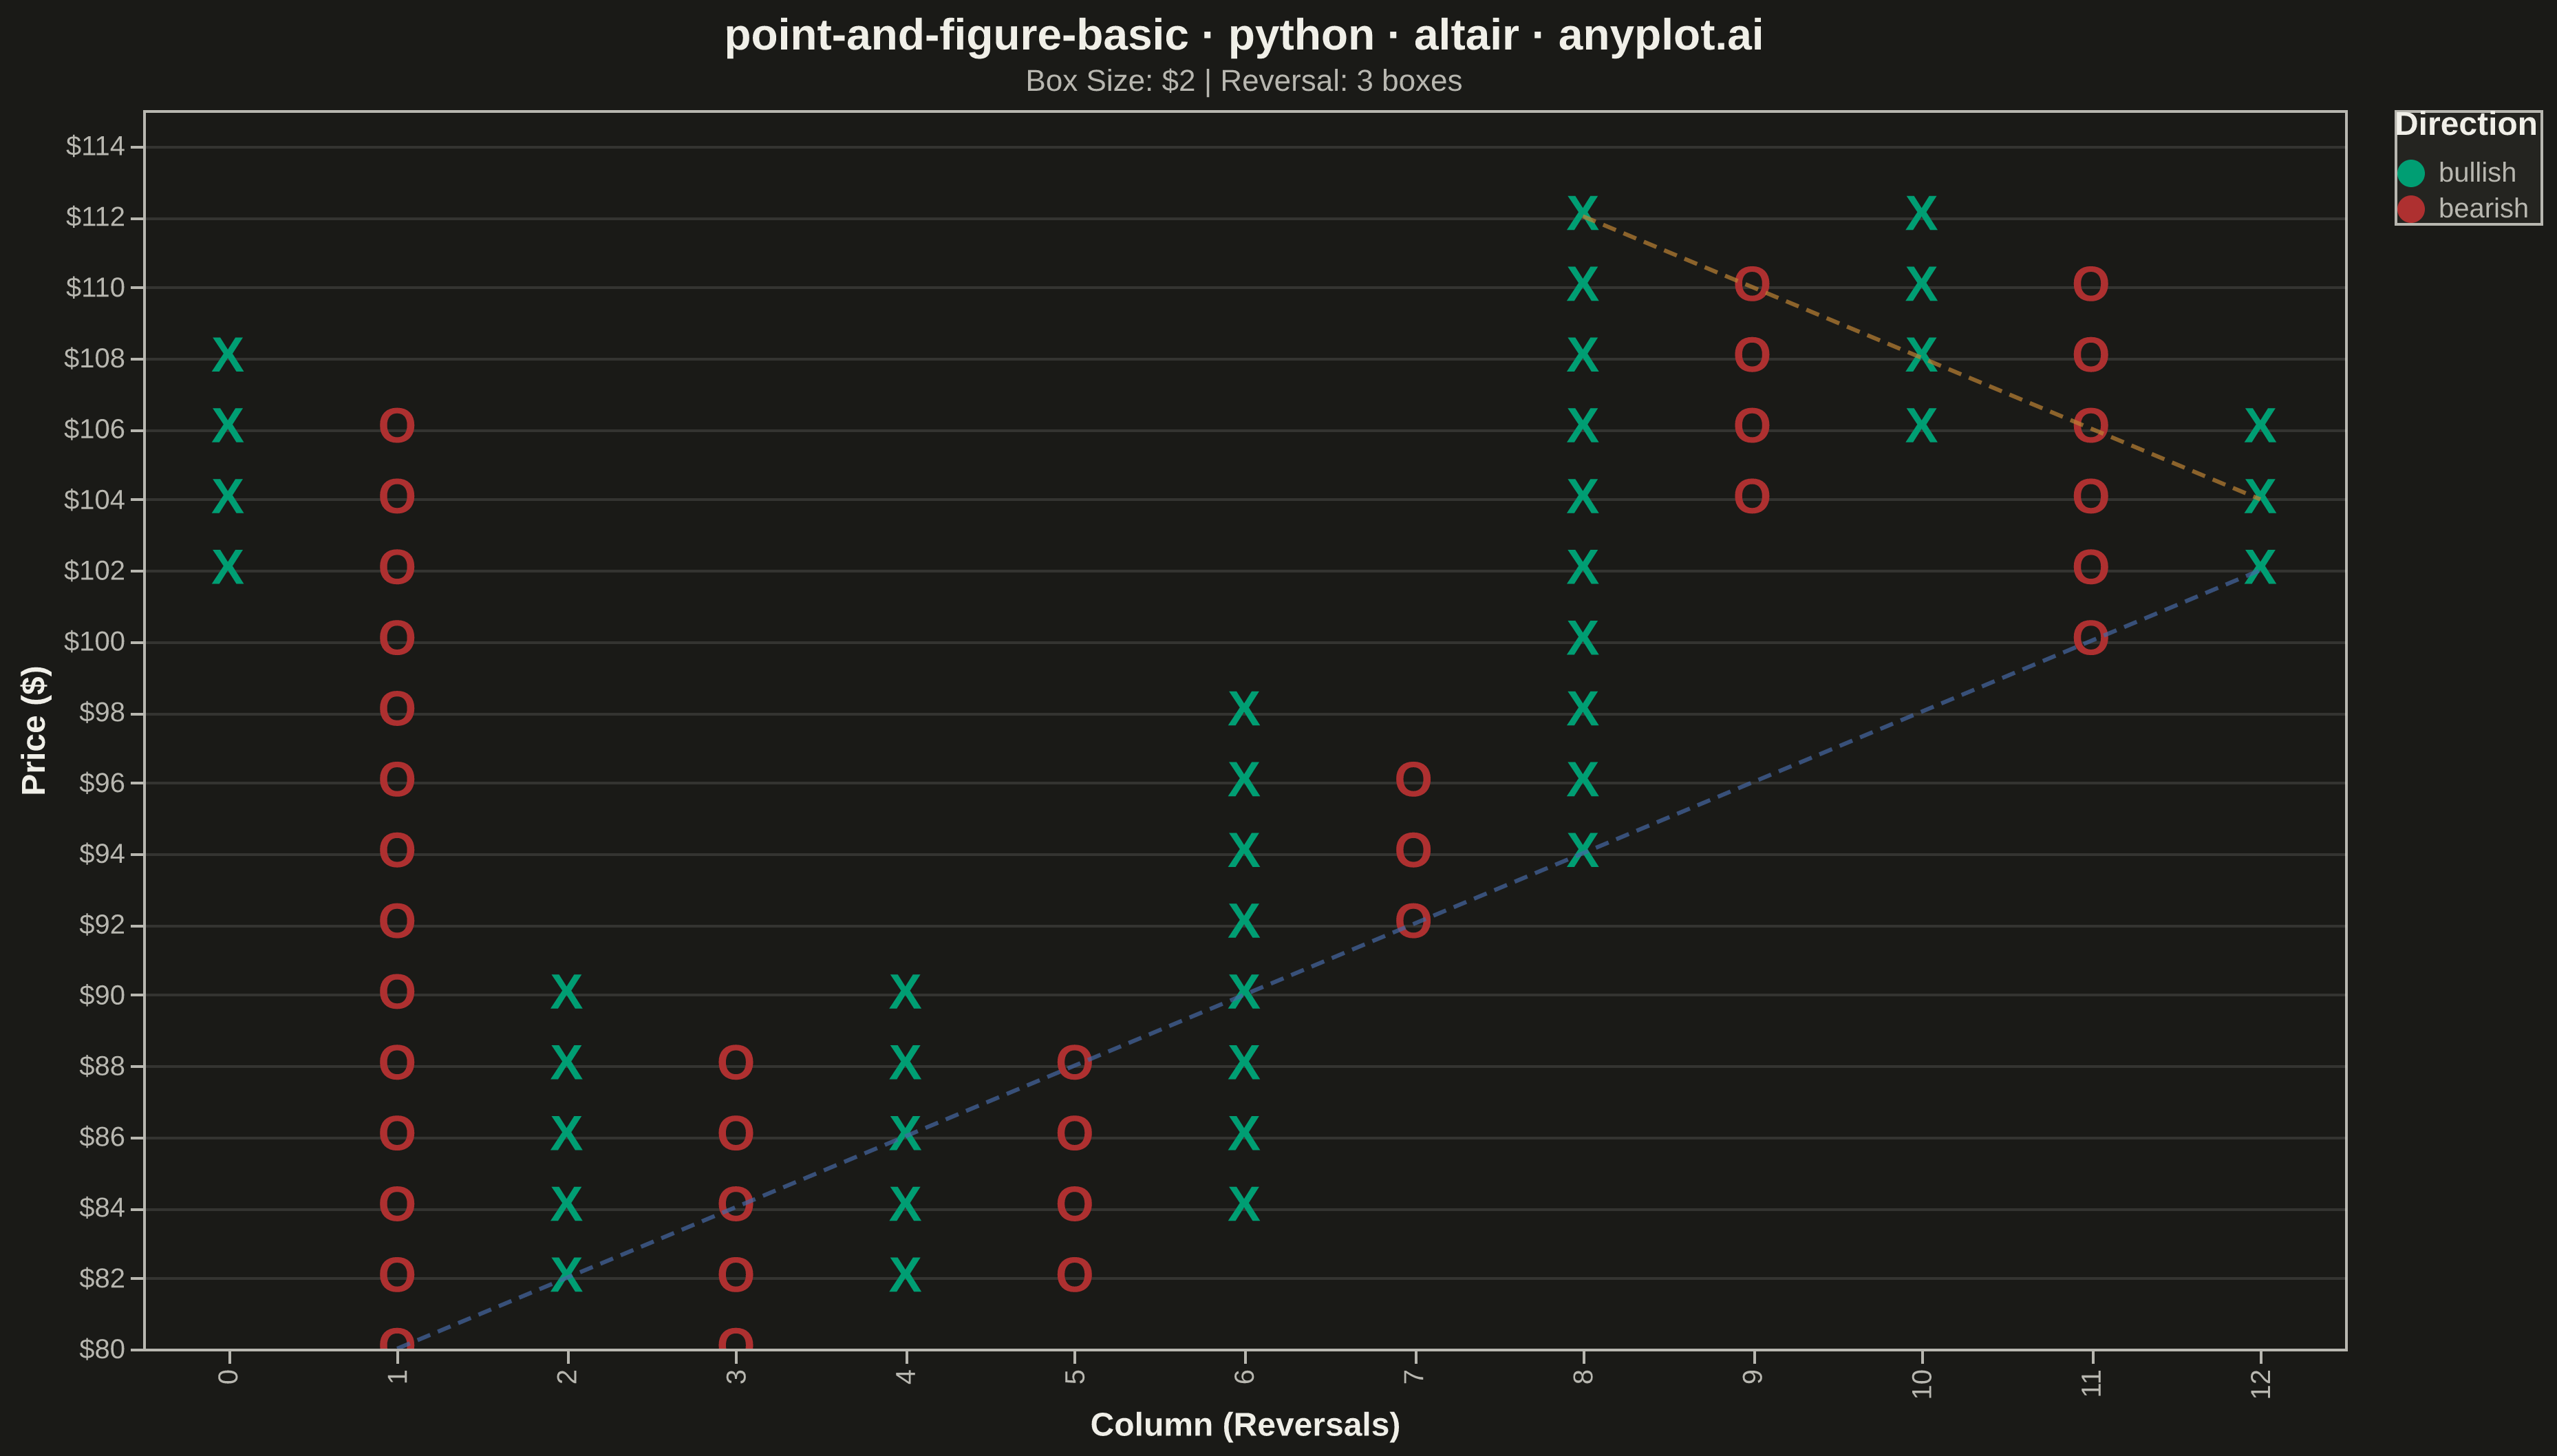
A Point and Figure (P&F) chart is a price-action focused visualization that uses columns of X's (rising prices) and O's (falling prices) to display significant price movements while filtering out time and minor fluctuations. Unlike traditional time-based charts, P&F charts only plot a new symbol when price moves by a defined box size, and only start a new column when price reverses by a specified number of boxes (typically 3). This makes it ideal for identifying clear trends, support/resistance levels, and generating trading signals.
""" anyplot.ai
point-and-figure-basic: Point and Figure Chart
Library: altair 6.1.0 | Python 3.13.13
Quality: 90/100 | Updated: 2026-05-20
"""

import os
import sys


# Prevent the script's own directory from shadowing the 'altair' package
sys.path = [p for p in sys.path if not p.endswith("/python")]

import altair as alt
import numpy as np
import pandas as pd


# Theme tokens
THEME = os.getenv("ANYPLOT_THEME", "light")
PAGE_BG = "#FAF8F1" if THEME == "light" else "#1A1A17"
ELEVATED_BG = "#FFFDF6" if THEME == "light" else "#242420"
INK = "#1A1A17" if THEME == "light" else "#F0EFE8"
INK_SOFT = "#4A4A44" if THEME == "light" else "#B8B7B0"
BULL_COLOR = "#009E73"  # Okabe-Ito position 1 — X columns (bullish)
BEAR_COLOR = "#AE3030"  # imprint red — O columns (bearish)

# Data
np.random.seed(42)
n_days = 300
dates = pd.date_range("2024-01-01", periods=n_days, freq="D")
returns = np.random.normal(0.0005, 0.02, n_days)
close = 100 * np.cumprod(1 + returns)

# Point and Figure parameters
box_size = 2.0  # $2 per box
reversal = 3  # 3-box reversal

# Build P&F columns
pf_data = []
col = 0
direction = None
current_price = close[0]
col_start = round(current_price / box_size) * box_size

for i in range(1, len(close)):
    price = close[i]

    if direction is None:
        if price >= col_start + box_size:
            direction = "X"
            boxes_up = int((price - col_start) / box_size)
            for b in range(boxes_up + 1):
                pf_data.append({"column": col, "price": col_start + b * box_size, "symbol": "X", "dir": "bullish"})
            current_price = col_start + boxes_up * box_size
        elif price <= col_start - box_size:
            direction = "O"
            boxes_down = int((col_start - price) / box_size)
            for b in range(boxes_down + 1):
                pf_data.append({"column": col, "price": col_start - b * box_size, "symbol": "O", "dir": "bearish"})
            current_price = col_start - boxes_down * box_size
    elif direction == "X":
        if price >= current_price + box_size:
            boxes_up = int((price - current_price) / box_size)
            for b in range(1, boxes_up + 1):
                pf_data.append({"column": col, "price": current_price + b * box_size, "symbol": "X", "dir": "bullish"})
            current_price += boxes_up * box_size
        elif price <= current_price - reversal * box_size:
            col += 1
            boxes_down = int((current_price - price) / box_size)
            new_start = current_price - box_size
            for b in range(boxes_down):
                pf_data.append({"column": col, "price": new_start - b * box_size, "symbol": "O", "dir": "bearish"})
            current_price = new_start - (boxes_down - 1) * box_size
            direction = "O"
    else:
        if price <= current_price - box_size:
            boxes_down = int((current_price - price) / box_size)
            for b in range(1, boxes_down + 1):
                pf_data.append({"column": col, "price": current_price - b * box_size, "symbol": "O", "dir": "bearish"})
            current_price -= boxes_down * box_size
        elif price >= current_price + reversal * box_size:
            col += 1
            boxes_up = int((price - current_price) / box_size)
            new_start = current_price + box_size
            for b in range(boxes_up):
                pf_data.append({"column": col, "price": new_start + b * box_size, "symbol": "X", "dir": "bullish"})
            current_price = new_start + (boxes_up - 1) * box_size
            direction = "X"

pf_df = pd.DataFrame(pf_data)
max_col = int(pf_df["column"].max())

# 45-degree support line: ascends from lowest O price
o_df = pf_df[pf_df["symbol"] == "O"]
sup_col = int(o_df.loc[o_df["price"].idxmin(), "column"])
sup_price = float(o_df["price"].min())
support_df = pd.DataFrame(
    {
        "column": list(range(sup_col, max_col + 1)),
        "price": [sup_price + (c - sup_col) * box_size for c in range(sup_col, max_col + 1)],
    }
)

# 45-degree resistance line: descends from highest X price
x_df = pf_df[pf_df["symbol"] == "X"]
res_col = int(x_df.loc[x_df["price"].idxmax(), "column"])
res_price = float(x_df["price"].max())
resist_df = pd.DataFrame(
    {
        "column": list(range(res_col, max_col + 1)),
        "price": [res_price - (c - res_col) * box_size for c in range(res_col, max_col + 1)],
    }
)

# Plot
TITLE = "point-and-figure-basic · python · altair · anyplot.ai"
SUBTITLE = f"Box Size: ${box_size:.0f} | Reversal: {reversal} boxes"

pf_marks = (
    alt.Chart(pf_df)
    .mark_text(fontSize=18, fontWeight="bold")
    .encode(
        x=alt.X("column:O", title="Column (Reversals)", axis=alt.Axis(labelFontSize=10, titleFontSize=12)),
        y=alt.Y(
            "price:Q",
            title="Price ($)",
            scale=alt.Scale(zero=False),
            axis=alt.Axis(labelFontSize=10, titleFontSize=12, format="$.0f"),
        ),
        text="symbol:N",
        color=alt.Color(
            "dir:N",
            scale=alt.Scale(domain=["bullish", "bearish"], range=[BULL_COLOR, BEAR_COLOR]),
            legend=alt.Legend(title="Direction"),
        ),
        tooltip=[
            alt.Tooltip("column:O", title="Column"),
            alt.Tooltip("price:Q", title="Price", format="$.2f"),
            alt.Tooltip("symbol:N", title="Symbol"),
        ],
    )
)

support_layer = (
    alt.Chart(support_df)
    .mark_line(strokeDash=[5, 3], strokeWidth=1.5, color="#4467A3", opacity=0.7)
    .encode(x="column:O", y="price:Q")
)

resist_layer = (
    alt.Chart(resist_df)
    .mark_line(strokeDash=[5, 3], strokeWidth=1.5, color="#BD8233", opacity=0.7)
    .encode(x="column:O", y="price:Q")
)

chart = (
    alt.layer(pf_marks, support_layer, resist_layer)
    .properties(
        width=800,
        height=450,
        background=PAGE_BG,
        title=alt.Title(TITLE, fontSize=16, subtitle=SUBTITLE, subtitleFontSize=11),
    )
    .interactive()
    .configure_view(fill=PAGE_BG, stroke=INK_SOFT)
    .configure_axis(
        domainColor=INK_SOFT, tickColor=INK_SOFT, gridColor=INK, gridOpacity=0.12, labelColor=INK_SOFT, titleColor=INK
    )
    .configure_title(color=INK, subtitleColor=INK_SOFT)
    .configure_legend(
        labelFontSize=10,
        titleFontSize=12,
        fillColor=ELEVATED_BG,
        strokeColor=INK_SOFT,
        labelColor=INK_SOFT,
        titleColor=INK,
    )
)

# Save
chart.save(f"plot-{THEME}.png", scale_factor=4.0)
chart.save(f"plot-{THEME}.html")
Runnable source as JSON, for any HTTP client: https://api.anyplot.ai/specs/point-and-figure-basic/altair/code. Any spec id and library id listed in llms-full.txt fit the same URL shape; every URL below is complete and callable.
{
  "spec_id": "point-and-figure-basic",
  "language": "python",
  "library": "altair",
  "page": "https://anyplot.ai/point-and-figure-basic/python/altair",
  "hub": "https://anyplot.ai/point-and-figure-basic",
  "code_json": "https://api.anyplot.ai/specs/point-and-figure-basic/altair/code",
  "spec_json": "https://api.anyplot.ai/specs/point-and-figure-basic",
  "render_light_png": "https://storage.googleapis.com/anyplot-images/plots/point-and-figure-basic/python/altair/plot-light.png",
  "render_dark_png": "https://storage.googleapis.com/anyplot-images/plots/point-and-figure-basic/python/altair/plot-dark.png",
  "interactive_light_html": "https://storage.googleapis.com/anyplot-images/plots/point-and-figure-basic/python/altair/plot-light.html",
  "interactive_dark_html": "https://storage.googleapis.com/anyplot-images/plots/point-and-figure-basic/python/altair/plot-dark.html",
  "quality_score": 90.0,
  "license": "MIT",
  "guide": "https://anyplot.ai/llms.txt"
}
Part of Point and Figure Chart on anyplot.ai.