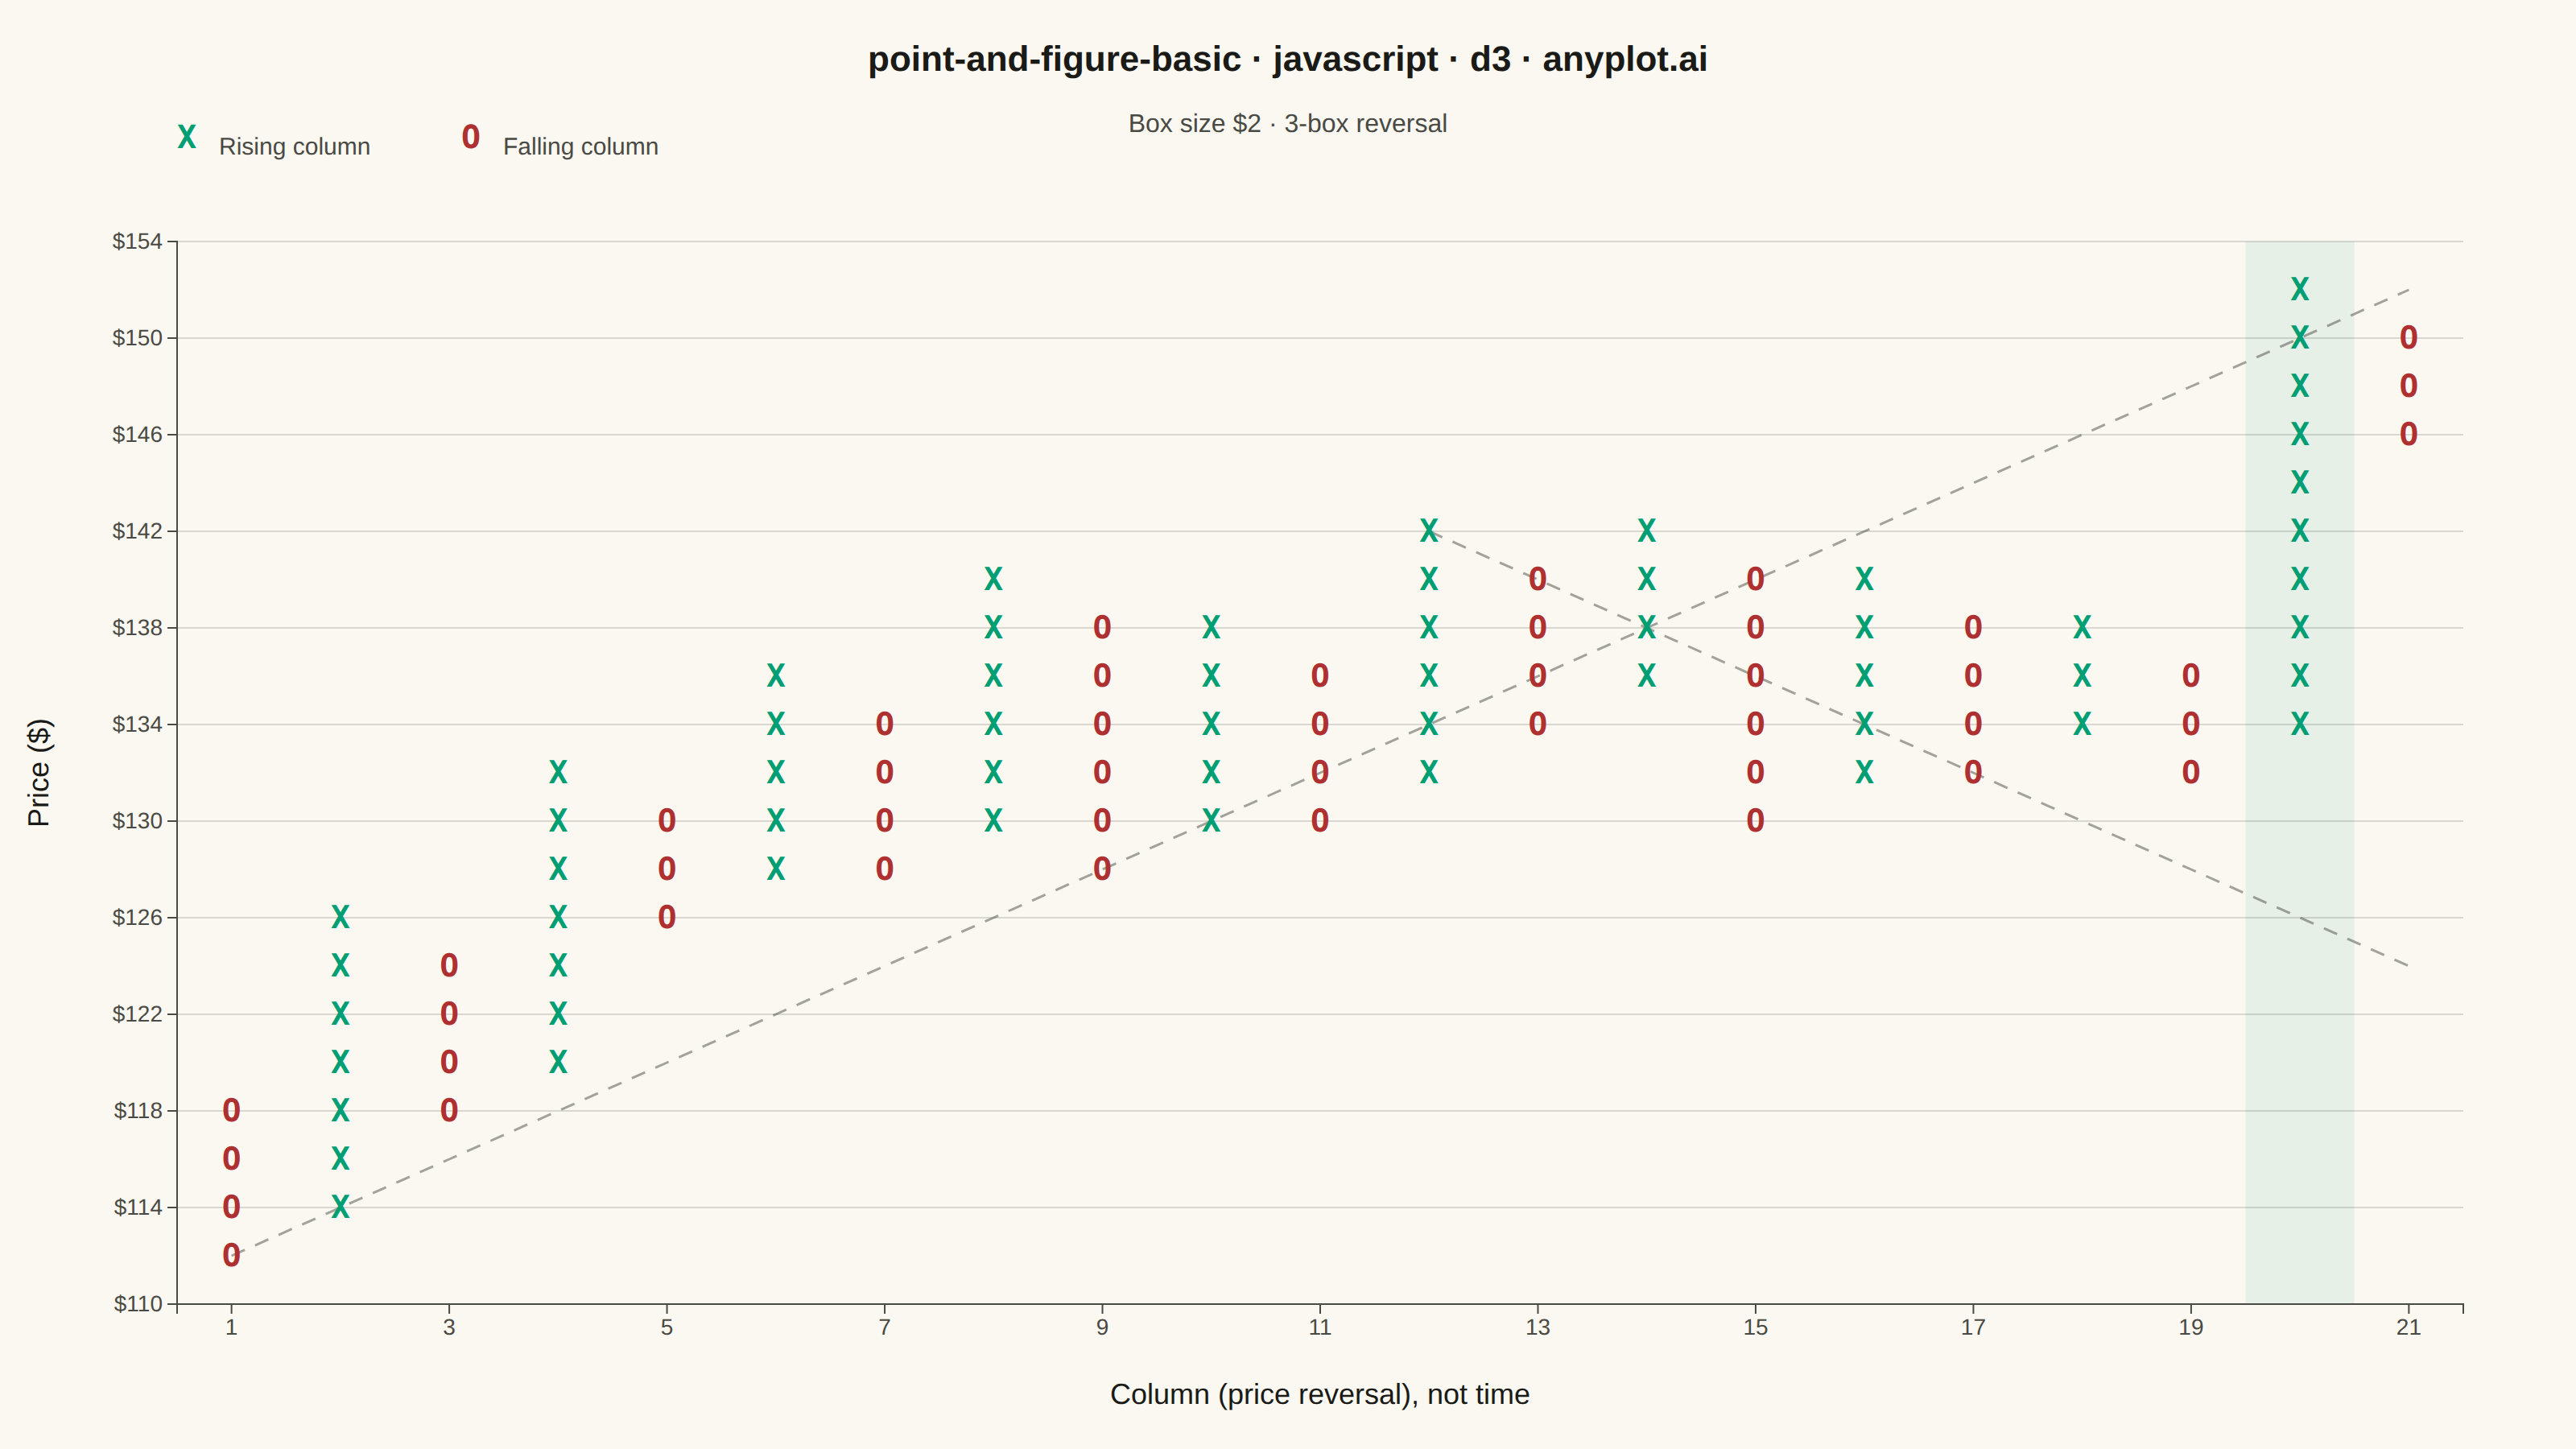
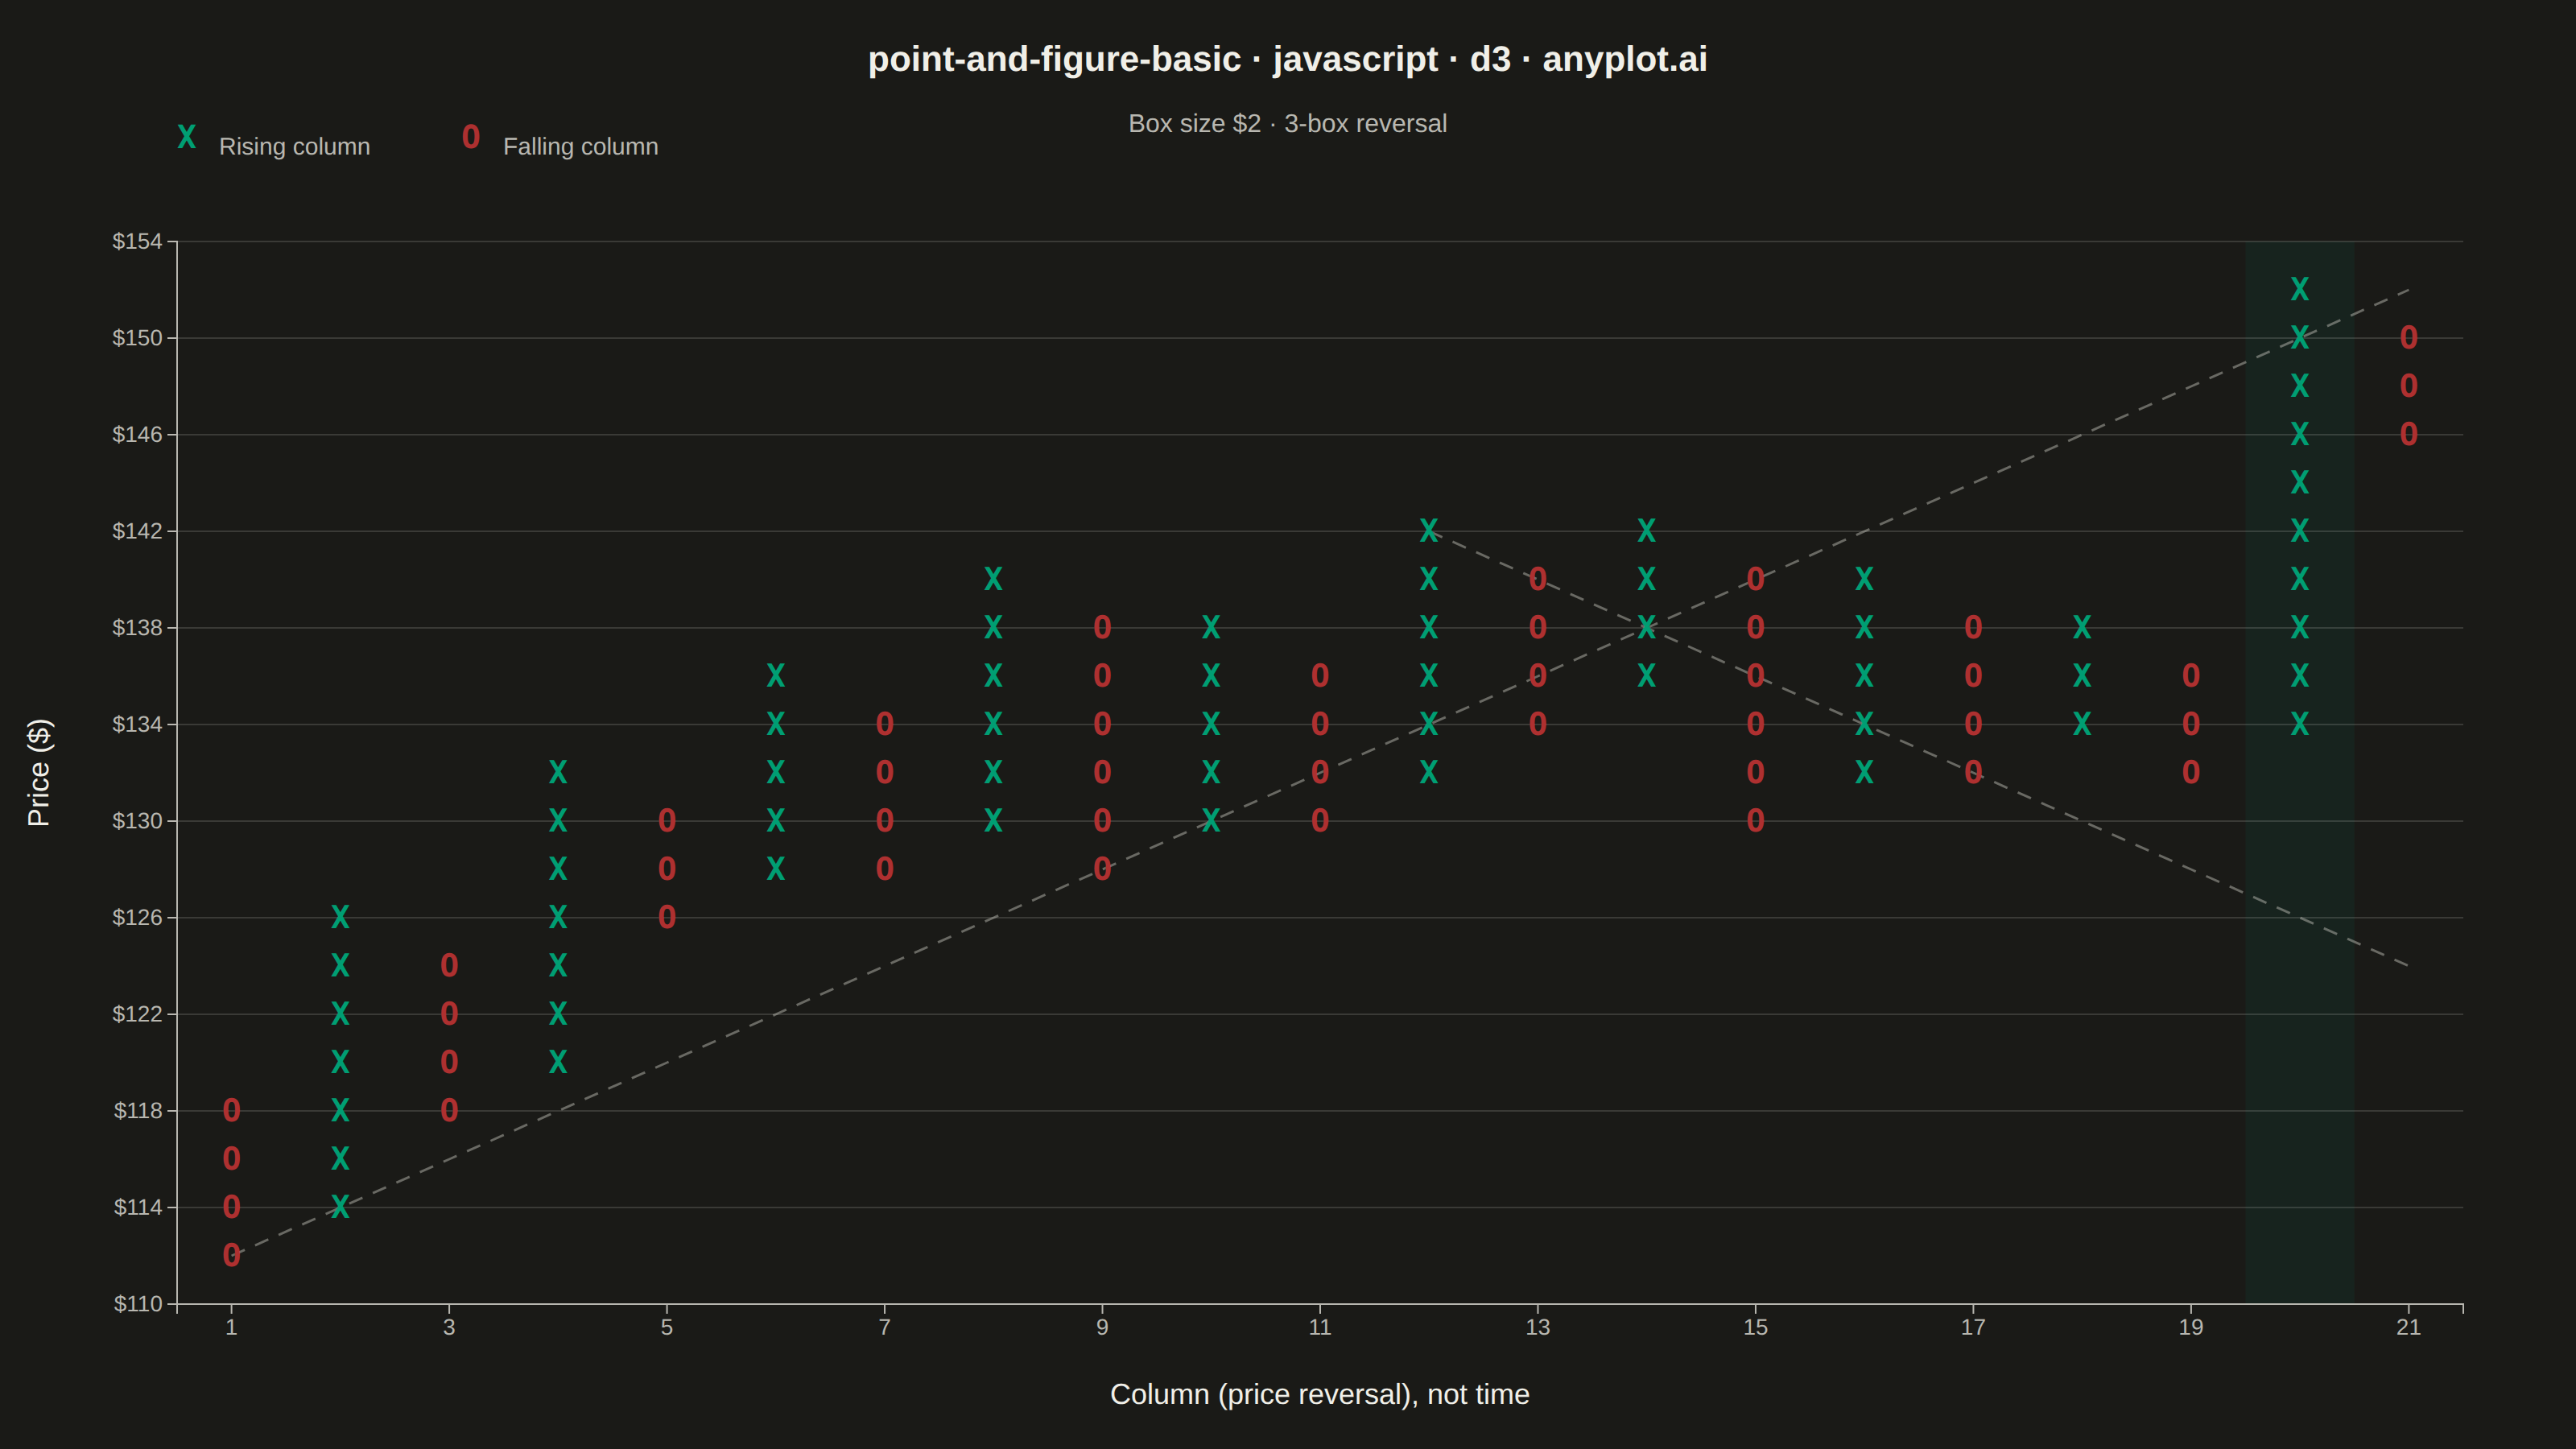
The same plot in 14 other libraries — JavaScript: Chart.js, Apache ECharts, Highcharts, MUI X Charts; Python: Altair, Bokeh, lets-plot, Matplotlib, Plotly, plotnine, Pygal, Seaborn; R: ggplot2; Julia: Makie.jl. Compare all 15 side by side: Point and Figure Chart in Python, R, Julia and JavaScript.
A Point and Figure (P&F) chart is a price-action focused visualization that uses columns of X's (rising prices) and O's (falling prices) to display significant price movements while filtering out time and minor fluctuations. Unlike traditional time-based charts, P&F charts only plot a new symbol when price moves by a defined box size, and only start a new column when price reverses by a specified number of boxes (typically 3). This makes it ideal for identifying clear trends, support/resistance levels, and generating trading signals.
// anyplot.ai
// point-and-figure-basic: Point and Figure Chart
// Library: d3 7.9.0 | JavaScript 22.23.2
// Quality: 92/100 | Created: 2026-09-02

const t = window.ANYPLOT_TOKENS;
const { width, height } = window.ANYPLOT_SIZE;

// --- Data: synthetic daily closes, converted into Point & Figure columns ---
function lcg(seed) {
  let s = seed >>> 0;
  return () => {
    s = (s * 1664525 + 1013904223) >>> 0;
    return s / 4294967296;
  };
}

const rand = lcg(42);
const boxSize = 2; // $ per box
const reversal = 3; // boxes required to start a new column

let price = 120;
let momentum = 0;
const closes = [];
for (let i = 0; i < 300; i++) {
  momentum = (momentum + (rand() - 0.5) * 0.4) * 0.85;
  price = Math.max(20, price + momentum + (rand() - 0.5) * 5);
  closes.push(price);
}

const boxIndex = (p) => Math.round(p / boxSize);
const boxed = closes.map(boxIndex);

// Whole-box reversal method: extend the current column while price keeps
// moving in its direction, start a new column only once price reverses by
// `reversal` boxes.
const columns = [];
let current = boxed[0];
let column = null;
for (let i = 1; i < boxed.length; i++) {
  const idx = boxed[i];
  if (column === null) {
    if (idx === current) continue;
    column = idx > current ? { type: "X", low: current, high: idx } : { type: "O", low: idx, high: current };
    current = idx;
    continue;
  }
  if (column.type === "X") {
    if (idx > column.high) {
      column.high = idx;
      current = idx;
    } else if (idx <= column.high - reversal) {
      columns.push(column);
      column = { type: "O", low: idx, high: column.high - 1 };
      current = idx;
    }
  } else {
    if (idx < column.low) {
      column.low = idx;
      current = idx;
    } else if (idx >= column.low + reversal) {
      columns.push(column);
      column = { type: "X", low: column.low + 1, high: idx };
      current = idx;
    }
  }
}
if (column) columns.push(column);

// Classic 45-degree trend lines: a bullish support line rising from the
// chart's lowest box, and a bearish resistance line falling from an early
// swing high (last 30% of columns excluded so the line has room to run).
const minLow = d3.min(columns, (c) => c.low);
const supportStart = columns.findIndex((c) => c.low === minLow);

const earlyCutoff = Math.floor(columns.length * 0.7);
const earlyHigh = d3.max(columns.slice(0, earlyCutoff), (c) => c.high);
const resistanceStart = columns.findIndex((c) => c.high === earlyHigh);

function trendLine(startIdx, startBox, slope) {
  const points = [];
  for (let i = startIdx; i < columns.length; i++) {
    points.push([i, startBox + slope * (i - startIdx)]);
  }
  return points;
}

// --- Layout ------------------------------------------------------------
const margin = { top: 150, right: 70, bottom: 90, left: 110 };
const iw = width - margin.left - margin.right;
const ih = height - margin.top - margin.bottom;

const minBox = d3.min(columns, (c) => c.low) - 1;
const maxBox = d3.max(columns, (c) => c.high) + 1;

const x = d3.scaleBand().domain(d3.range(columns.length)).range([0, iw]).paddingInner(0.08).paddingOuter(0.04);
const y = d3.scaleLinear().domain([minBox, maxBox]).range([ih, 0]);
const cellH = Math.abs(y(minBox) - y(minBox + 1));

const svg = d3.select("#container").append("svg").attr("width", width).attr("height", height);
const g = svg.append("g").attr("transform", `translate(${margin.left},${margin.top})`);

// --- Breakout highlight: a soft band behind the single largest column ----
// (the biggest box-count swing), giving the chart one clear focal point
// instead of every column reading with equal weight.
const columnSizes = columns.map((c) => c.high - c.low + 1);
const breakoutIdx = columnSizes.indexOf(d3.max(columnSizes));
const breakoutColumn = columns[breakoutIdx];

g.append("rect")
  .attr("x", x(breakoutIdx) - (x.step() - x.bandwidth()) / 2)
  .attr("y", 0)
  .attr("width", x.step())
  .attr("height", ih)
  .attr("fill", breakoutColumn.type === "X" ? t.palette[0] : t.palette[4])
  .attr("opacity", 0.08);

// --- Gridlines at box-size price intervals (every other box, kept light
// so the box-structure glyphs stay the primary read) -----------------------
const boxTicks = d3.range(minBox, maxBox + 1);
const gridTicks = boxTicks.filter((_, i) => i % 2 === 0);
g.append("g")
  .selectAll("line")
  .data(gridTicks)
  .join("line")
  .attr("x1", 0)
  .attr("x2", iw)
  .attr("y1", (b) => y(b))
  .attr("y2", (b) => y(b))
  .attr("stroke", t.grid)
  .attr("stroke-width", 1);

// --- Y axis: price scale -------------------------------------------------
const yAxis = g.append("g").call(
  d3
    .axisLeft(y)
    .tickValues(boxTicks.filter((_, i) => i % 2 === 0))
    .tickFormat((b) => `$${b * boxSize}`)
);
yAxis.selectAll("text").attr("fill", t.inkSoft).style("font-size", "14px");
yAxis.selectAll("line").attr("stroke", t.inkSoft);
yAxis.select(".domain").attr("stroke", t.inkSoft);

// --- X axis: column index (reversals), not time ---------------------------
const xAxis = g
  .append("g")
  .attr("transform", `translate(0,${ih})`)
  .call(
    d3
      .axisBottom(x)
      .tickValues(d3.range(columns.length).filter((i) => i % 2 === 0))
      .tickFormat((i) => i + 1)
  );
xAxis.selectAll("text").attr("fill", t.inkSoft).style("font-size", "14px");
xAxis.selectAll("line").attr("stroke", t.inkSoft);
xAxis.select(".domain").attr("stroke", t.inkSoft);

// --- Support / resistance trend lines ------------------------------------
const lineGen = d3
  .line()
  .x((d) => x(d[0]) + x.bandwidth() / 2)
  .y((d) => y(d[1]));

g.append("path")
  .datum(trendLine(supportStart, minLow, 1))
  .attr("fill", "none")
  .attr("stroke", t.inkSoft)
  .attr("stroke-width", 1.5)
  .attr("stroke-dasharray", "9,7")
  .attr("opacity", 0.5)
  .attr("d", lineGen);

g.append("path")
  .datum(trendLine(resistanceStart, earlyHigh, -1))
  .attr("fill", "none")
  .attr("stroke", t.inkSoft)
  .attr("stroke-width", 1.5)
  .attr("stroke-dasharray", "9,7")
  .attr("opacity", 0.5)
  .attr("d", lineGen);

// --- Columns of X's (rising) and O's (falling) ---------------------------
const bullish = t.palette[0]; // #009E73 — brand green, always first series
const bearish = t.palette[4]; // matte red — semantic anchor for loss / decline

const cells = columns.flatMap((c, i) => d3.range(c.low, c.high + 1).map((level) => ({ col: i, level, type: c.type })));
const symbolSize = Math.min(x.bandwidth(), cellH) * 0.66;

g.selectAll("text.box")
  .data(cells)
  .join("text")
  .attr("class", "box")
  .attr("x", (d) => x(d.col) + x.bandwidth() / 2)
  .attr("y", (d) => y(d.level))
  .attr("text-anchor", "middle")
  .attr("dominant-baseline", "central")
  .style("font-size", `${symbolSize}px`)
  .style("font-weight", 700)
  .style("font-family", "monospace")
  .attr("fill", (d) => (d.type === "X" ? bullish : bearish))
  .text((d) => d.type);

// --- Axis labels -----------------------------------------------------------
g.append("text")
  .attr("x", iw / 2)
  .attr("y", ih + 62)
  .attr("text-anchor", "middle")
  .attr("fill", t.ink)
  .style("font-size", "18px")
  .text("Column (price reversal), not time");

g.append("text")
  .attr("transform", "rotate(-90)")
  .attr("x", -ih / 2)
  .attr("y", -80)
  .attr("text-anchor", "middle")
  .attr("fill", t.ink)
  .style("font-size", "18px")
  .text("Price ($)");

// --- Legend: X / O meaning --------------------------------------------------
const legend = svg.append("g").attr("transform", `translate(${margin.left},92)`);
const legendItems = [
  { symbol: "X", label: "Rising column", color: bullish },
  { symbol: "O", label: "Falling column", color: bearish },
];
let legendX = 0;
for (const item of legendItems) {
  const entry = legend.append("g").attr("transform", `translate(${legendX},0)`);
  entry
    .append("text")
    .attr("fill", item.color)
    .style("font-size", "20px")
    .style("font-weight", 700)
    .style("font-family", "monospace")
    .text(item.symbol);
  entry
    .append("text")
    .attr("x", 26)
    .attr("y", 0)
    .attr("dominant-baseline", "middle")
    .attr("fill", t.inkSoft)
    .style("font-size", "15px")
    .text(item.label);
  legendX += 26 + item.label.length * 8.5 + 40;
}

// --- Subtitle: box size + reversal setting ---------------------------------
svg
  .append("text")
  .attr("x", width / 2)
  .attr("y", 82)
  .attr("text-anchor", "middle")
  .attr("fill", t.inkSoft)
  .style("font-size", "16px")
  .text(`Box size $${boxSize} · ${reversal}-box reversal`);

// --- Title -------------------------------------------------------------
svg
  .append("text")
  .attr("x", width / 2)
  .attr("y", 44)
  .attr("text-anchor", "middle")
  .attr("fill", t.ink)
  .style("font-size", "22px")
  .style("font-weight", 600)
  .text("point-and-figure-basic · javascript · d3 · anyplot.ai");
Runnable source as JSON, for any HTTP client: https://api.anyplot.ai/specs/point-and-figure-basic/d3/code. Any spec id and library id listed in llms-full.txt fit the same URL shape; every URL below is complete and callable.
{
  "spec_id": "point-and-figure-basic",
  "language": "javascript",
  "library": "d3",
  "page": "https://anyplot.ai/point-and-figure-basic/javascript/d3",
  "hub": "https://anyplot.ai/point-and-figure-basic",
  "code_json": "https://api.anyplot.ai/specs/point-and-figure-basic/d3/code",
  "spec_json": "https://api.anyplot.ai/specs/point-and-figure-basic",
  "render_light_png": "https://storage.googleapis.com/anyplot-images/plots/point-and-figure-basic/javascript/d3/plot-light.png",
  "render_dark_png": "https://storage.googleapis.com/anyplot-images/plots/point-and-figure-basic/javascript/d3/plot-dark.png",
  "interactive_light_html": "https://storage.googleapis.com/anyplot-images/plots/point-and-figure-basic/javascript/d3/plot-light.html",
  "interactive_dark_html": "https://storage.googleapis.com/anyplot-images/plots/point-and-figure-basic/javascript/d3/plot-dark.html",
  "quality_score": 92.0,
  "license": "MIT",
  "guide": "https://anyplot.ai/llms.txt"
}
Part of Point and Figure Chart on anyplot.ai.