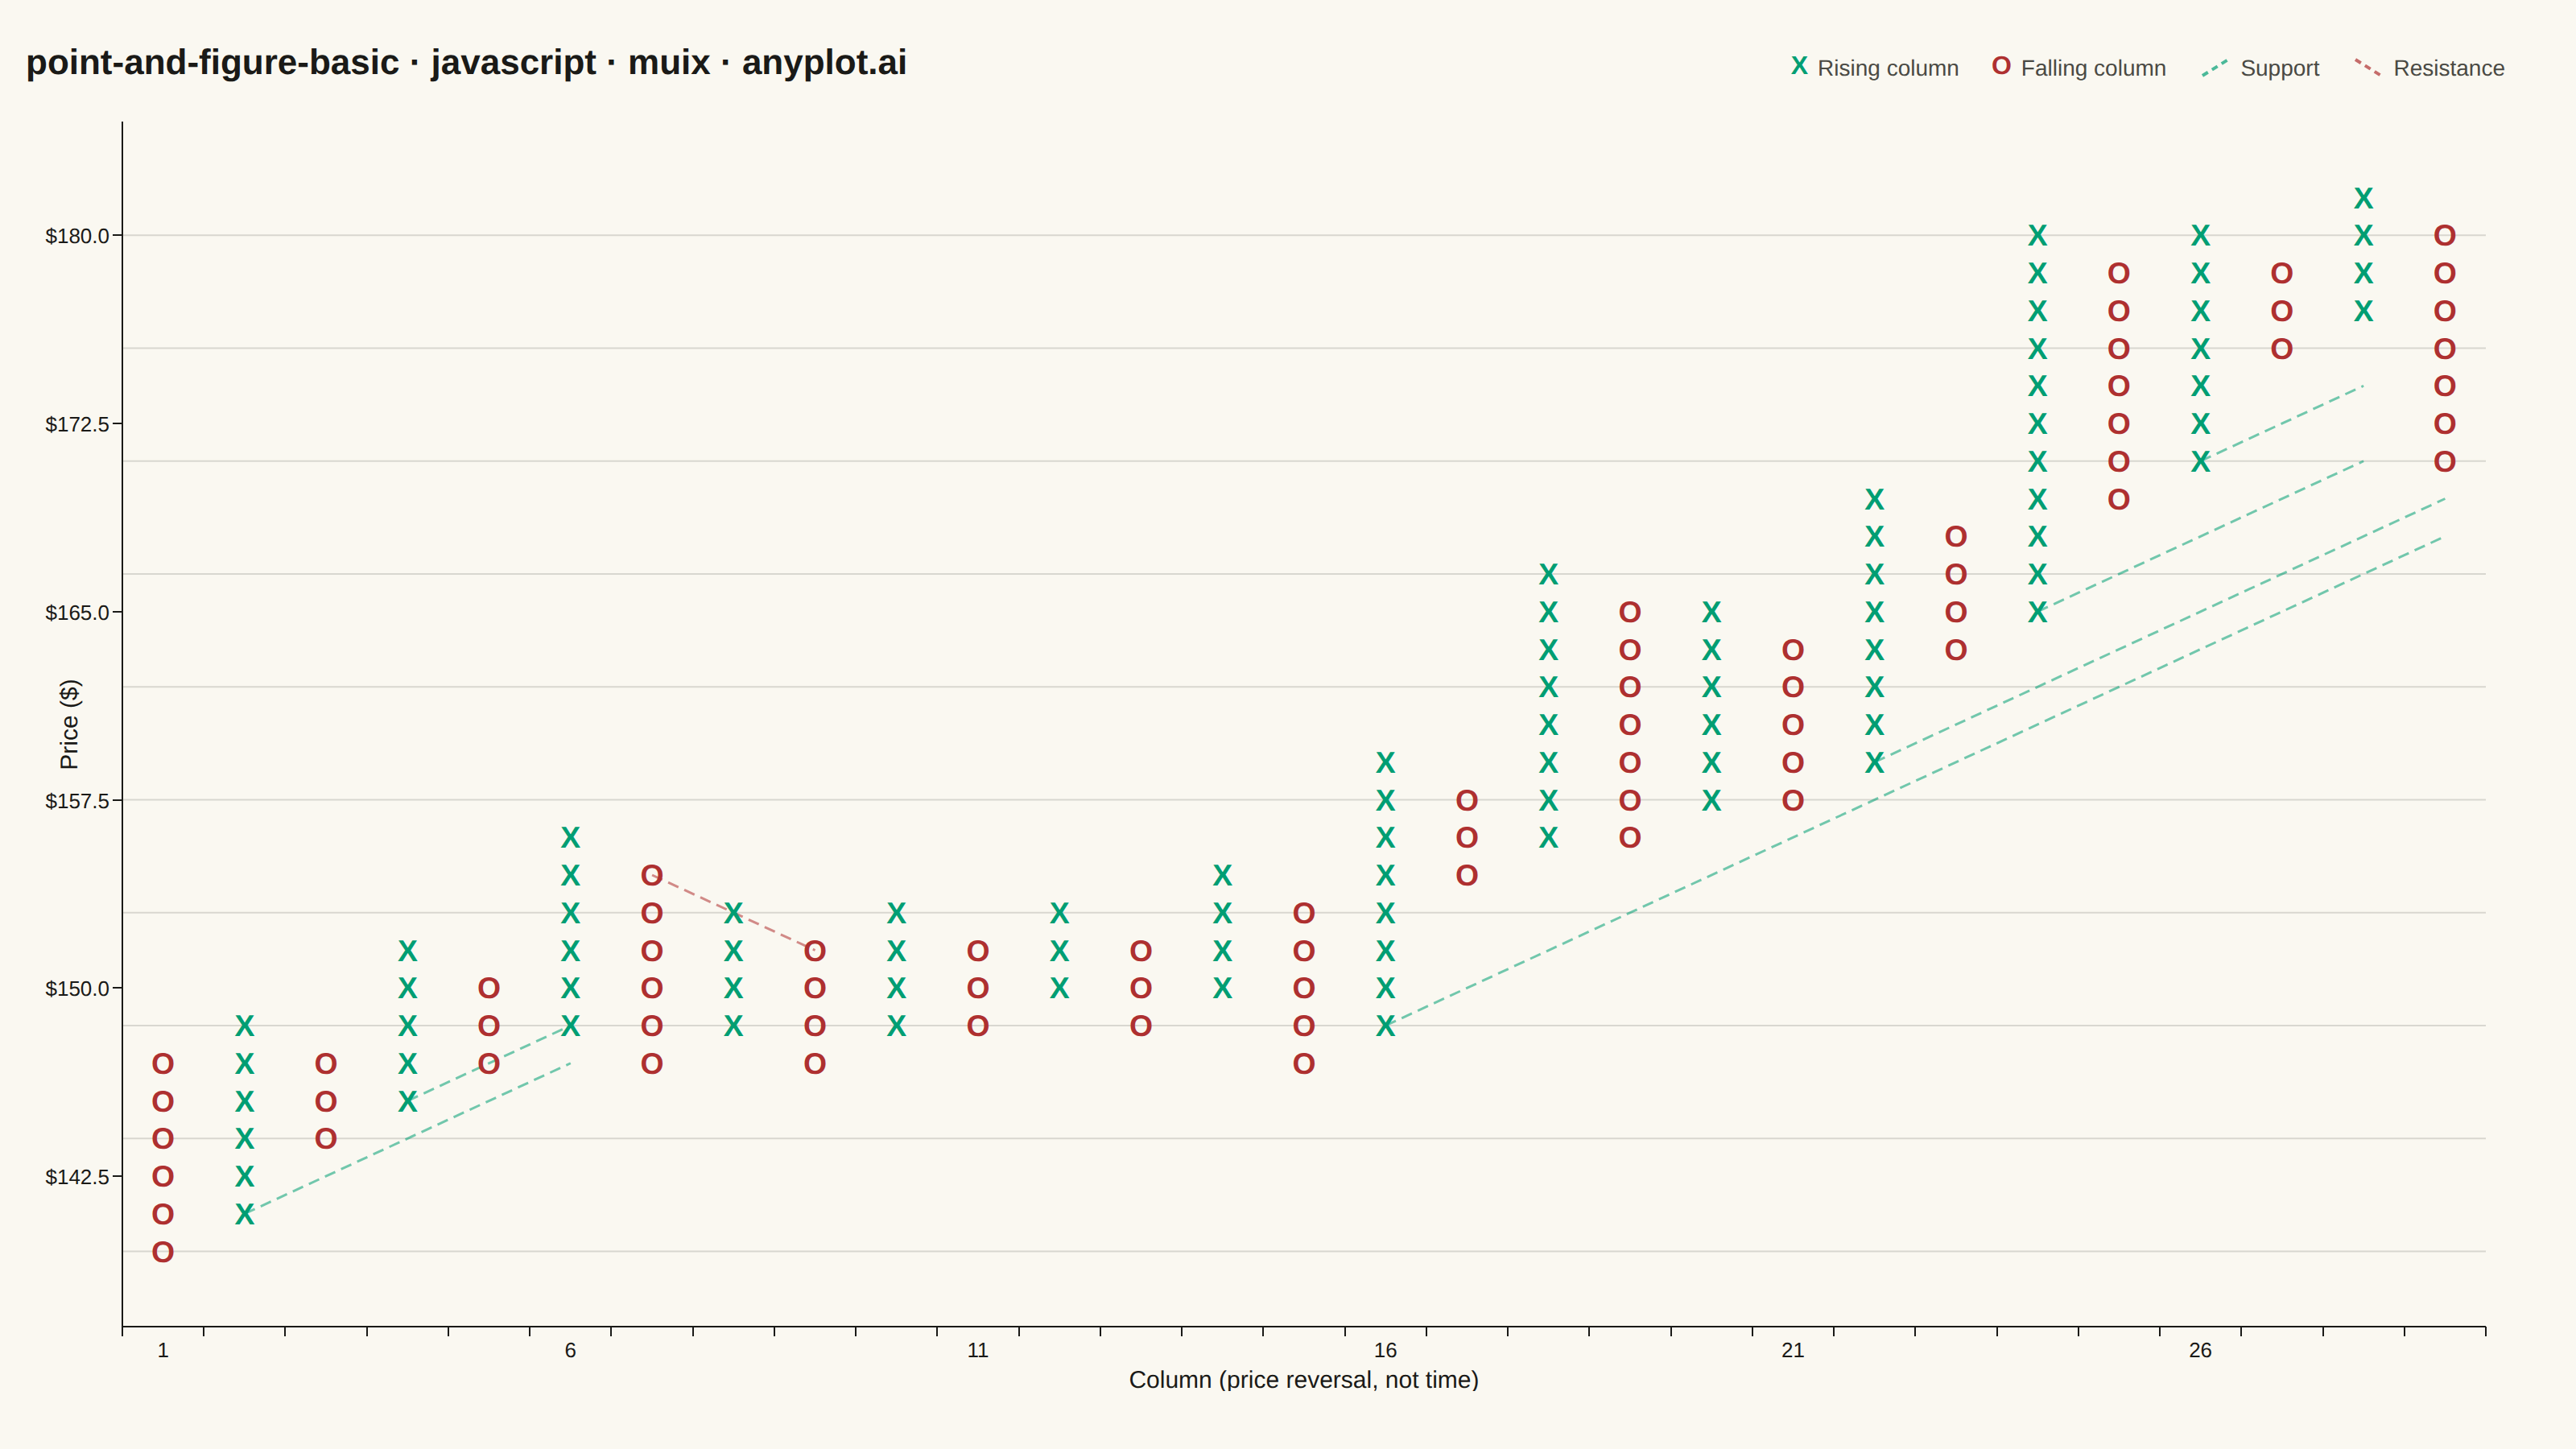
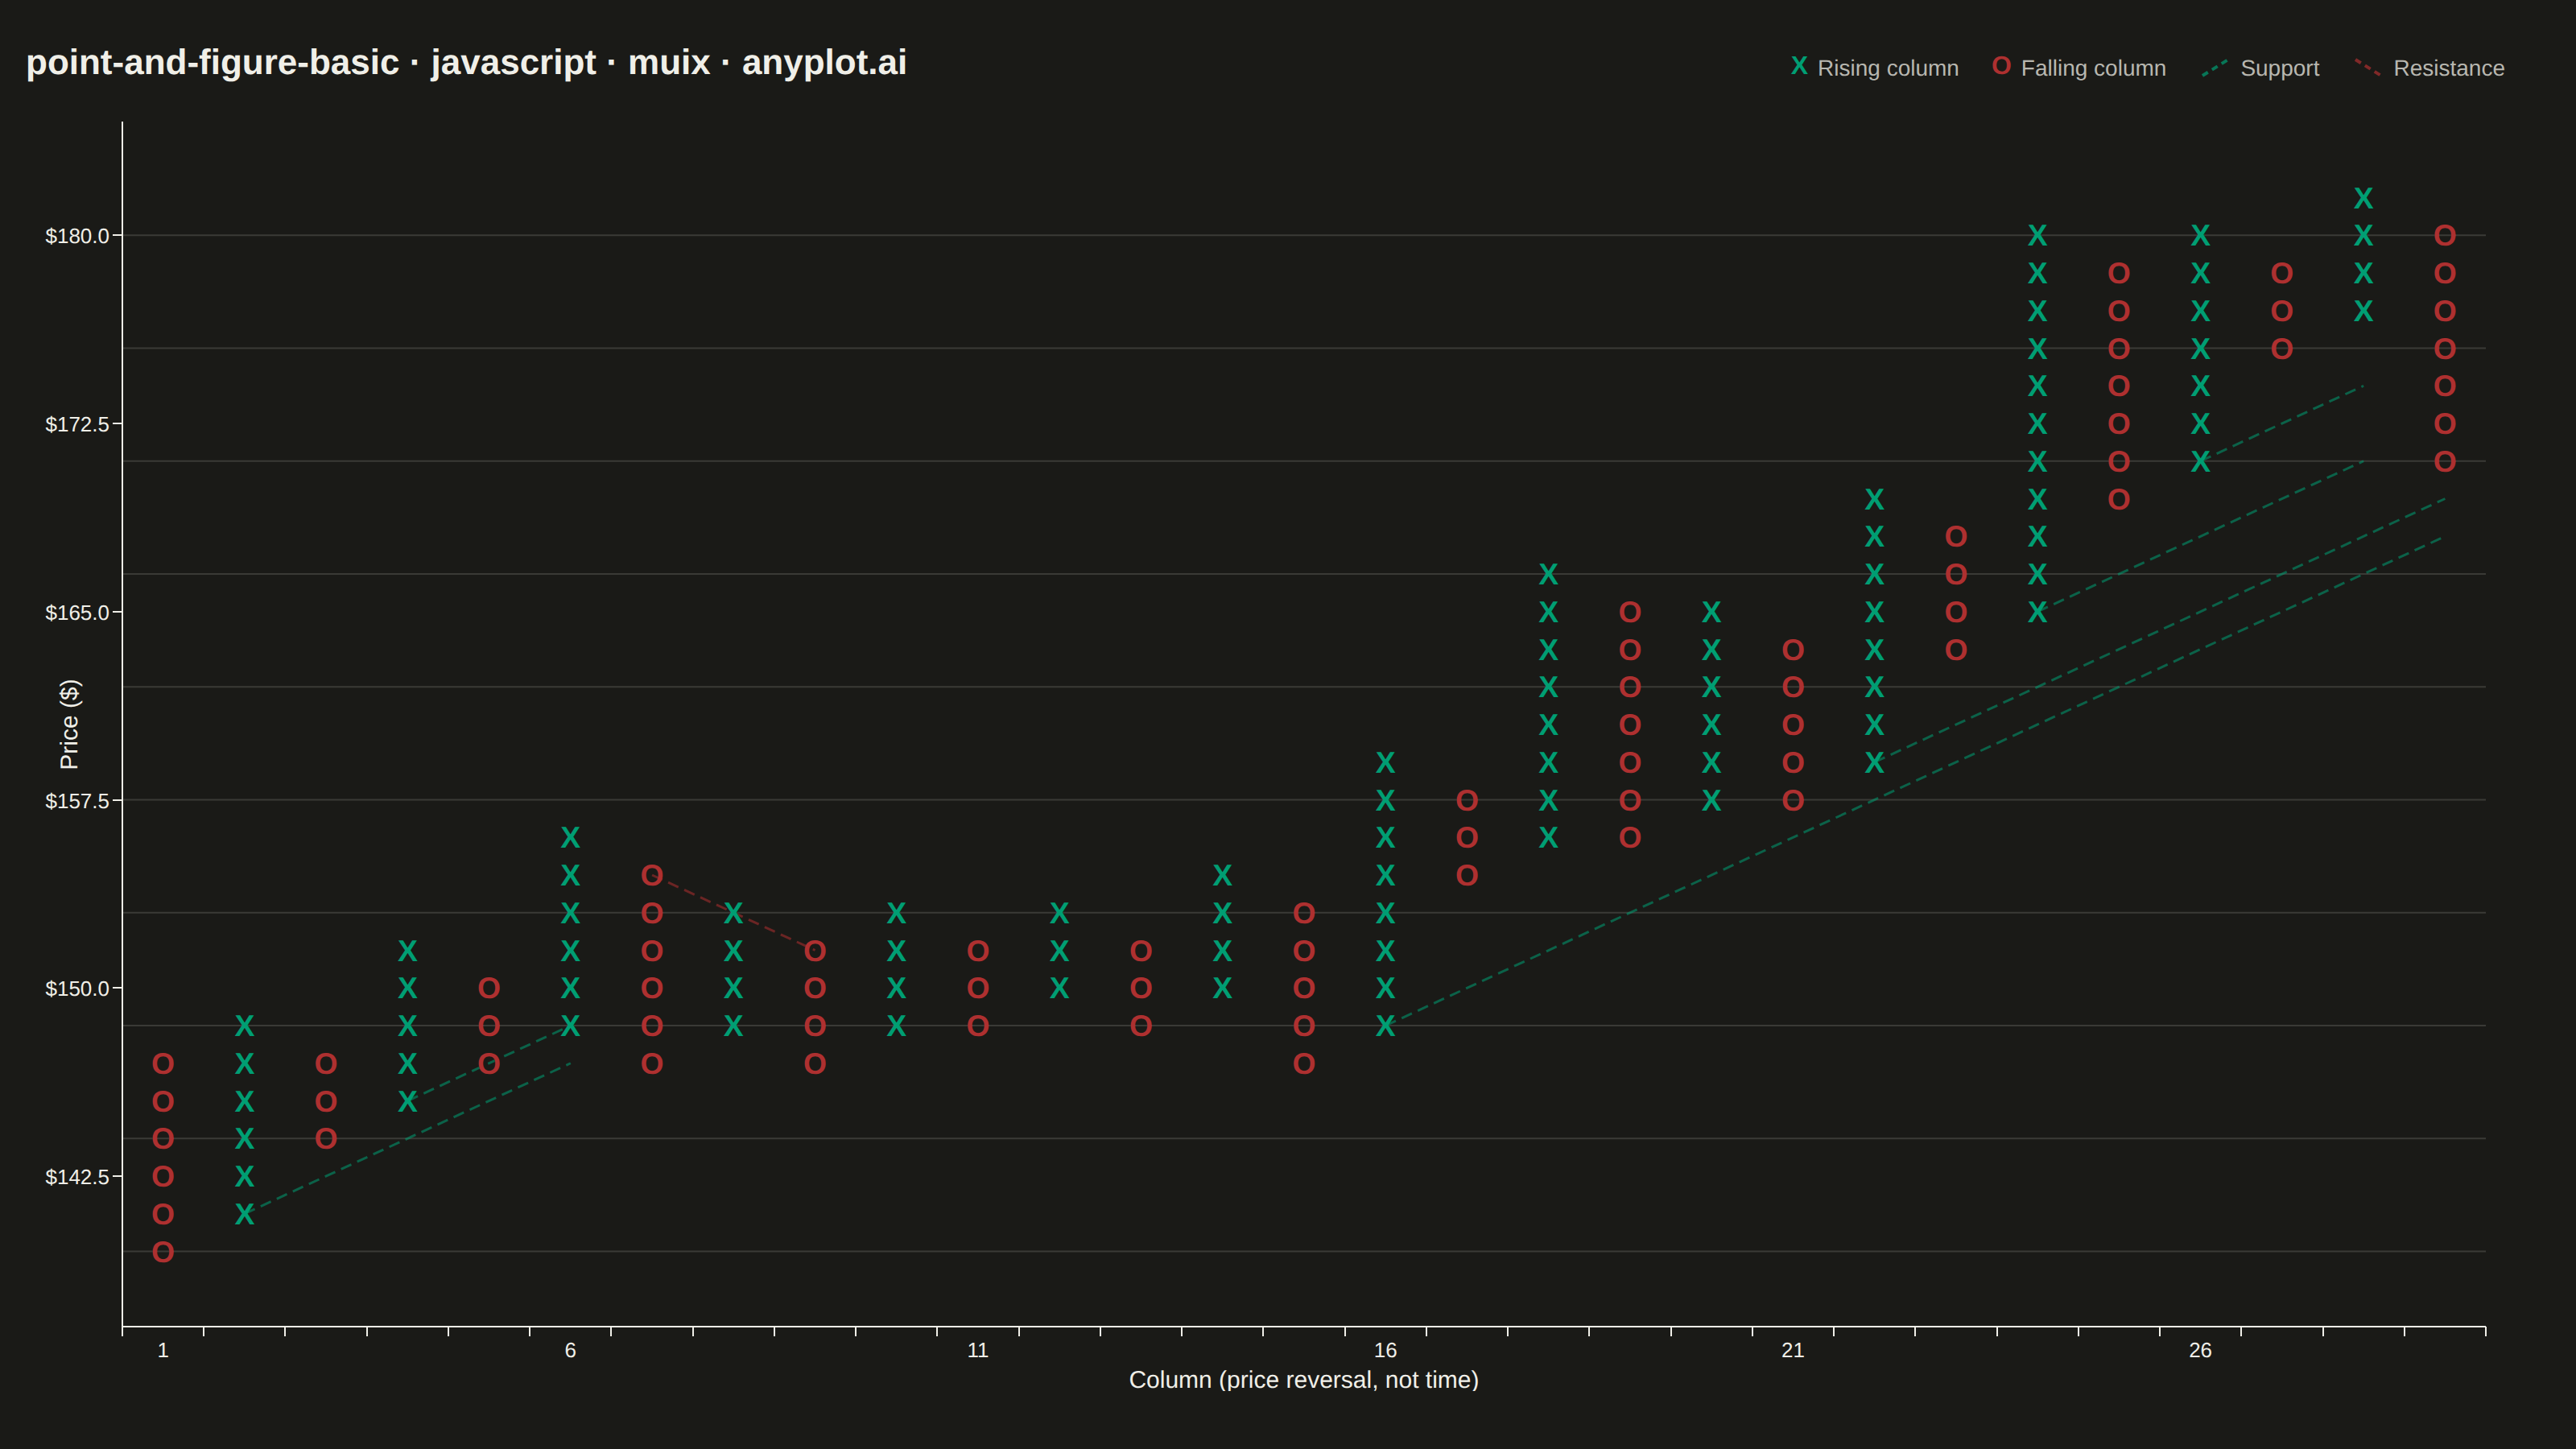
The same plot in 14 other libraries — JavaScript: Chart.js, D3.js, Apache ECharts, Highcharts; Python: Altair, Bokeh, lets-plot, Matplotlib, Plotly, plotnine, Pygal, Seaborn; R: ggplot2; Julia: Makie.jl. Compare all 15 side by side: Point and Figure Chart in Python, R, Julia and JavaScript.
A Point and Figure (P&F) chart is a price-action focused visualization that uses columns of X's (rising prices) and O's (falling prices) to display significant price movements while filtering out time and minor fluctuations. Unlike traditional time-based charts, P&F charts only plot a new symbol when price moves by a defined box size, and only start a new column when price reverses by a specified number of boxes (typically 3). This makes it ideal for identifying clear trends, support/resistance levels, and generating trading signals.
// anyplot.ai
// point-and-figure-basic: Point and Figure Chart
// Library: muix 7.29.1 | JavaScript 22.23.2
// Quality: 89/100 | Created: 2026-09-02
import { ChartContainer } from "@mui/x-charts/ChartContainer";
import { ChartsXAxis } from "@mui/x-charts/ChartsXAxis";
import { ChartsYAxis } from "@mui/x-charts/ChartsYAxis";
import { useXScale, useYScale } from "@mui/x-charts/hooks";
import { Box, Typography } from "@mui/material";

const t = window.ANYPLOT_TOKENS;
const TITLE = "point-and-figure-basic · javascript · muix · anyplot.ai";

// --- Deterministic daily-close series (small LCG PRNG — no seeded Math.random
// in the browser) standing in for ~1.5 years of a mid-cap stock's closes. ----
function makeLcg(seed) {
  let state = seed >>> 0;
  return () => {
    state = (Math.imul(state, 1664525) + 1013904223) >>> 0;
    return state / 4294967296;
  };
}

const NUM_SESSIONS = 360;
const rand = makeLcg(42);
const closes = [];
let price = 148;
for (let session = 0; session < NUM_SESSIONS; session += 1) {
  price = Math.max(60, price + 0.01 + (rand() - 0.5) * 4.3);
  closes.push(Math.round(price * 100) / 100);
}

// --- Point & Figure column construction (classic close-only method) --------
// A box is added whenever price moves a full BOX_SIZE from the last plotted
// box. A new column only opens once price reverses by REVERSAL_BOXES boxes —
// this is what strips time and minor noise out of the chart, leaving only
// columns of X (rising) and O (falling) boxes.
const BOX_SIZE = 1.5; // $ per box
const REVERSAL_BOXES = 3; // boxes required to reverse column direction

function buildColumns(prices, boxSize, reversalBoxes) {
  let boxIndex = Math.round(prices[0] / boxSize);
  let direction = null;
  let boxesInColumn = [boxIndex];
  const columns = [];

  for (let i = 1; i < prices.length; i += 1) {
    const nextBox = Math.round(prices[i] / boxSize);
    if (direction === null) {
      if (nextBox > boxIndex) {
        direction = "X";
        for (let b = boxIndex + 1; b <= nextBox; b += 1) boxesInColumn.push(b);
        boxIndex = nextBox;
      } else if (nextBox < boxIndex) {
        direction = "O";
        for (let b = boxIndex - 1; b >= nextBox; b -= 1) boxesInColumn.push(b);
        boxIndex = nextBox;
      }
      continue;
    }
    if (direction === "X") {
      if (nextBox > boxIndex) {
        for (let b = boxIndex + 1; b <= nextBox; b += 1) boxesInColumn.push(b);
        boxIndex = nextBox;
      } else if (nextBox <= boxIndex - reversalBoxes) {
        columns.push({ direction, boxes: boxesInColumn });
        direction = "O";
        boxesInColumn = [];
        for (let b = boxIndex - 1; b >= nextBox; b -= 1) boxesInColumn.push(b);
        boxIndex = nextBox;
      }
    } else {
      if (nextBox < boxIndex) {
        for (let b = boxIndex - 1; b >= nextBox; b -= 1) boxesInColumn.push(b);
        boxIndex = nextBox;
      } else if (nextBox >= boxIndex + reversalBoxes) {
        columns.push({ direction, boxes: boxesInColumn });
        direction = "X";
        boxesInColumn = [];
        for (let b = boxIndex + 1; b <= nextBox; b += 1) boxesInColumn.push(b);
        boxIndex = nextBox;
      }
    }
  }
  columns.push({ direction: direction ?? "X", boxes: boxesInColumn });
  return columns;
}

const columns = buildColumns(closes, BOX_SIZE, REVERSAL_BOXES);
const allBoxes = columns.flatMap((column) => column.boxes);
const minBox = Math.min(...allBoxes);
const maxBox = Math.max(...allBoxes);

// --- 45-degree support/resistance trend lines (classic P&F construction) ---
// Support: anchored on the low of a bullish reversal column (an X column that
// immediately follows an O column), extended up-right at +1 box per column
// until a later O column's low breaks below the line.
// Resistance: anchored on the high of a bearish reversal column (an O column
// that immediately follows an X column), extended down-right at -1 box per
// column until a later X column's high breaks above the line.
const MIN_TREND_SPAN = 2; // columns — drop trivially short lines to limit clutter
function buildTrendLines(cols) {
  const supports = [];
  const resistances = [];
  for (let i = 1; i < cols.length; i += 1) {
    const column = cols[i];
    const prevColumn = cols[i - 1];
    if (column.direction === "X" && prevColumn.direction === "O") {
      const startBox = Math.min(...column.boxes);
      let endIndex = i;
      for (let j = i + 1; j < cols.length; j += 1) {
        const projected = startBox + (j - i);
        if (cols[j].direction === "O" && Math.min(...cols[j].boxes) < projected) break;
        endIndex = j;
      }
      if (endIndex - i >= MIN_TREND_SPAN) {
        supports.push({ startIndex: i, startBox, endIndex, endBox: startBox + (endIndex - i) });
      }
    }
    if (column.direction === "O" && prevColumn.direction === "X") {
      const startBox = Math.max(...column.boxes);
      let endIndex = i;
      for (let j = i + 1; j < cols.length; j += 1) {
        const projected = startBox - (j - i);
        if (cols[j].direction === "X" && Math.max(...cols[j].boxes) > projected) break;
        endIndex = j;
      }
      if (endIndex - i >= MIN_TREND_SPAN) {
        resistances.push({ startIndex: i, startBox, endIndex, endBox: startBox - (endIndex - i) });
      }
    }
  }
  return { supports, resistances };
}

const { supports: supportLines, resistances: resistanceLines } = buildTrendLines(columns);

// Finance semantic exception: rising (X) columns read as green/bullish,
// falling (O) columns as red/bearish — not the plain ordinal 1st/2nd slots.
const RISING = t.palette[0]; // brand green — bullish X columns
const FALLING = t.palette[4]; // matte red (semantic loss anchor) — bearish O columns

// --- Chart (default-exported component — the harness mounts it) -----------
export default function Chart() {
  const size = window.ANYPLOT_SIZE;
  const padding = { top: 28, right: 44, bottom: 20, left: 16 };
  const headerHeight = 56;
  const chartWidth = size.width - padding.left - padding.right;
  const chartHeight = size.height - padding.top - padding.bottom - headerHeight;

  return (
    <Box
      sx={{
        width: size.width,
        height: size.height,
        boxSizing: "border-box",
        padding: `${padding.top}px ${padding.right}px ${padding.bottom}px ${padding.left}px`,
        display: "flex",
        flexDirection: "column",
      }}
    >
      <Box sx={{ display: "flex", alignItems: "baseline", justifyContent: "space-between", mb: "18px" }}>
        <Typography sx={{ fontSize: 22, fontWeight: 600, color: "text.primary", lineHeight: 1 }}>
          {TITLE}
        </Typography>
        <Box sx={{ display: "flex", alignItems: "center", gap: "20px" }}>
          <Box sx={{ display: "flex", alignItems: "center", gap: "6px" }}>
            <Typography sx={{ fontSize: 16, fontWeight: 700, color: RISING, lineHeight: 1 }}>X</Typography>
            <Typography sx={{ fontSize: 14, color: "text.secondary", lineHeight: 1 }}>Rising column</Typography>
          </Box>
          <Box sx={{ display: "flex", alignItems: "center", gap: "6px" }}>
            <Typography sx={{ fontSize: 16, fontWeight: 700, color: FALLING, lineHeight: 1 }}>O</Typography>
            <Typography sx={{ fontSize: 14, color: "text.secondary", lineHeight: 1 }}>Falling column</Typography>
          </Box>
          <Box sx={{ display: "flex", alignItems: "center", gap: "6px" }}>
            <svg width="20" height="14" aria-hidden="true">
              <line x1="2" y1="12" x2="18" y2="2" stroke={RISING} strokeWidth={2} strokeDasharray="4 3" strokeOpacity={0.7} />
            </svg>
            <Typography sx={{ fontSize: 14, color: "text.secondary", lineHeight: 1 }}>Support</Typography>
          </Box>
          <Box sx={{ display: "flex", alignItems: "center", gap: "6px" }}>
            <svg width="20" height="14" aria-hidden="true">
              <line x1="2" y1="2" x2="18" y2="12" stroke={FALLING} strokeWidth={2} strokeDasharray="4 3" strokeOpacity={0.7} />
            </svg>
            <Typography sx={{ fontSize: 14, color: "text.secondary", lineHeight: 1 }}>Resistance</Typography>
          </Box>
        </Box>
      </Box>
      <ChartContainer
        width={chartWidth}
        height={chartHeight}
        series={[]}
        skipAnimation
        margin={{ top: 8, right: 12, bottom: 40, left: 60 }}
        xAxis={[
          {
            id: "columns",
            scaleType: "band",
            data: columns.map((_, index) => index + 1),
            categoryGapRatio: 0.12,
            label: "Column (price reversal, not time)",
            labelStyle: { fontSize: 15 },
            tickLabelStyle: { fontSize: 13 },
            tickLabelInterval: (_value, index) => index % 5 === 0,
          },
        ]}
        yAxis={[
          {
            id: "price",
            scaleType: "linear",
            min: minBox - 2,
            max: maxBox + 2,
            label: "Price ($)",
            labelStyle: { fontSize: 15 },
            valueFormatter: (boxValue) => `$${(boxValue * BOX_SIZE).toFixed(1)}`,
            tickLabelStyle: { fontSize: 13 },
            tickNumber: 10,
          },
        ]}
      >
        <PriceGrid minBox={minBox} maxBox={maxBox} />
        <TrendLines supports={supportLines} resistances={resistanceLines} />
        <PfMarks columns={columns} />
        <ChartsXAxis axisId="columns" />
        <ChartsYAxis axisId="price" />
      </ChartContainer>
    </Box>
  );
}

// Horizontal reference lines at round box-size price intervals, per the spec
// note to scale the Y-axis with grid lines at box-size intervals.
function PriceGrid({ minBox, maxBox }) {
  const xScale = useXScale();
  const yScale = useYScale();
  const [left, right] = xScale.range();
  const step = Math.max(1, Math.round((maxBox - minBox) / 9));
  const rows = [];
  for (let box = Math.ceil(minBox / step) * step; box <= maxBox; box += step) rows.push(box);

  return (
    <g>
      {rows.map((box) => (
        <line key={box} x1={left} x2={right} y1={yScale(box)} y2={yScale(box)} stroke={t.grid} strokeWidth={1} />
      ))}
    </g>
  );
}

// Diagonal 45-degree support/resistance reference lines (spec-required), drawn
// as a subtle dashed overlay so they read as trend guides rather than data.
function TrendLines({ supports, resistances }) {
  const xScale = useXScale();
  const yScale = useYScale();
  const half = xScale.bandwidth() / 2;
  const toPoint = (index, box) => ({ x: xScale(index + 1) + half, y: yScale(box) });

  return (
    <g>
      {supports.map((line, index) => {
        const start = toPoint(line.startIndex, line.startBox);
        const end = toPoint(line.endIndex, line.endBox);
        return (
          <line
            key={`support-${index}`}
            x1={start.x}
            y1={start.y}
            x2={end.x}
            y2={end.y}
            stroke={RISING}
            strokeWidth={1.5}
            strokeDasharray="7 4"
            strokeOpacity={0.55}
          />
        );
      })}
      {resistances.map((line, index) => {
        const start = toPoint(line.startIndex, line.startBox);
        const end = toPoint(line.endIndex, line.endBox);
        return (
          <line
            key={`resistance-${index}`}
            x1={start.x}
            y1={start.y}
            x2={end.x}
            y2={end.y}
            stroke={FALLING}
            strokeWidth={1.5}
            strokeDasharray="7 4"
            strokeOpacity={0.55}
          />
        );
      })}
    </g>
  );
}

// The X/O glyphs themselves — one per box, stacked inside each column. MUI X
// has no native P&F series type, so the marks are placed directly with the
// chart's own band/linear scales (the same scales ChartsXAxis/ChartsYAxis use).
function PfMarks({ columns: pfColumns }) {
  const xScale = useXScale();
  const yScale = useYScale();
  const half = xScale.bandwidth() / 2;
  const rowHeight = Math.abs(yScale(1) - yScale(0));
  const fontSize = Math.max(10, Math.min(xScale.bandwidth() * 0.6, rowHeight * 0.8, 22));

  return (
    <g style={{ fontWeight: 700 }}>
      {pfColumns.map((column, columnIndex) => {
        const cx = xScale(columnIndex + 1) + half;
        const color = column.direction === "X" ? RISING : FALLING;
        return column.boxes.map((box) => (
          <text
            key={`${columnIndex}-${box}`}
            x={cx}
            y={yScale(box)}
            fontSize={fontSize}
            fill={color}
            textAnchor="middle"
            dominantBaseline="central"
          >
            {column.direction}
          </text>
        ));
      })}
    </g>
  );
}
Runnable source as JSON, for any HTTP client: https://api.anyplot.ai/specs/point-and-figure-basic/muix/code. Any spec id and library id listed in llms-full.txt fit the same URL shape; every URL below is complete and callable.
{
  "spec_id": "point-and-figure-basic",
  "language": "javascript",
  "library": "muix",
  "page": "https://anyplot.ai/point-and-figure-basic/javascript/muix",
  "hub": "https://anyplot.ai/point-and-figure-basic",
  "code_json": "https://api.anyplot.ai/specs/point-and-figure-basic/muix/code",
  "spec_json": "https://api.anyplot.ai/specs/point-and-figure-basic",
  "render_light_png": "https://storage.googleapis.com/anyplot-images/plots/point-and-figure-basic/javascript/muix/plot-light.png",
  "render_dark_png": "https://storage.googleapis.com/anyplot-images/plots/point-and-figure-basic/javascript/muix/plot-dark.png",
  "interactive_light_html": "https://storage.googleapis.com/anyplot-images/plots/point-and-figure-basic/javascript/muix/plot-light.html",
  "interactive_dark_html": "https://storage.googleapis.com/anyplot-images/plots/point-and-figure-basic/javascript/muix/plot-dark.html",
  "quality_score": 89.0,
  "license": "MIT",
  "guide": "https://anyplot.ai/llms.txt"
}
Part of Point and Figure Chart on anyplot.ai.