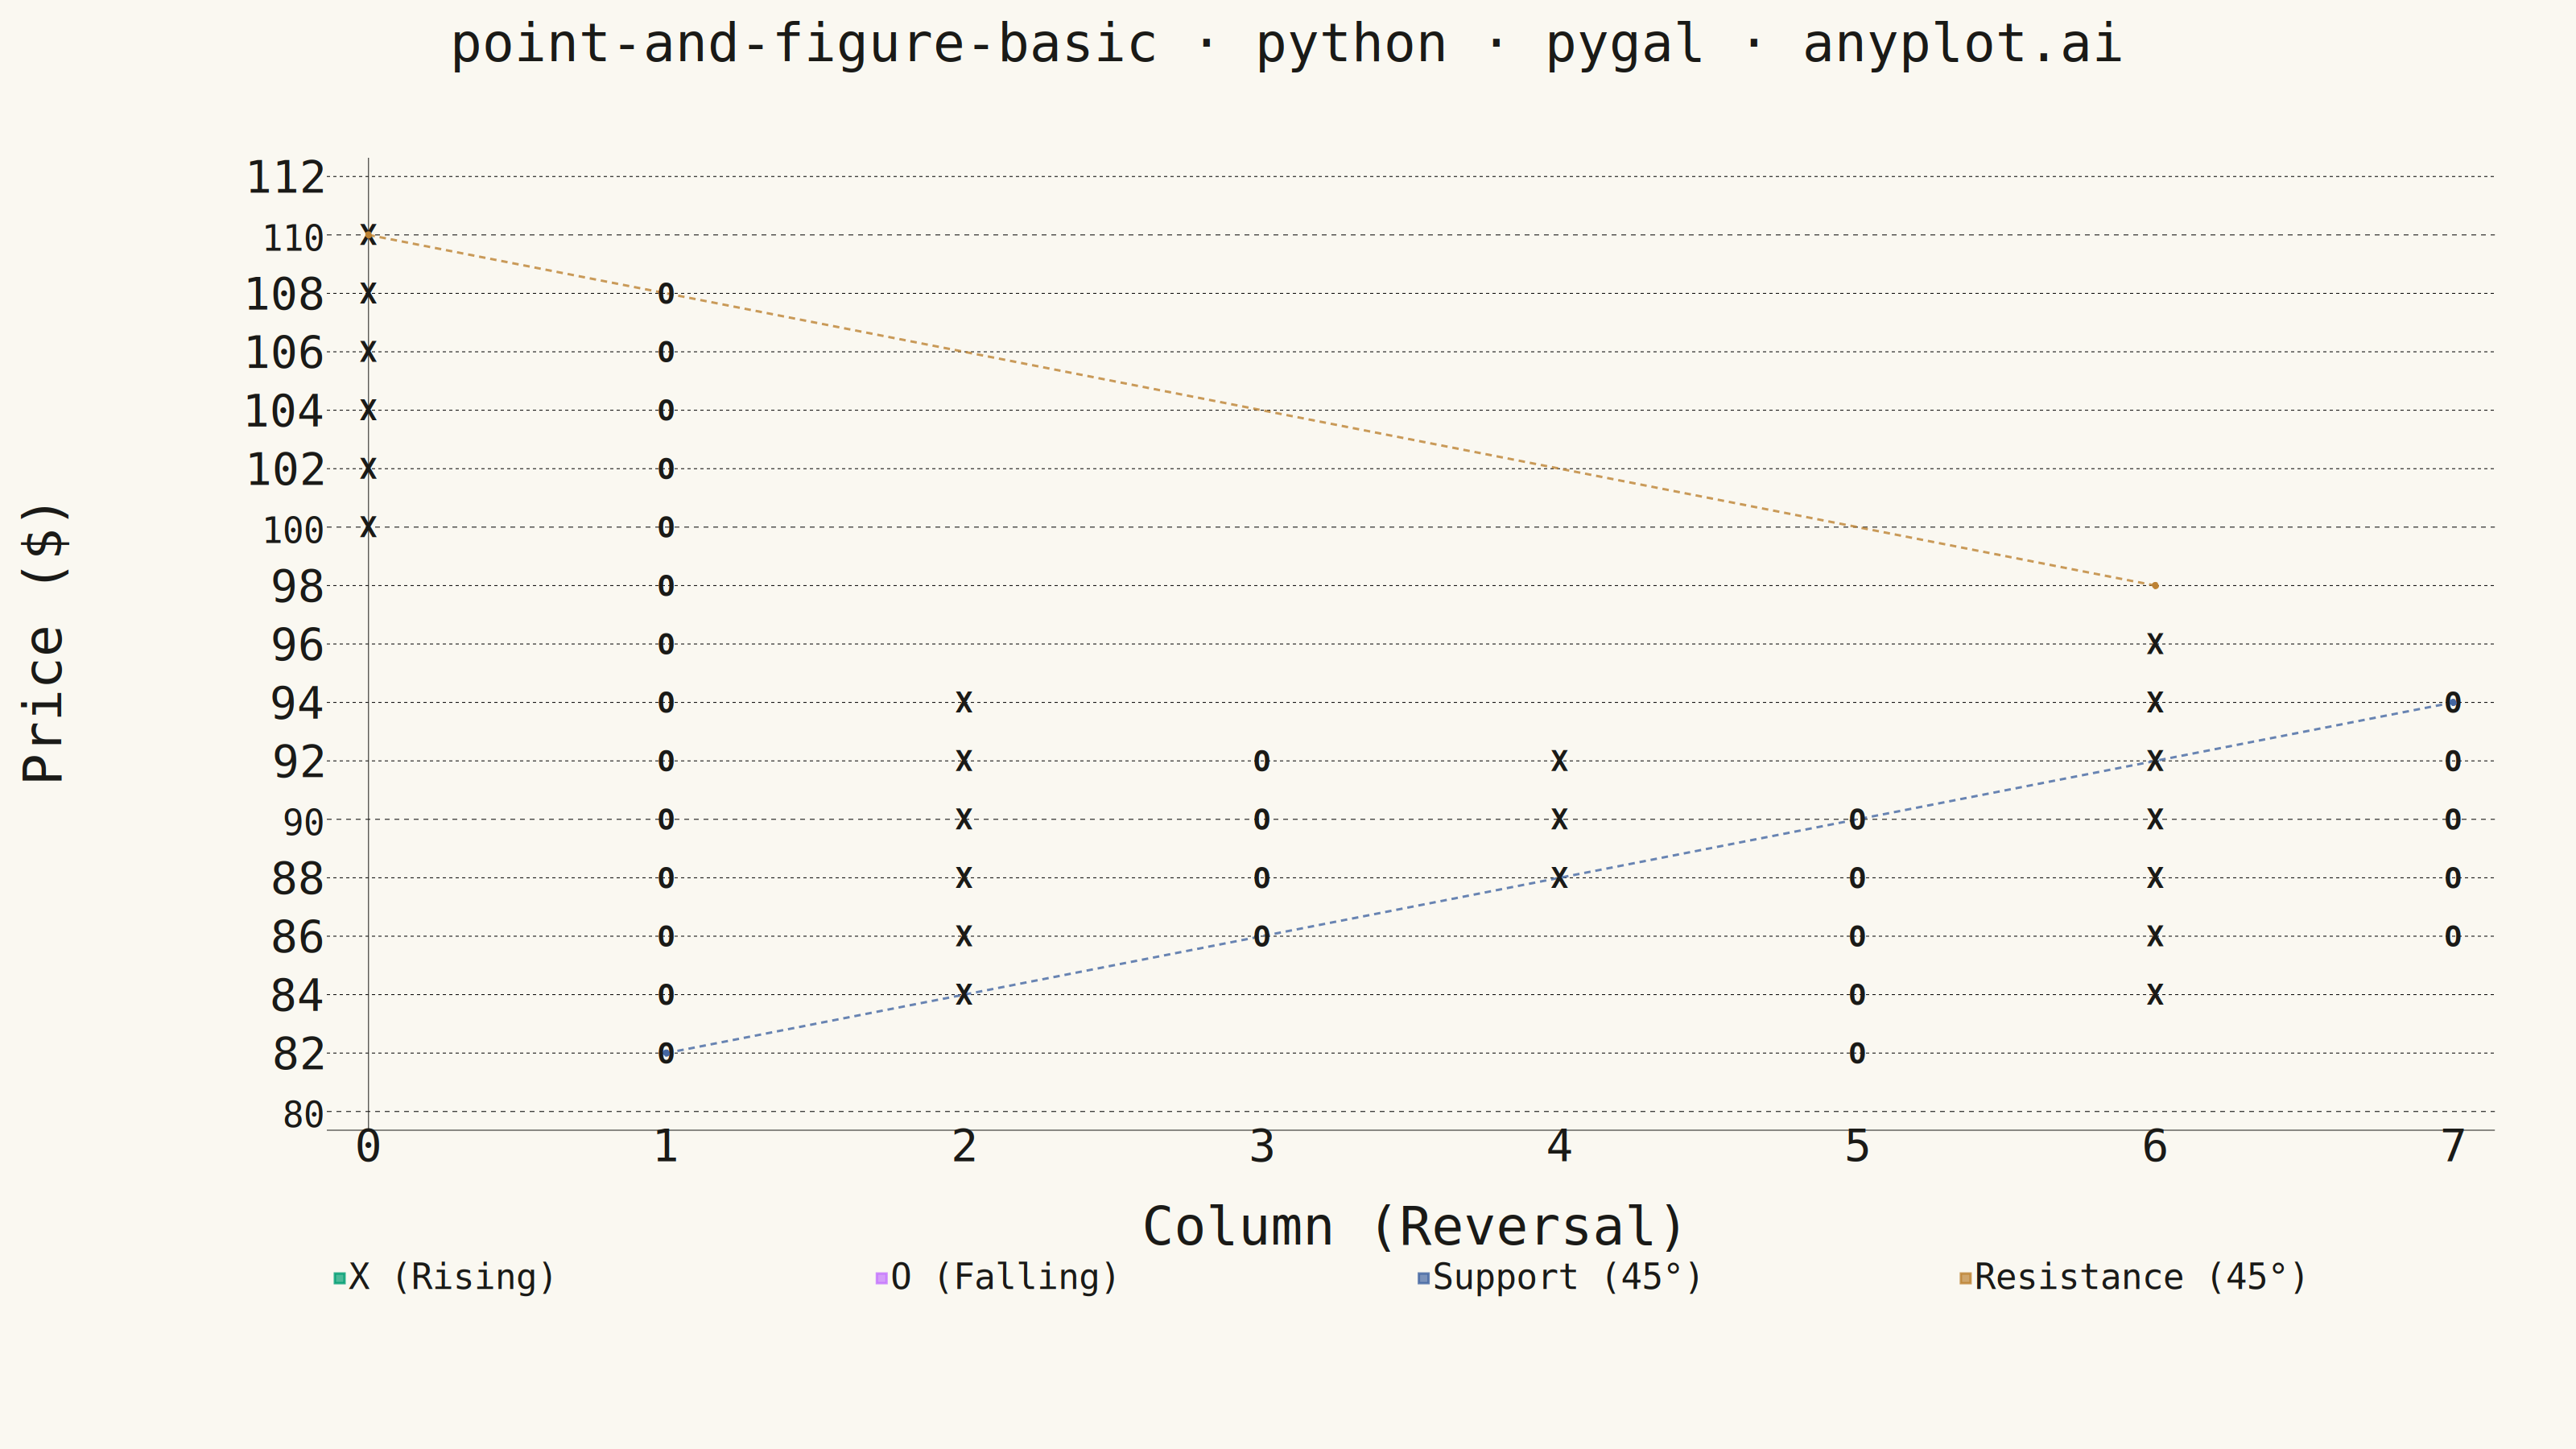
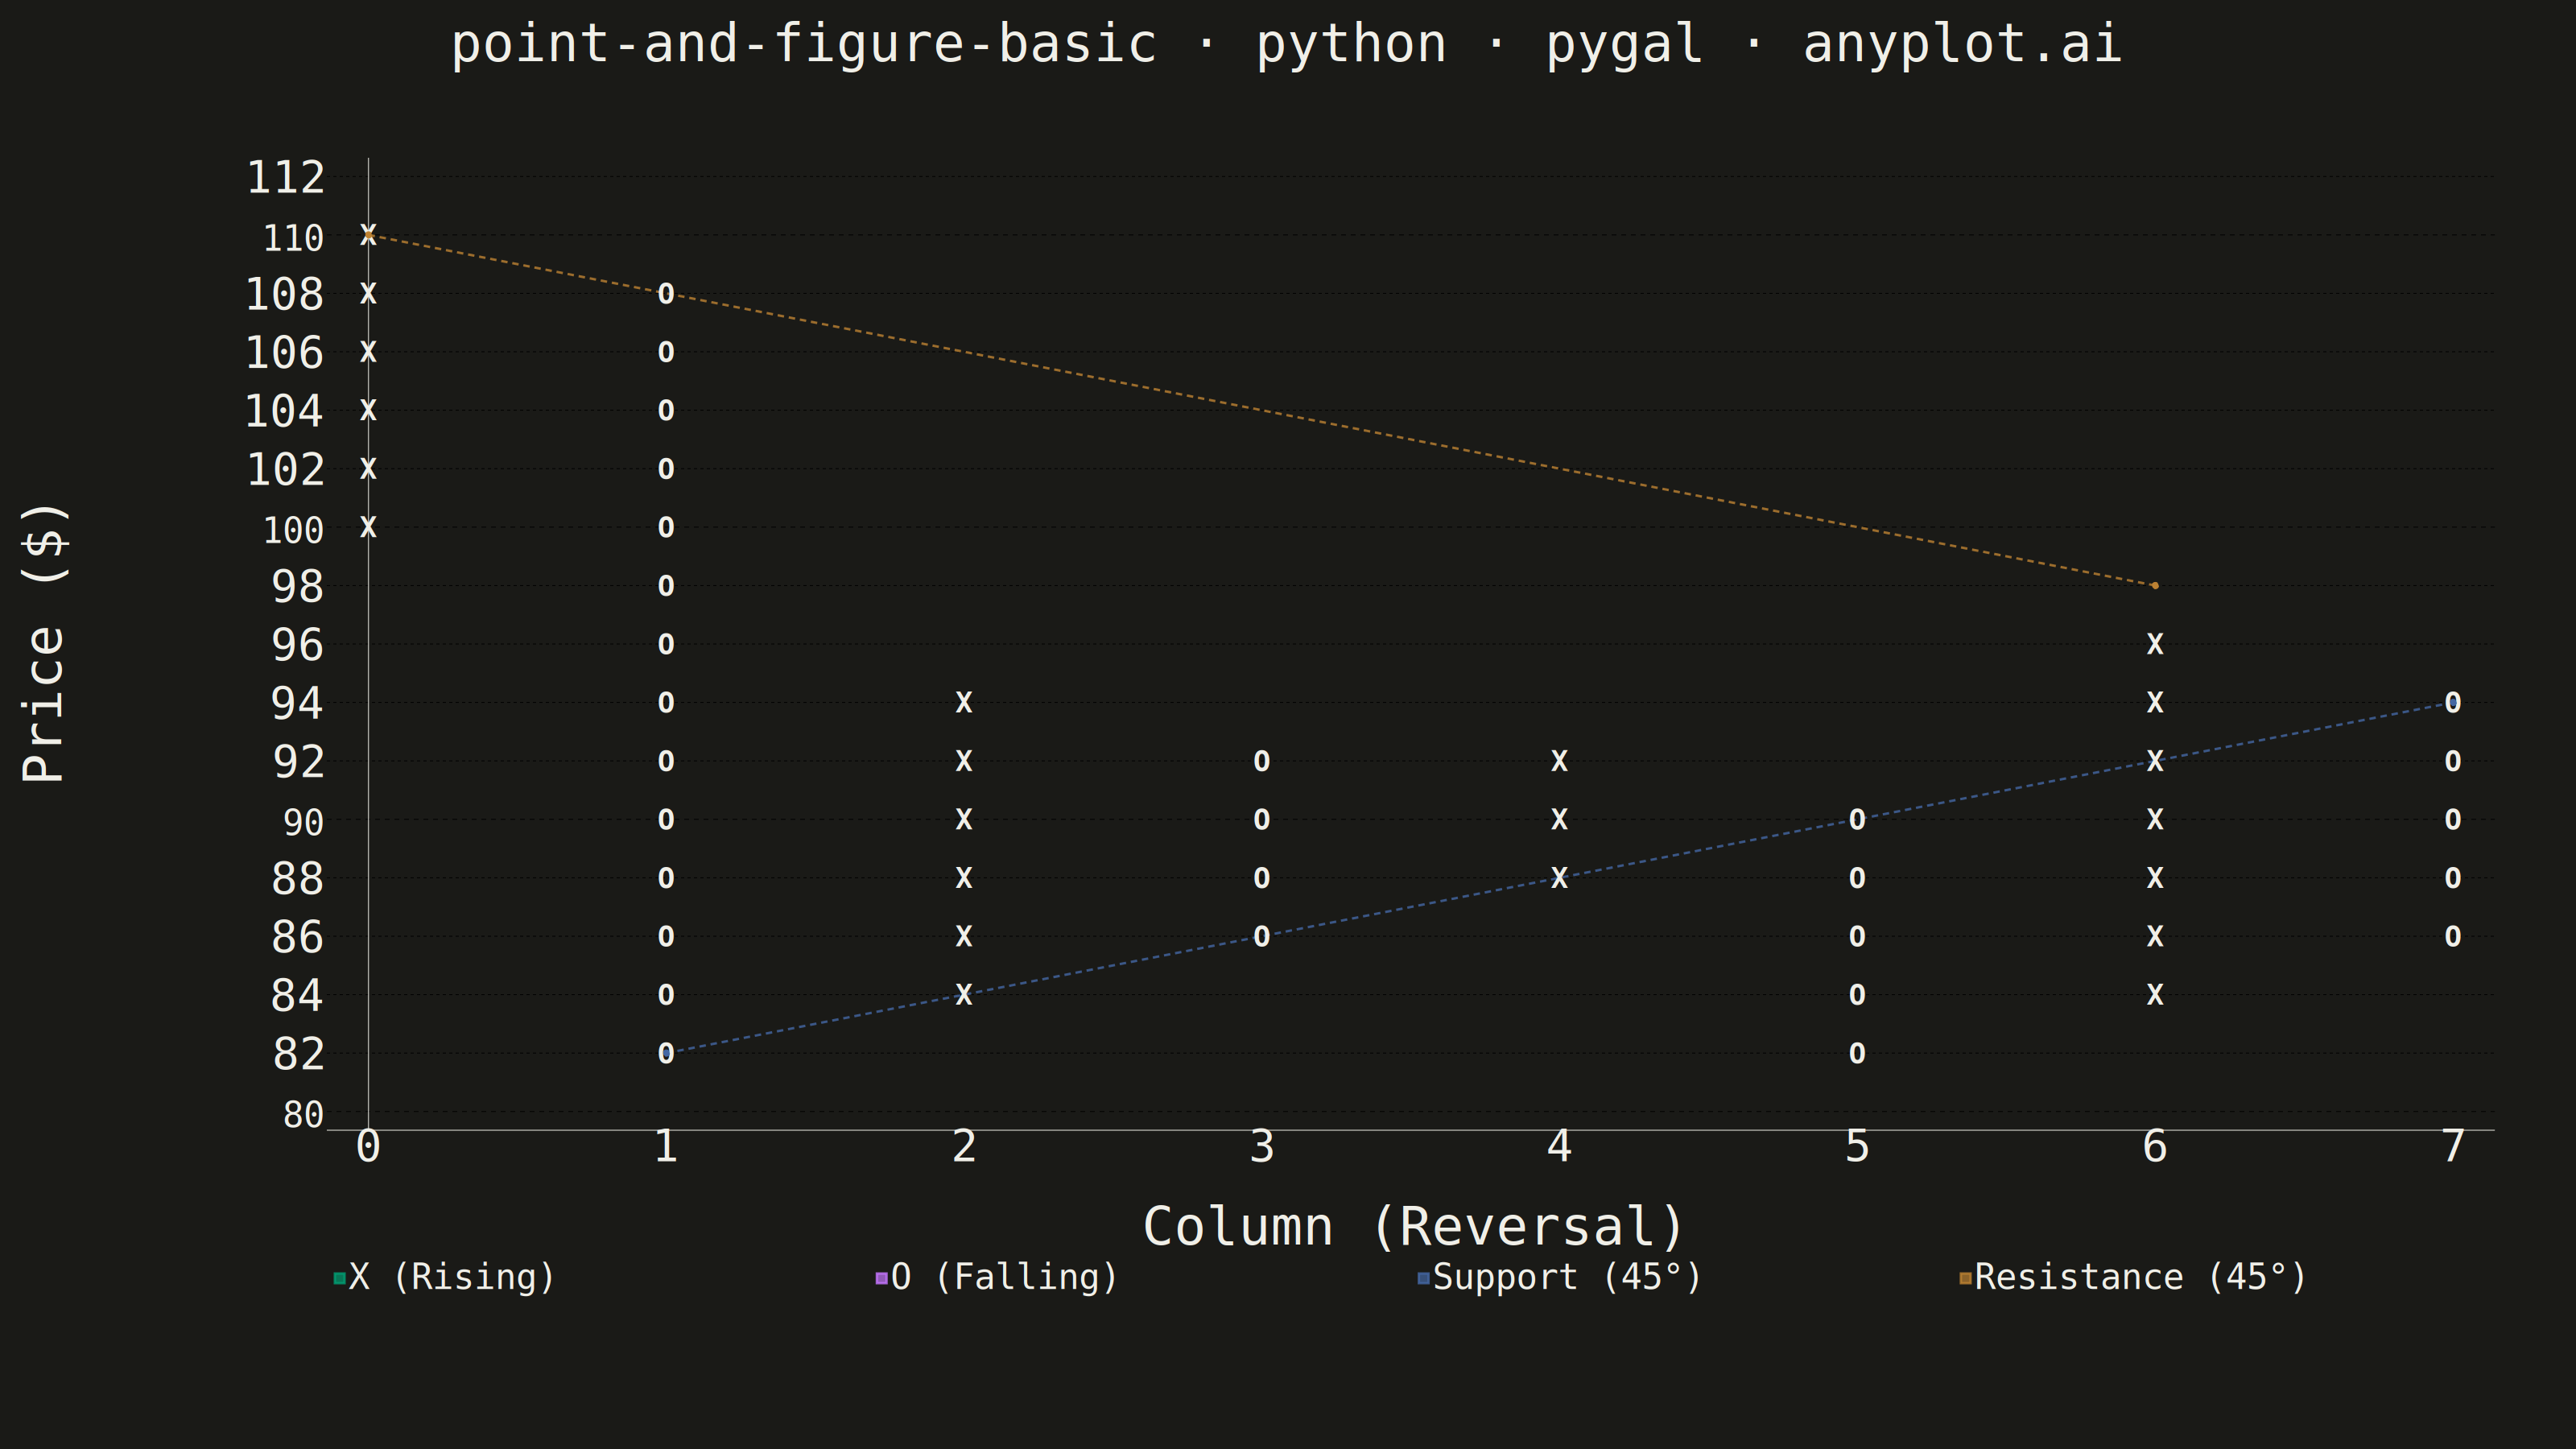
A Point and Figure (P&F) chart is a price-action focused visualization that uses columns of X's (rising prices) and O's (falling prices) to display significant price movements while filtering out time and minor fluctuations. Unlike traditional time-based charts, P&F charts only plot a new symbol when price moves by a defined box size, and only start a new column when price reverses by a specified number of boxes (typically 3). This makes it ideal for identifying clear trends, support/resistance levels, and generating trading signals.
""" anyplot.ai
point-and-figure-basic: Point and Figure Chart
Library: pygal 3.1.0 | Python 3.13.13
Quality: 86/100 | Updated: 2026-05-20
"""

import os as _os
import sys as _sys


# This file is named pygal.py — remove its directory from sys.path first so
# Python resolves `pygal` to the installed package, not this file itself.
_here = _os.path.abspath(_os.path.dirname(__file__))
_sys.path = [p for p in _sys.path if _os.path.abspath(p or ".") != _here]

import os
import xml.etree.ElementTree as ET

import cairosvg
import numpy as np
import pygal
from pygal.style import Style


THEME = os.getenv("ANYPLOT_THEME", "light")
PAGE_BG = "#FAF8F1" if THEME == "light" else "#1A1A17"
INK = "#1A1A17" if THEME == "light" else "#F0EFE8"
INK_MUTED = "#6B6A63" if THEME == "light" else "#A8A79F"

IMPRINT = ("#009E73", "#C475FD", "#4467A3", "#BD8233", "#AE3030", "#2ABCCD", "#954477")

# Data
np.random.seed(42)
n_days = 150
base_price = 100.0
returns = np.random.normal(0.001, 0.02, n_days)
prices = base_price * np.cumprod(1 + returns)

# P&F parameters
box_size = 2.0
reversal = 3

# P&F algorithm
columns = []
current_direction = None
current_column_start = np.floor(prices[0] / box_size) * box_size
current_column_end = current_column_start

for price in prices[1:]:
    rounded_price = np.floor(price / box_size) * box_size

    if current_direction is None:
        if rounded_price >= current_column_end + box_size:
            current_direction = "X"
            current_column_end = rounded_price
        elif rounded_price <= current_column_end - box_size:
            current_direction = "O"
            current_column_end = rounded_price
    elif current_direction == "X":
        if rounded_price >= current_column_end + box_size:
            current_column_end = rounded_price
        elif rounded_price <= current_column_end - (reversal * box_size):
            columns.append((current_column_start, current_column_end, "X"))
            current_column_start = current_column_end - box_size
            current_column_end = rounded_price
            current_direction = "O"
    else:
        if rounded_price <= current_column_end - box_size:
            current_column_end = rounded_price
        elif rounded_price >= current_column_end + (reversal * box_size):
            columns.append((current_column_start, current_column_end, "O"))
            current_column_start = current_column_end + box_size
            current_column_end = rounded_price
            current_direction = "X"

if current_direction:
    columns.append((current_column_start, current_column_end, current_direction))

# Price range for y-axis
all_prices = [p for start, end, _ in columns for p in (start, end)]
y_min = min(all_prices) - box_size
y_max = max(all_prices) + box_size
y_labels = list(np.arange(y_min, y_max + box_size, box_size))

# Style
custom_style = Style(
    background=PAGE_BG,
    plot_background=PAGE_BG,
    foreground=INK,
    foreground_strong=INK,
    foreground_subtle=INK_MUTED,
    colors=IMPRINT,
    title_font_size=66,
    label_font_size=56,
    major_label_font_size=44,
    legend_font_size=44,
    value_font_size=36,
    stroke_width=3,
)

# Plot — no chart-level stroke setting so per-series stroke works correctly
chart = pygal.XY(
    width=3200,
    height=1800,
    style=custom_style,
    title="point-and-figure-basic · python · pygal · anyplot.ai",
    show_legend=True,
    legend_at_bottom=True,
    legend_at_bottom_columns=4,
    show_y_guides=True,
    show_x_guides=False,
    x_title="Column (Reversal)",
    y_title="Price ($)",
    margin=80,
    margin_bottom=200,
    margin_left=220,
    margin_top=120,
    margin_right=100,
    y_labels=y_labels,
    range=(y_min, y_max),
    dots_size=18,
)

# Build X and O data points
x_points = []
o_points = []

for col_idx, (start, end, direction) in enumerate(columns):
    low = min(start, end)
    high = max(start, end)
    price_levels = np.arange(low, high + box_size * 0.5, box_size)
    if direction == "X":
        x_points.extend((col_idx, lv) for lv in price_levels)
    else:
        o_points.extend((col_idx, lv) for lv in price_levels)

# Per-series stroke=False keeps dots unconnected; overrides chart default
chart.add("X (Rising)", x_points, stroke=False)
chart.add("O (Falling)", o_points, stroke=False)

# Trend lines — per-series stroke=True draws the line
support_lows = [(ci, min(s, e)) for ci, (s, e, d) in enumerate(columns) if d == "O"]
resistance_highs = [(ci, max(s, e)) for ci, (s, e, d) in enumerate(columns) if d == "X"]

if len(support_lows) >= 2:
    c0, p0 = support_lows[0]
    c1 = min(c0 + 6, len(columns) - 1)
    chart.add(
        "Support (45°)",
        [(c0, p0), (c1, p0 + (c1 - c0) * box_size)],
        stroke=True,
        dots_size=4,
        stroke_style={"width": 4, "dasharray": "8, 6"},
    )

if len(resistance_highs) >= 2:
    c0, p0 = resistance_highs[0]
    c1 = min(c0 + 6, len(columns) - 1)
    chart.add(
        "Resistance (45°)",
        [(c0, p0), (c1, p0 - (c1 - c0) * box_size)],
        stroke=True,
        dots_size=4,
        stroke_style={"width": 4, "dasharray": "8, 6"},
    )


def add_pnf_text_markers(svg_bytes):
    """Post-process pygal SVG: hide circle markers for X/O series, add text characters."""
    SVG_NS = "http://www.w3.org/2000/svg"
    ET.register_namespace("", SVG_NS)
    ET.register_namespace("xlink", "http://www.w3.org/1999/xlink")

    root = ET.fromstring(svg_bytes)
    parent_map = {child: parent for parent in root.iter() for child in parent}

    # serie-0 = X (Rising), serie-1 = O (Falling)
    series_symbols = {0: ("X", IMPRINT[0]), 1: ("O", IMPRINT[1])}

    for serie_idx, (symbol, color) in series_symbols.items():
        for g in root.iter(f"{{{SVG_NS}}}g"):
            parts = g.get("class", "").split()
            if "series" not in parts or f"serie-{serie_idx}" not in parts:
                continue
            for circle in g.iter(f"{{{SVG_NS}}}circle"):
                cx = circle.get("cx")
                cy = circle.get("cy")
                if cx is None or cy is None:
                    continue
                # Hide circle; leave in DOM so hover tooltips still work in HTML
                circle.set("opacity", "0")
                # Add literal X or O text at the same position
                text = ET.Element(f"{{{SVG_NS}}}text")
                text.set("x", cx)
                text.set("y", cy)
                text.set("text-anchor", "middle")
                text.set("dominant-baseline", "central")
                text.set("font-size", "36")
                text.set("font-weight", "bold")
                text.set("fill", color)
                text.set("font-family", "monospace, sans-serif")
                text.text = symbol
                parent_map[circle].append(text)

    return ET.tostring(root, encoding="unicode").encode("utf-8")


# Render SVG, post-process to replace circle markers with X/O text, then save
svg_original = chart.render()
svg_modified = add_pnf_text_markers(svg_original)

# PNG — from modified SVG with X/O text characters
with open(f"plot-{THEME}.png", "wb") as f:
    cairosvg.svg2png(bytestring=svg_modified, write_to=f)

# HTML — modified SVG (X/O text visible; hidden circles retain hover interaction)
with open(f"plot-{THEME}.html", "wb") as f:
    f.write(svg_modified)
Runnable source as JSON, for any HTTP client: https://api.anyplot.ai/specs/point-and-figure-basic/pygal/code. Any spec id and library id listed in llms-full.txt fit the same URL shape; every URL below is complete and callable.
{
  "spec_id": "point-and-figure-basic",
  "language": "python",
  "library": "pygal",
  "page": "https://anyplot.ai/point-and-figure-basic/python/pygal",
  "hub": "https://anyplot.ai/point-and-figure-basic",
  "code_json": "https://api.anyplot.ai/specs/point-and-figure-basic/pygal/code",
  "spec_json": "https://api.anyplot.ai/specs/point-and-figure-basic",
  "render_light_png": "https://storage.googleapis.com/anyplot-images/plots/point-and-figure-basic/python/pygal/plot-light.png",
  "render_dark_png": "https://storage.googleapis.com/anyplot-images/plots/point-and-figure-basic/python/pygal/plot-dark.png",
  "interactive_light_html": "https://storage.googleapis.com/anyplot-images/plots/point-and-figure-basic/python/pygal/plot-light.html",
  "interactive_dark_html": "https://storage.googleapis.com/anyplot-images/plots/point-and-figure-basic/python/pygal/plot-dark.html",
  "quality_score": 86.0,
  "license": "MIT",
  "guide": "https://anyplot.ai/llms.txt"
}
Part of Point and Figure Chart on anyplot.ai.