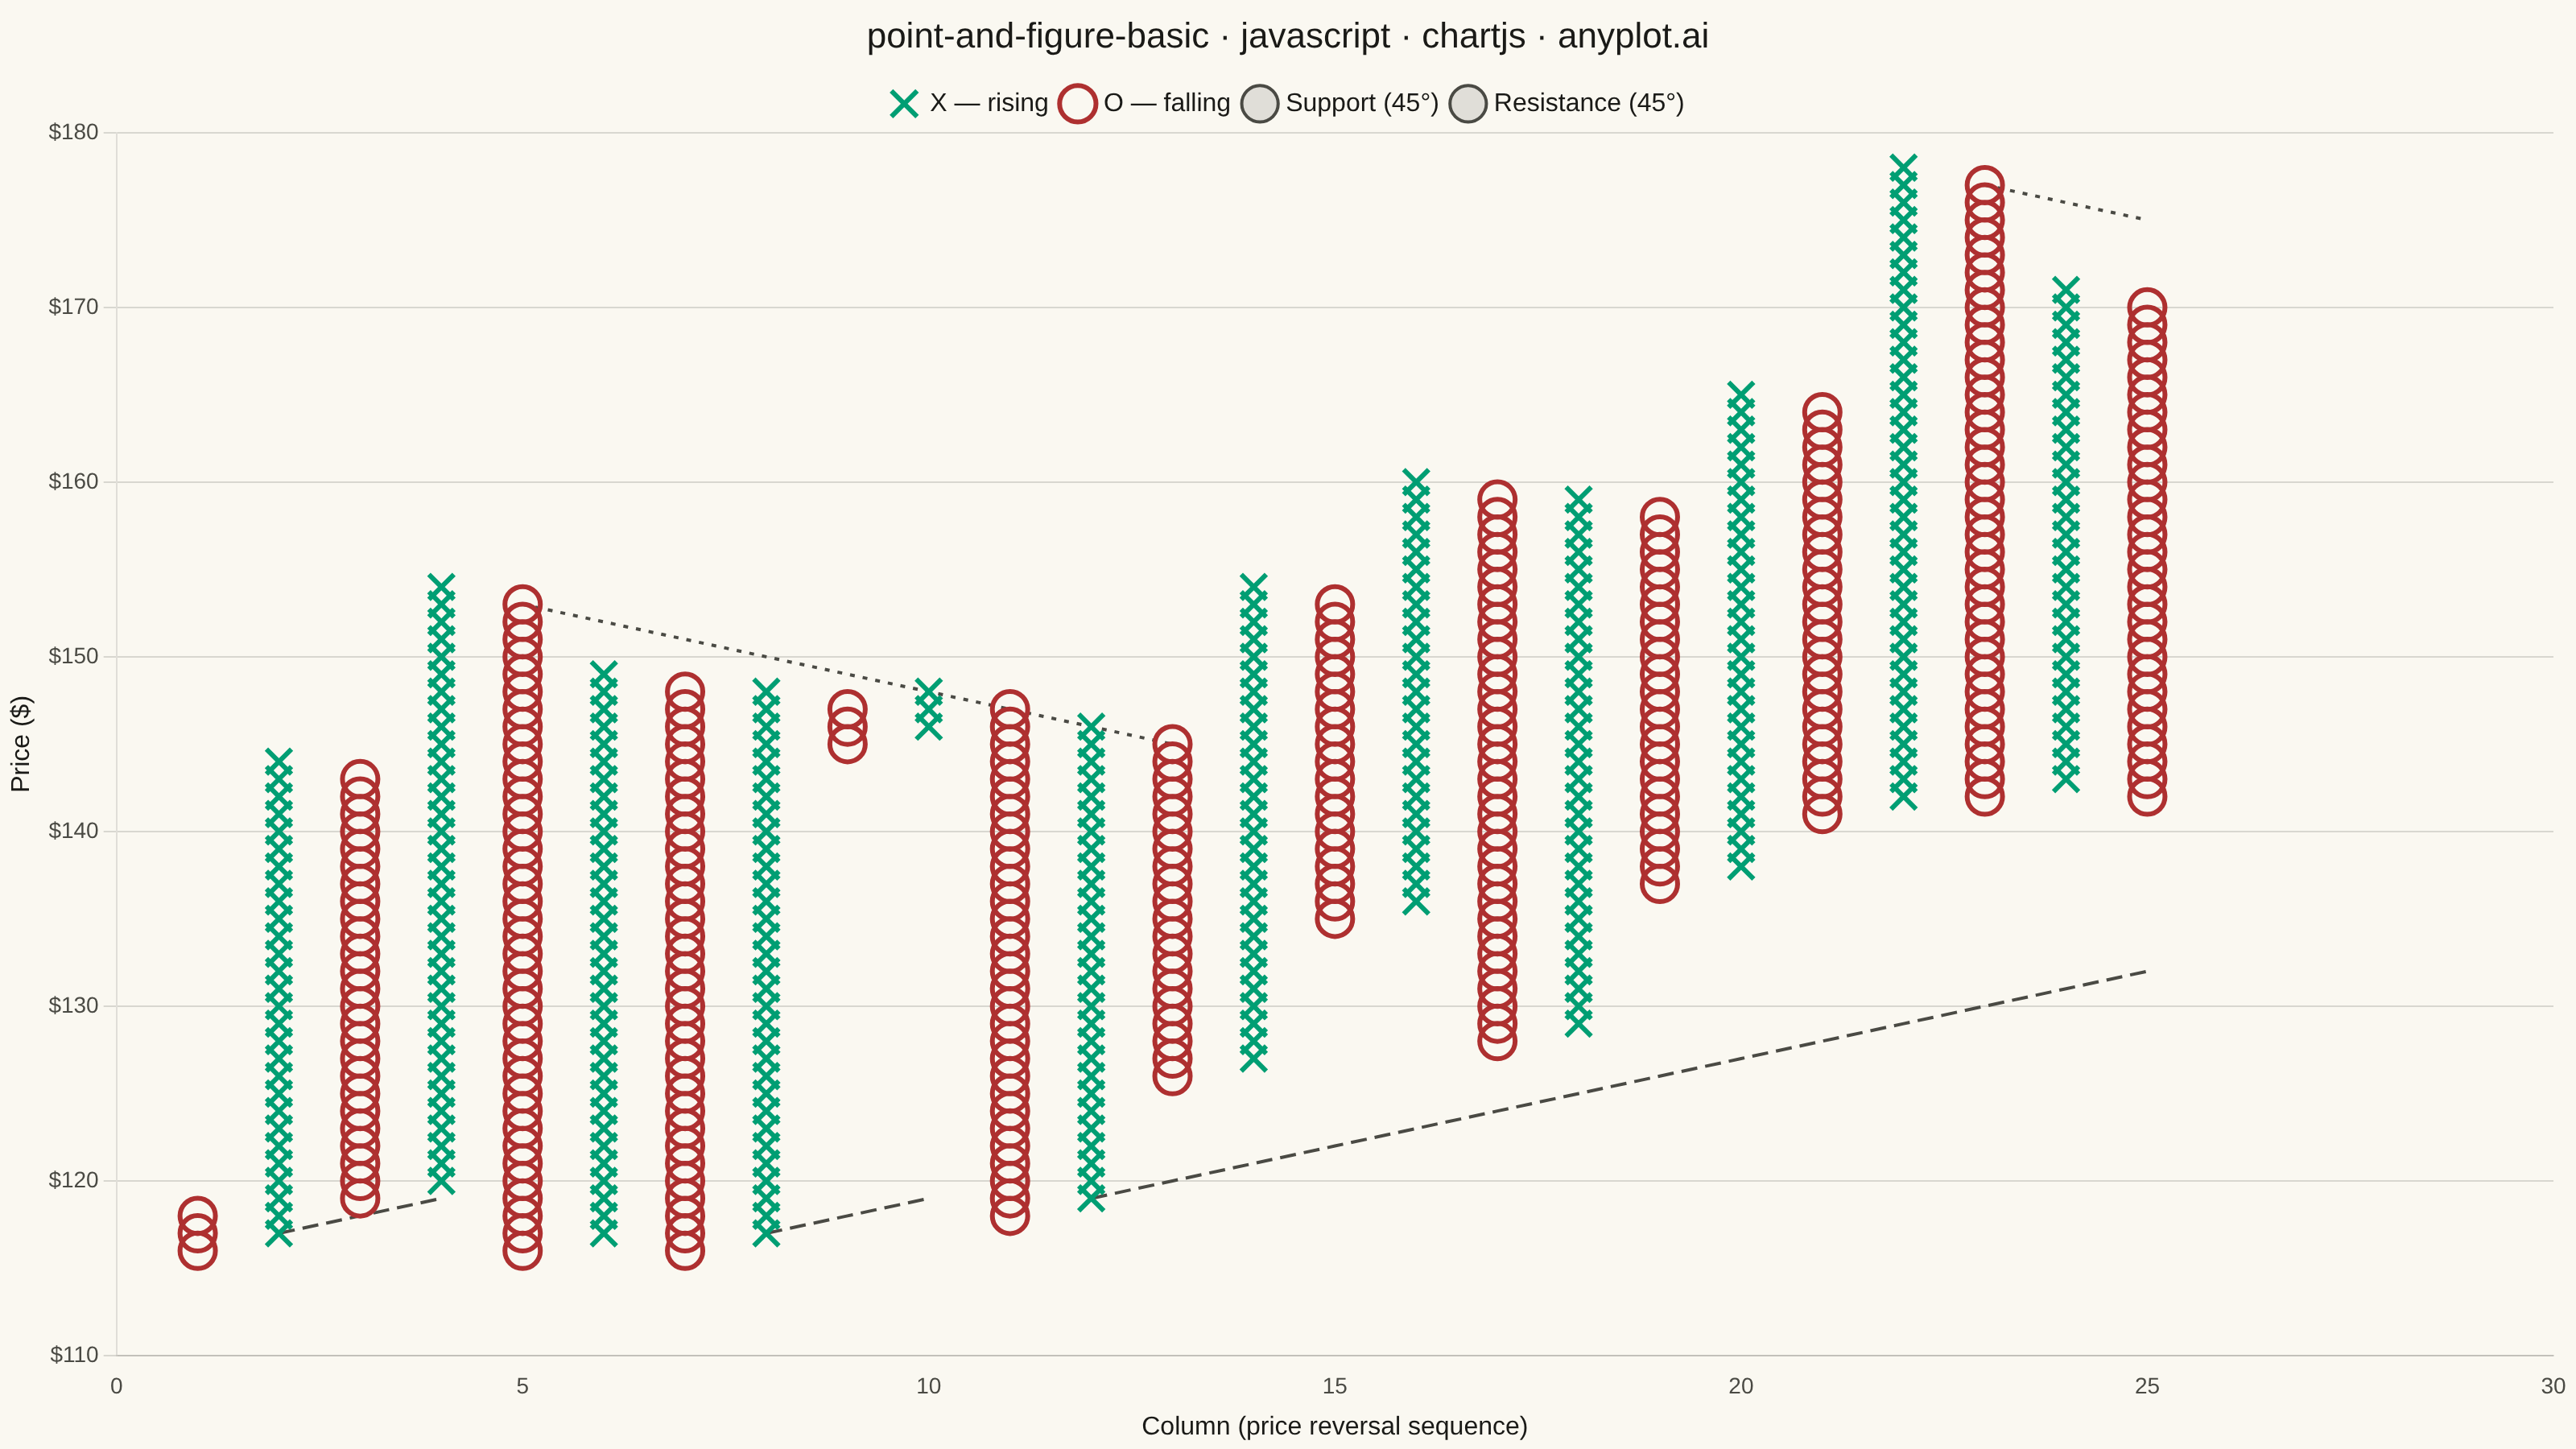
The same plot in 14 other libraries — JavaScript: D3.js, Apache ECharts, Highcharts, MUI X Charts; Python: Altair, Bokeh, lets-plot, Matplotlib, Plotly, plotnine, Pygal, Seaborn; R: ggplot2; Julia: Makie.jl. Compare all 15 side by side: Point and Figure Chart in Python, R, Julia and JavaScript.
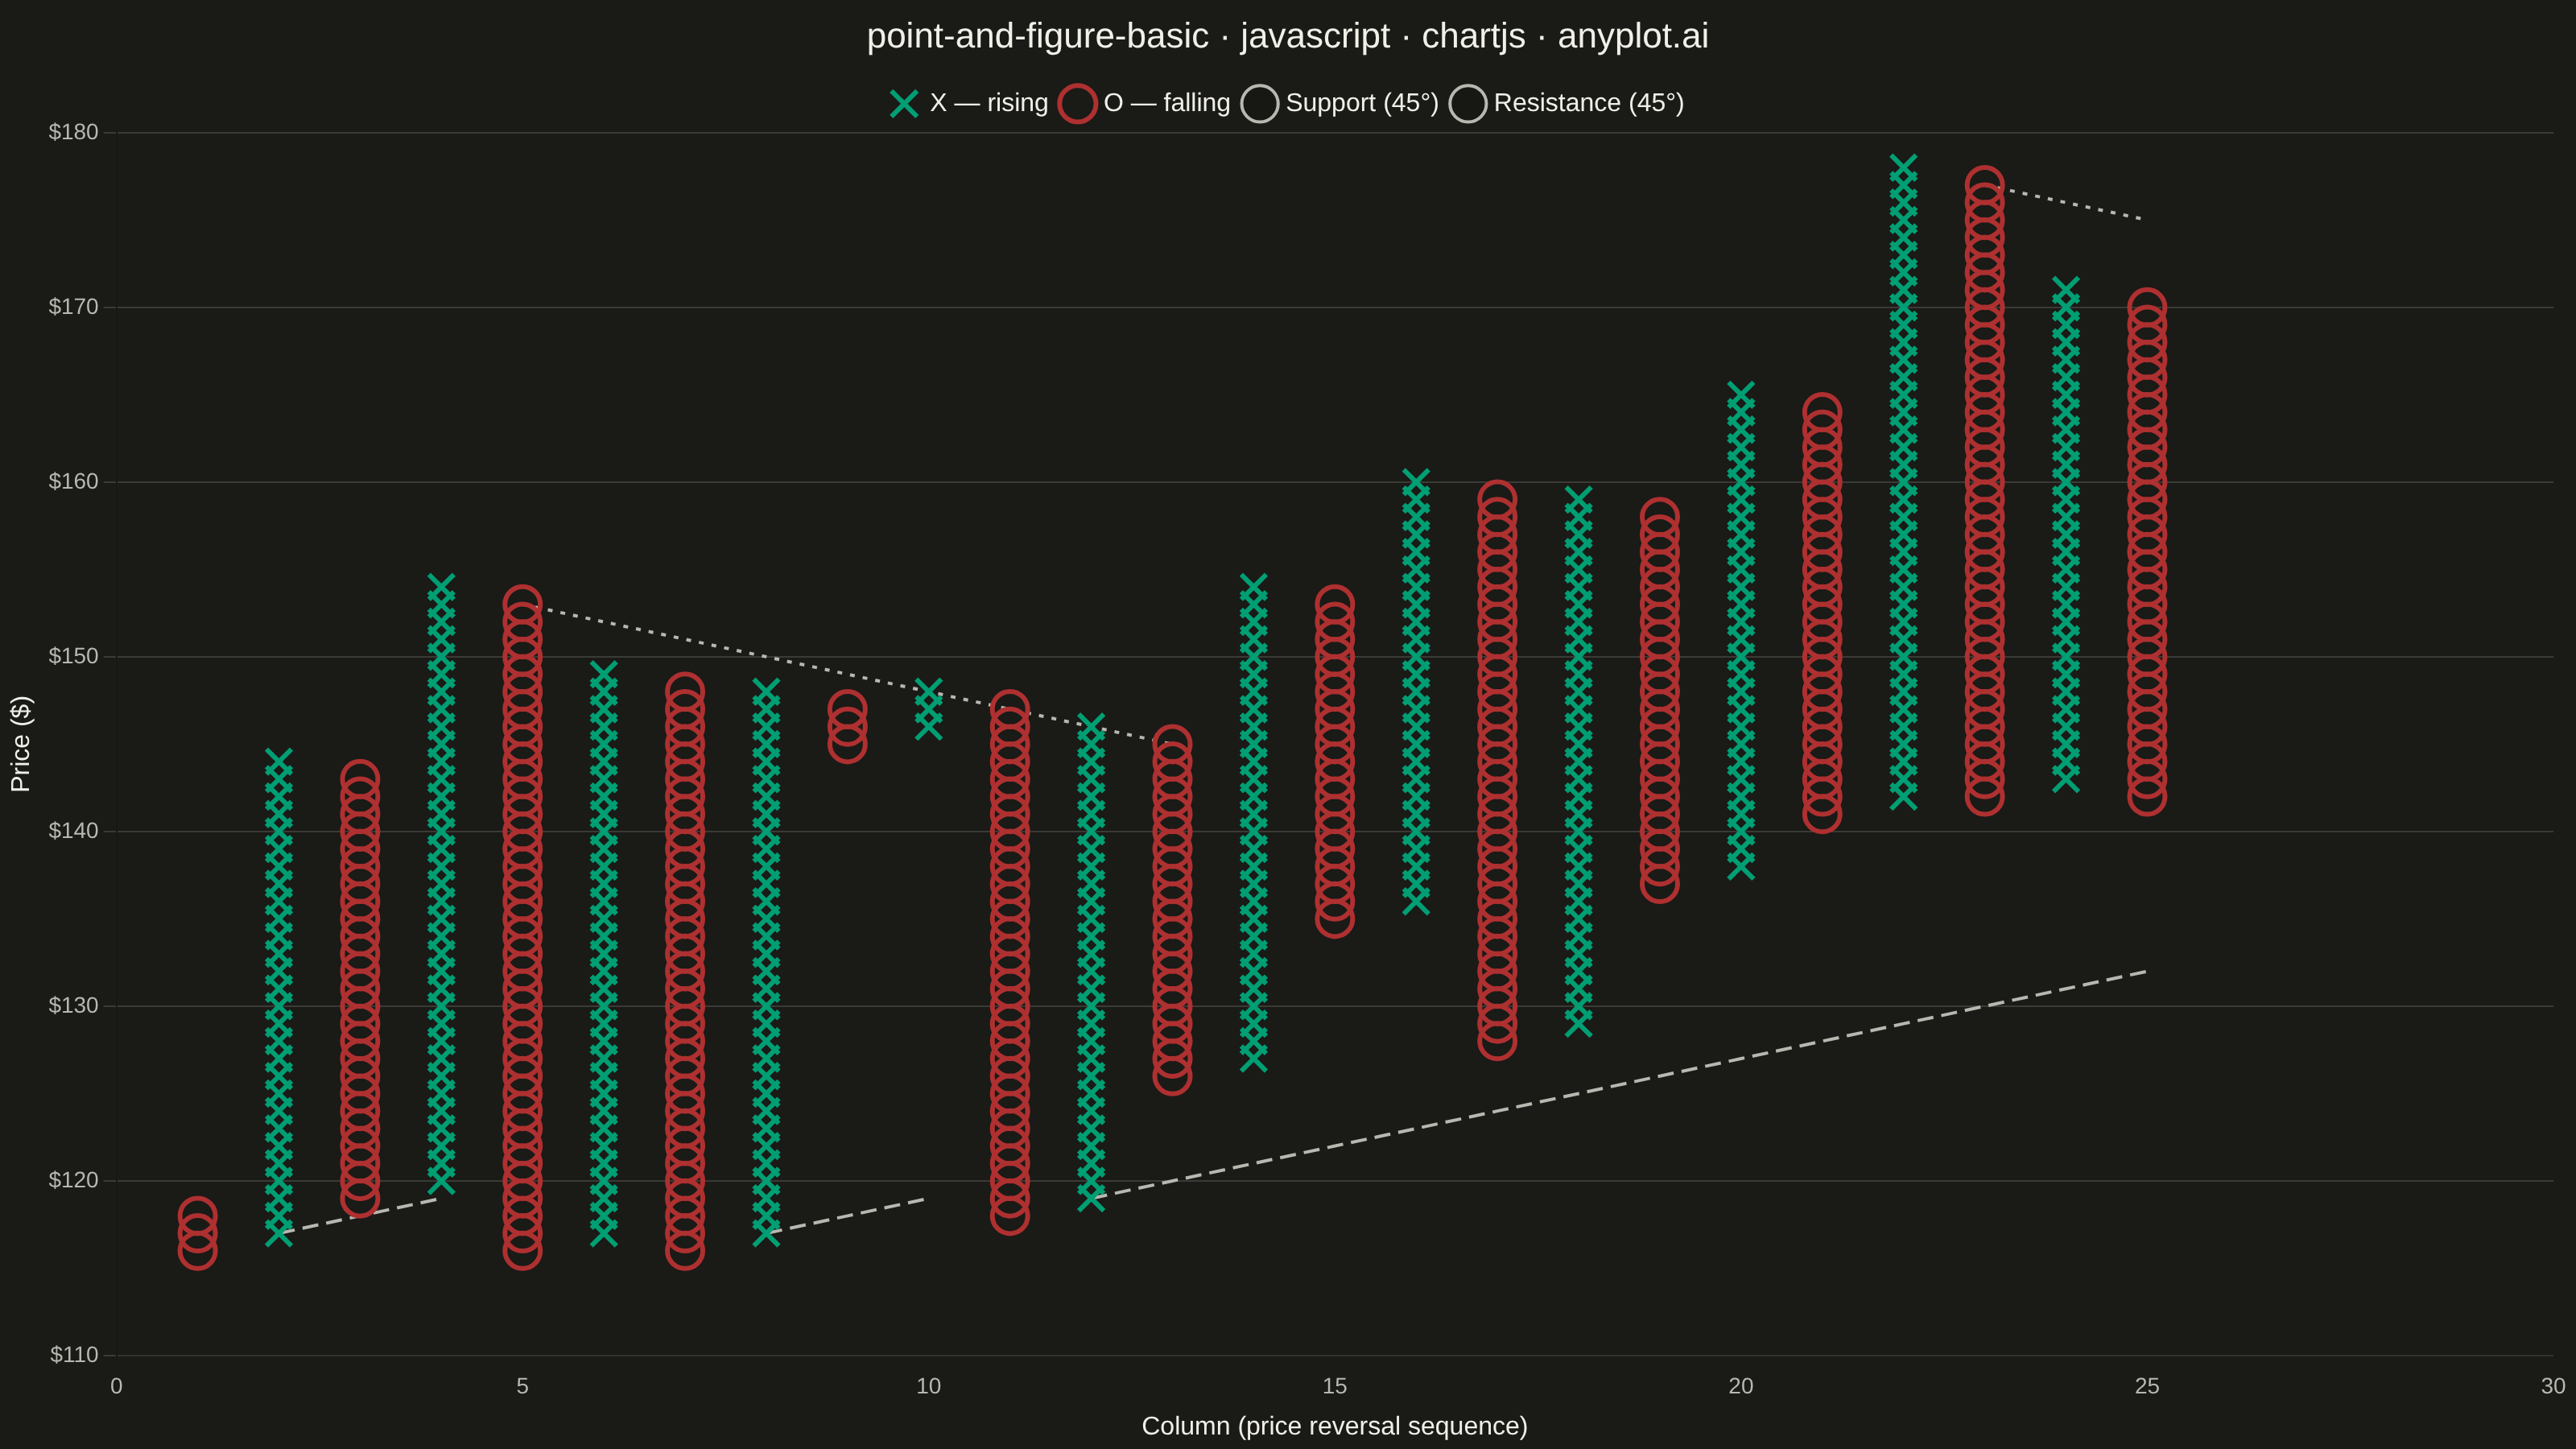
A Point and Figure (P&F) chart is a price-action focused visualization that uses columns of X's (rising prices) and O's (falling prices) to display significant price movements while filtering out time and minor fluctuations. Unlike traditional time-based charts, P&F charts only plot a new symbol when price moves by a defined box size, and only start a new column when price reverses by a specified number of boxes (typically 3). This makes it ideal for identifying clear trends, support/resistance levels, and generating trading signals.
// anyplot.ai
// point-and-figure-basic: Point and Figure Chart
// Library: chartjs 4.4.7 | JavaScript 22.23.2
// Quality: 90/100 | Created: 2026-09-02

//# anyplot-orientation: landscape
const t = window.ANYPLOT_TOKENS;

// --- Data: synthetic daily close prices for a fictitious stock -------------
function lcg(seed) {
  let state = seed;
  return () => {
    state = (state * 1664525 + 1013904223) >>> 0;
    return state / 4294967296;
  };
}
const rand = lcg(42);

const numDays = 300; // ~14 trading months
const closes = [118];
for (let day = 1; day < numDays; day++) {
  const macroTrend = Math.sin((day / numDays) * Math.PI * 22) * 3.2;
  const dailyNoise = (rand() - 0.5) * 5.0;
  const next = closes[day - 1] + macroTrend + dailyNoise;
  closes.push(Math.max(70, next));
}

// --- Point and Figure construction (close-based, 3-box reversal) -----------
const boxSize = 1; // $1 per box
const reversalBoxes = 3; // classic 3-box reversal method
const boxIndexOf = (price) => Math.floor(price / boxSize);

let direction = 0; // 0 = undetermined, 1 = X column, -1 = O column
let colTop = boxIndexOf(closes[0]);
let colBottom = colTop;
const columns = [];

for (let i = 1; i < closes.length; i++) {
  const idx = boxIndexOf(closes[i]);

  if (direction === 0) {
    if (idx > colTop) {
      direction = 1;
      colTop = idx;
    } else if (idx < colBottom) {
      direction = -1;
      colBottom = idx;
    }
    continue;
  }

  if (direction === 1) {
    if (idx > colTop) {
      colTop = idx;
    } else if (idx <= colTop - reversalBoxes) {
      columns.push({ dir: 1, top: colTop, bottom: colBottom });
      direction = -1;
      colBottom = idx;
      colTop = colTop - 1;
    }
  } else {
    if (idx < colBottom) {
      colBottom = idx;
    } else if (idx >= colBottom + reversalBoxes) {
      columns.push({ dir: -1, top: colTop, bottom: colBottom });
      direction = 1;
      colTop = idx;
      colBottom = colBottom + 1;
    }
  }
}
columns.push({ dir: direction || 1, top: colTop, bottom: colBottom });

// --- Flatten columns into per-box scatter points ----------------------------
const risingBoxes = [];
const fallingBoxes = [];
columns.forEach((col, colIndex) => {
  for (let box = col.bottom; box <= col.top; box++) {
    const point = { x: colIndex + 1, y: box * boxSize };
    if (col.dir === 1) risingBoxes.push(point);
    else fallingBoxes.push(point);
  }
});

// --- Support / resistance 45-degree trend lines -----------------------------
// Classic P&F construction: a support (resistance) line starts at the box low
// (high) of the first rising (falling) column reached, then advances exactly
// one box per column — the "45-degree" slope the spec calls for — until a
// later column's box range breaks through it. The next rising/falling column
// then starts a fresh line, so trends are shown as a series of segments.
function buildTrendSegments(colDir, boundaryOf, slopeSign) {
  const segments = [];
  let seg = null;
  const startSegment = (colX, col) => ({
    startCol: colX,
    startVal: boundaryOf(col),
    points: [{ x: colX, y: boundaryOf(col) * boxSize }],
  });

  columns.forEach((col, i) => {
    const colX = i + 1;
    if (!seg) {
      if (col.dir === colDir) seg = startSegment(colX, col);
      return;
    }

    const projected = seg.startVal + slopeSign * (colX - seg.startCol);
    const broken = slopeSign > 0 ? boundaryOf(col) < projected : boundaryOf(col) > projected;
    if (broken) {
      if (seg.points.length > 1) segments.push(seg.points);
      seg = col.dir === colDir ? startSegment(colX, col) : null;
    } else {
      seg.points.push({ x: colX, y: projected * boxSize });
    }
  });
  if (seg && seg.points.length > 1) segments.push(seg.points);
  return segments;
}

// Merge segments into a single dataset, breaking the line between segments
// with a NaN point (spanGaps: false keeps the gap from being connected).
const withGaps = (segments) =>
  segments.flatMap((seg, i) => (i === 0 ? seg : [{ x: seg[0].x, y: NaN }, ...seg]));

const supportPoints = withGaps(buildTrendSegments(1, (col) => col.bottom, 1));
const resistancePoints = withGaps(buildTrendSegments(-1, (col) => col.top, -1));

// --- Mount -------------------------------------------------------------------
const canvas = document.createElement("canvas");
document.getElementById("container").appendChild(canvas);

// --- Chart ---------------------------------------------------------------------
const datasets = [
  {
    label: "X — rising",
    data: risingBoxes,
    pointStyle: "crossRot",
    pointRadius: 11,
    pointBorderWidth: 3,
    pointBorderColor: t.palette[0],
    pointBackgroundColor: t.palette[0],
    showLine: false,
  },
  {
    label: "O — falling",
    data: fallingBoxes,
    pointStyle: "circle",
    pointRadius: 11,
    pointBorderWidth: 3,
    pointBorderColor: t.palette[4],
    pointBackgroundColor: "transparent",
    showLine: false,
  },
];
if (supportPoints.length) {
  datasets.push({
    label: "Support (45°)",
    data: supportPoints,
    showLine: true,
    spanGaps: false,
    fill: false,
    borderColor: t.inkSoft,
    borderWidth: 2,
    borderDash: [10, 5],
    pointRadius: 0,
  });
}
if (resistancePoints.length) {
  datasets.push({
    label: "Resistance (45°)",
    data: resistancePoints,
    showLine: true,
    spanGaps: false,
    fill: false,
    borderColor: t.inkSoft,
    borderWidth: 2,
    borderDash: [3, 5],
    pointRadius: 0,
  });
}

new Chart(canvas, {
  type: "scatter",
  data: { datasets },
  options: {
    responsive: true,
    maintainAspectRatio: false,
    animation: false,
    plugins: {
      title: {
        display: true,
        text: "point-and-figure-basic · javascript · chartjs · anyplot.ai",
        color: t.ink,
        font: { size: 22, weight: "500" },
      },
      legend: {
        labels: { color: t.ink, font: { size: 16 }, usePointStyle: true },
      },
    },
    scales: {
      x: {
        type: "linear",
        min: 0,
        suggestedMax: columns.length + 1,
        ticks: { color: t.inkSoft, font: { size: 14 } },
        grid: { display: false },
        title: {
          display: true,
          text: "Column (price reversal sequence)",
          color: t.ink,
          font: { size: 16 },
        },
      },
      y: {
        ticks: {
          stepSize: 10,
          color: t.inkSoft,
          font: { size: 14 },
          callback: (value) => `$${value}`,
        },
        grid: { color: t.grid },
        title: { display: true, text: "Price ($)", color: t.ink, font: { size: 16 } },
      },
    },
  },
});
Runnable source as JSON, for any HTTP client: https://api.anyplot.ai/specs/point-and-figure-basic/chartjs/code. Any spec id and library id listed in llms-full.txt fit the same URL shape; every URL below is complete and callable.
{
  "spec_id": "point-and-figure-basic",
  "language": "javascript",
  "library": "chartjs",
  "page": "https://anyplot.ai/point-and-figure-basic/javascript/chartjs",
  "hub": "https://anyplot.ai/point-and-figure-basic",
  "code_json": "https://api.anyplot.ai/specs/point-and-figure-basic/chartjs/code",
  "spec_json": "https://api.anyplot.ai/specs/point-and-figure-basic",
  "render_light_png": "https://storage.googleapis.com/anyplot-images/plots/point-and-figure-basic/javascript/chartjs/plot-light.png",
  "render_dark_png": "https://storage.googleapis.com/anyplot-images/plots/point-and-figure-basic/javascript/chartjs/plot-dark.png",
  "interactive_light_html": "https://storage.googleapis.com/anyplot-images/plots/point-and-figure-basic/javascript/chartjs/plot-light.html",
  "interactive_dark_html": "https://storage.googleapis.com/anyplot-images/plots/point-and-figure-basic/javascript/chartjs/plot-dark.html",
  "quality_score": 90.0,
  "license": "MIT",
  "guide": "https://anyplot.ai/llms.txt"
}
Part of Point and Figure Chart on anyplot.ai.