The same plot in 14 other libraries — JavaScript: Chart.js, D3.js, Apache ECharts, MUI X Charts; Python: Altair, Bokeh, lets-plot, Matplotlib, Plotly, plotnine, Pygal, Seaborn; R: ggplot2; Julia: Makie.jl. Compare all 15 side by side: Point and Figure Chart in Python, R, Julia and JavaScript.
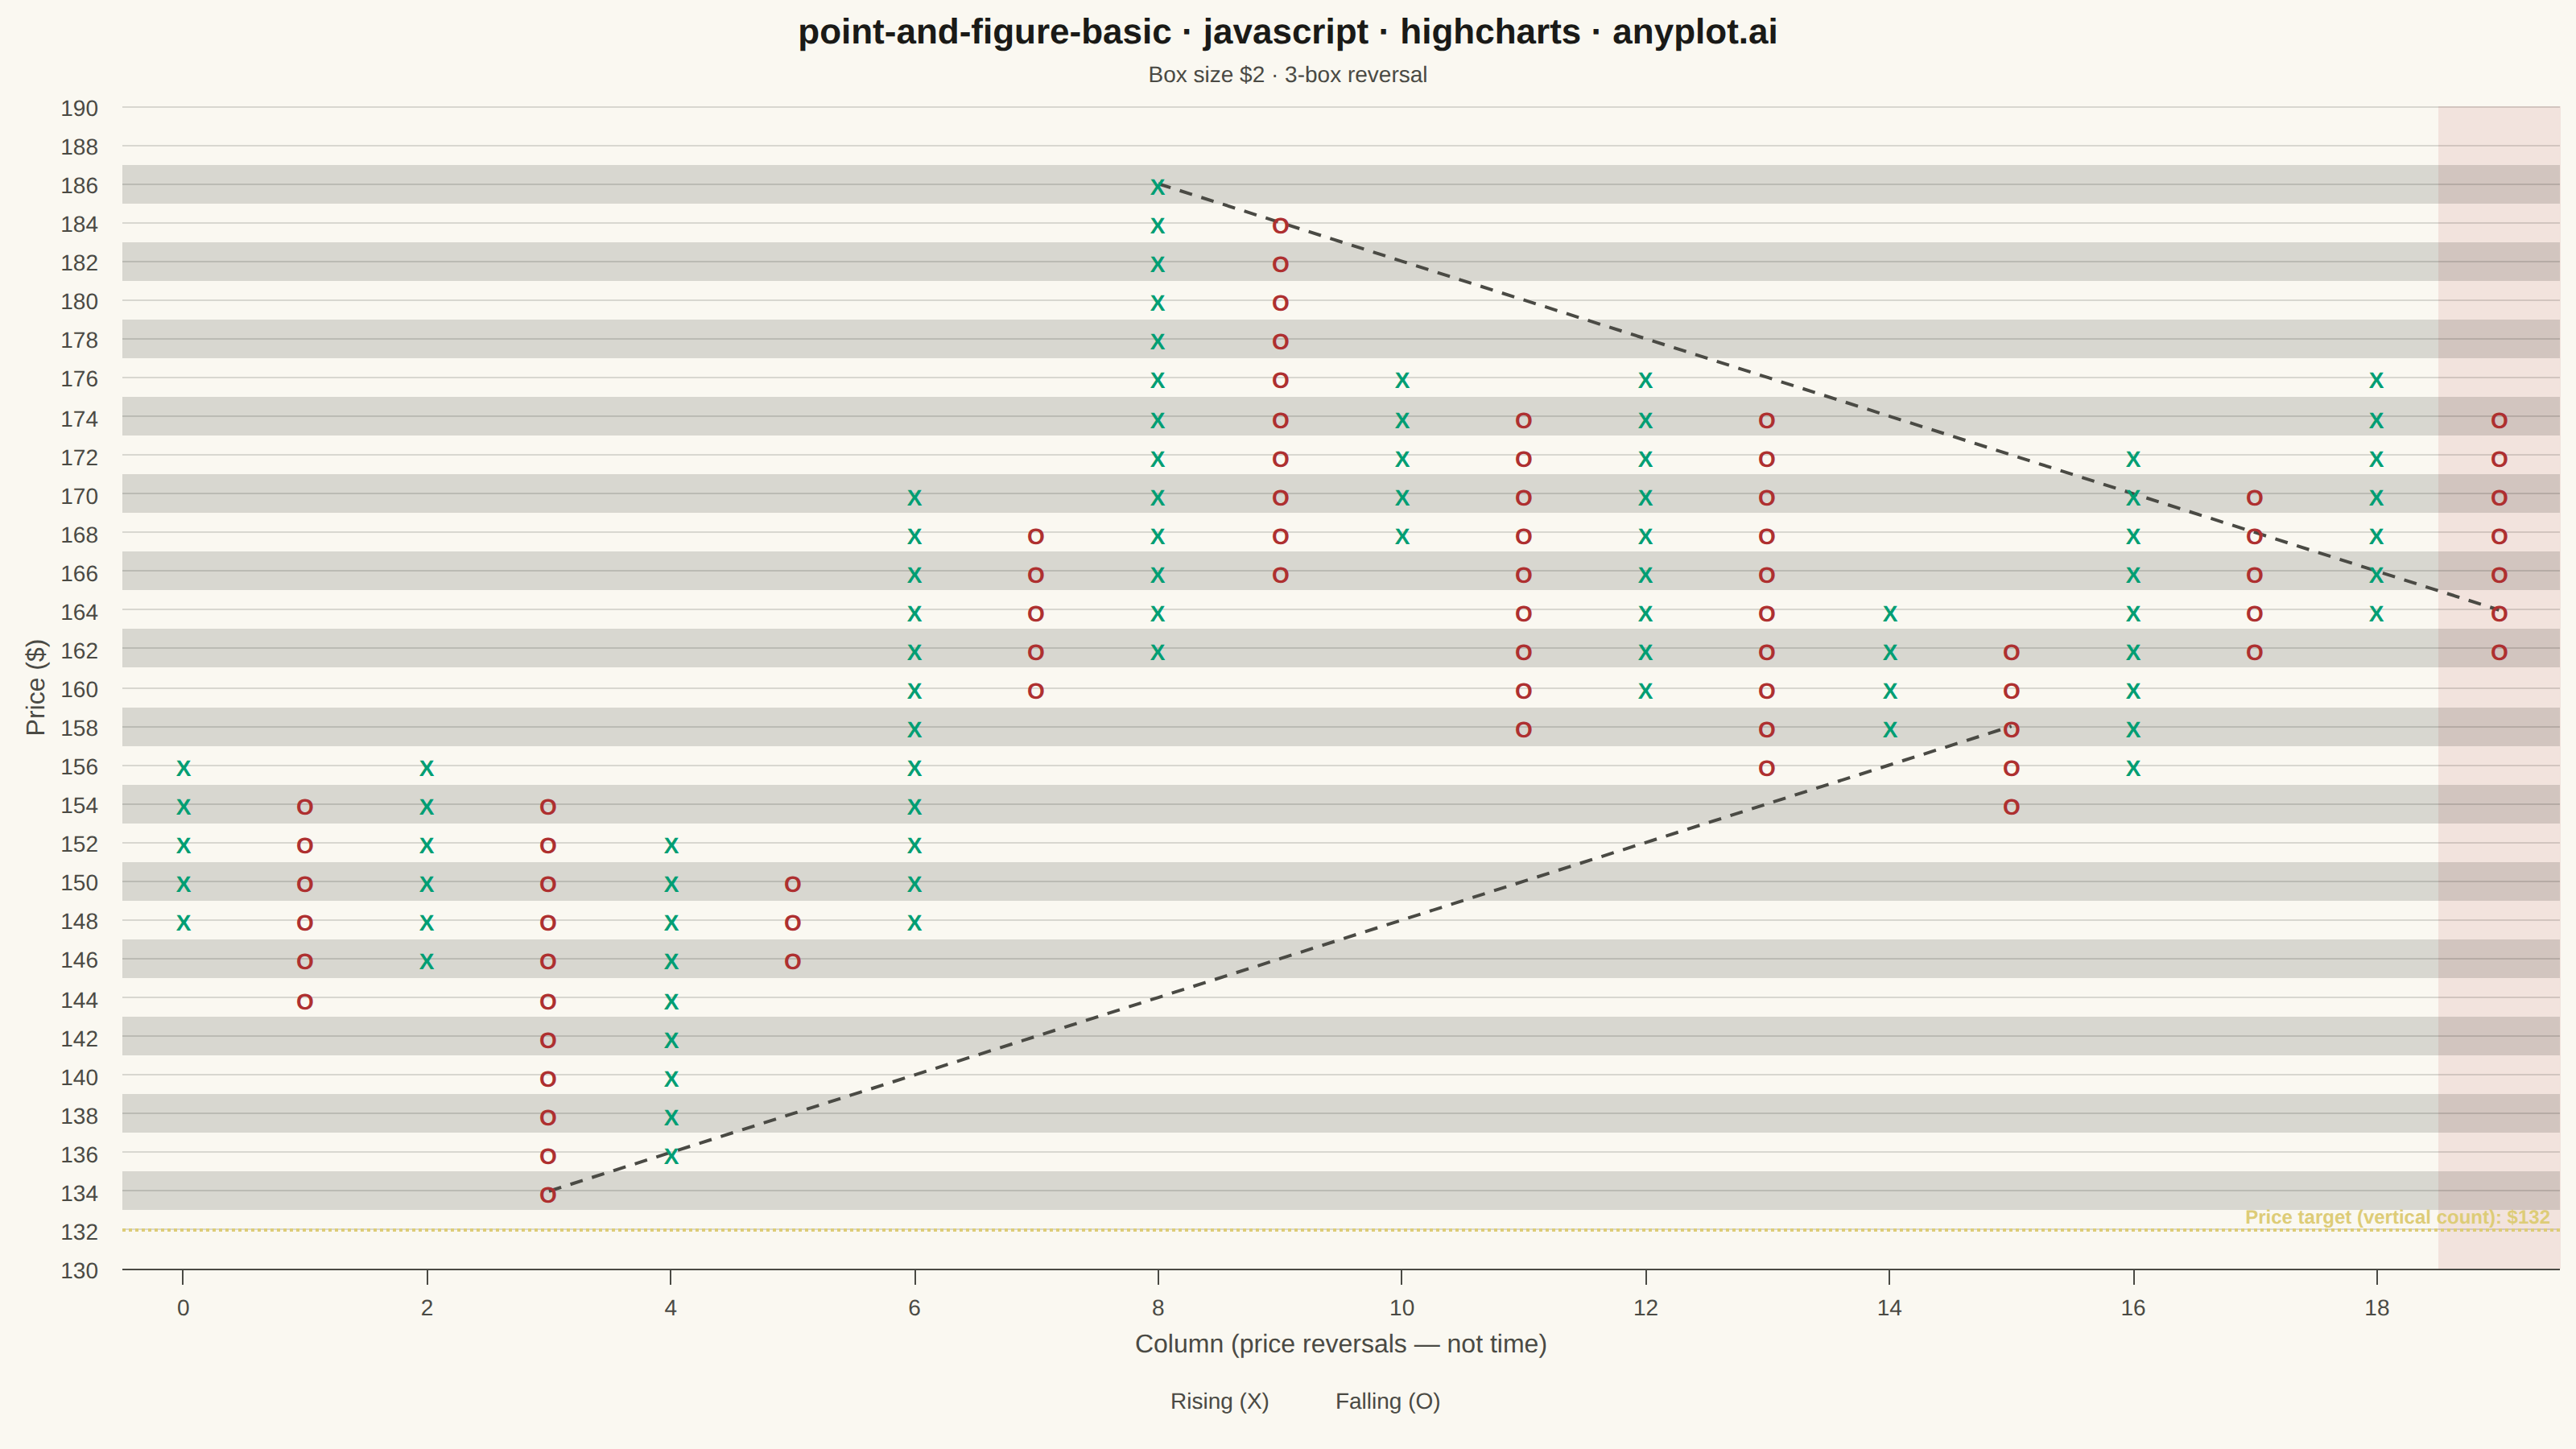
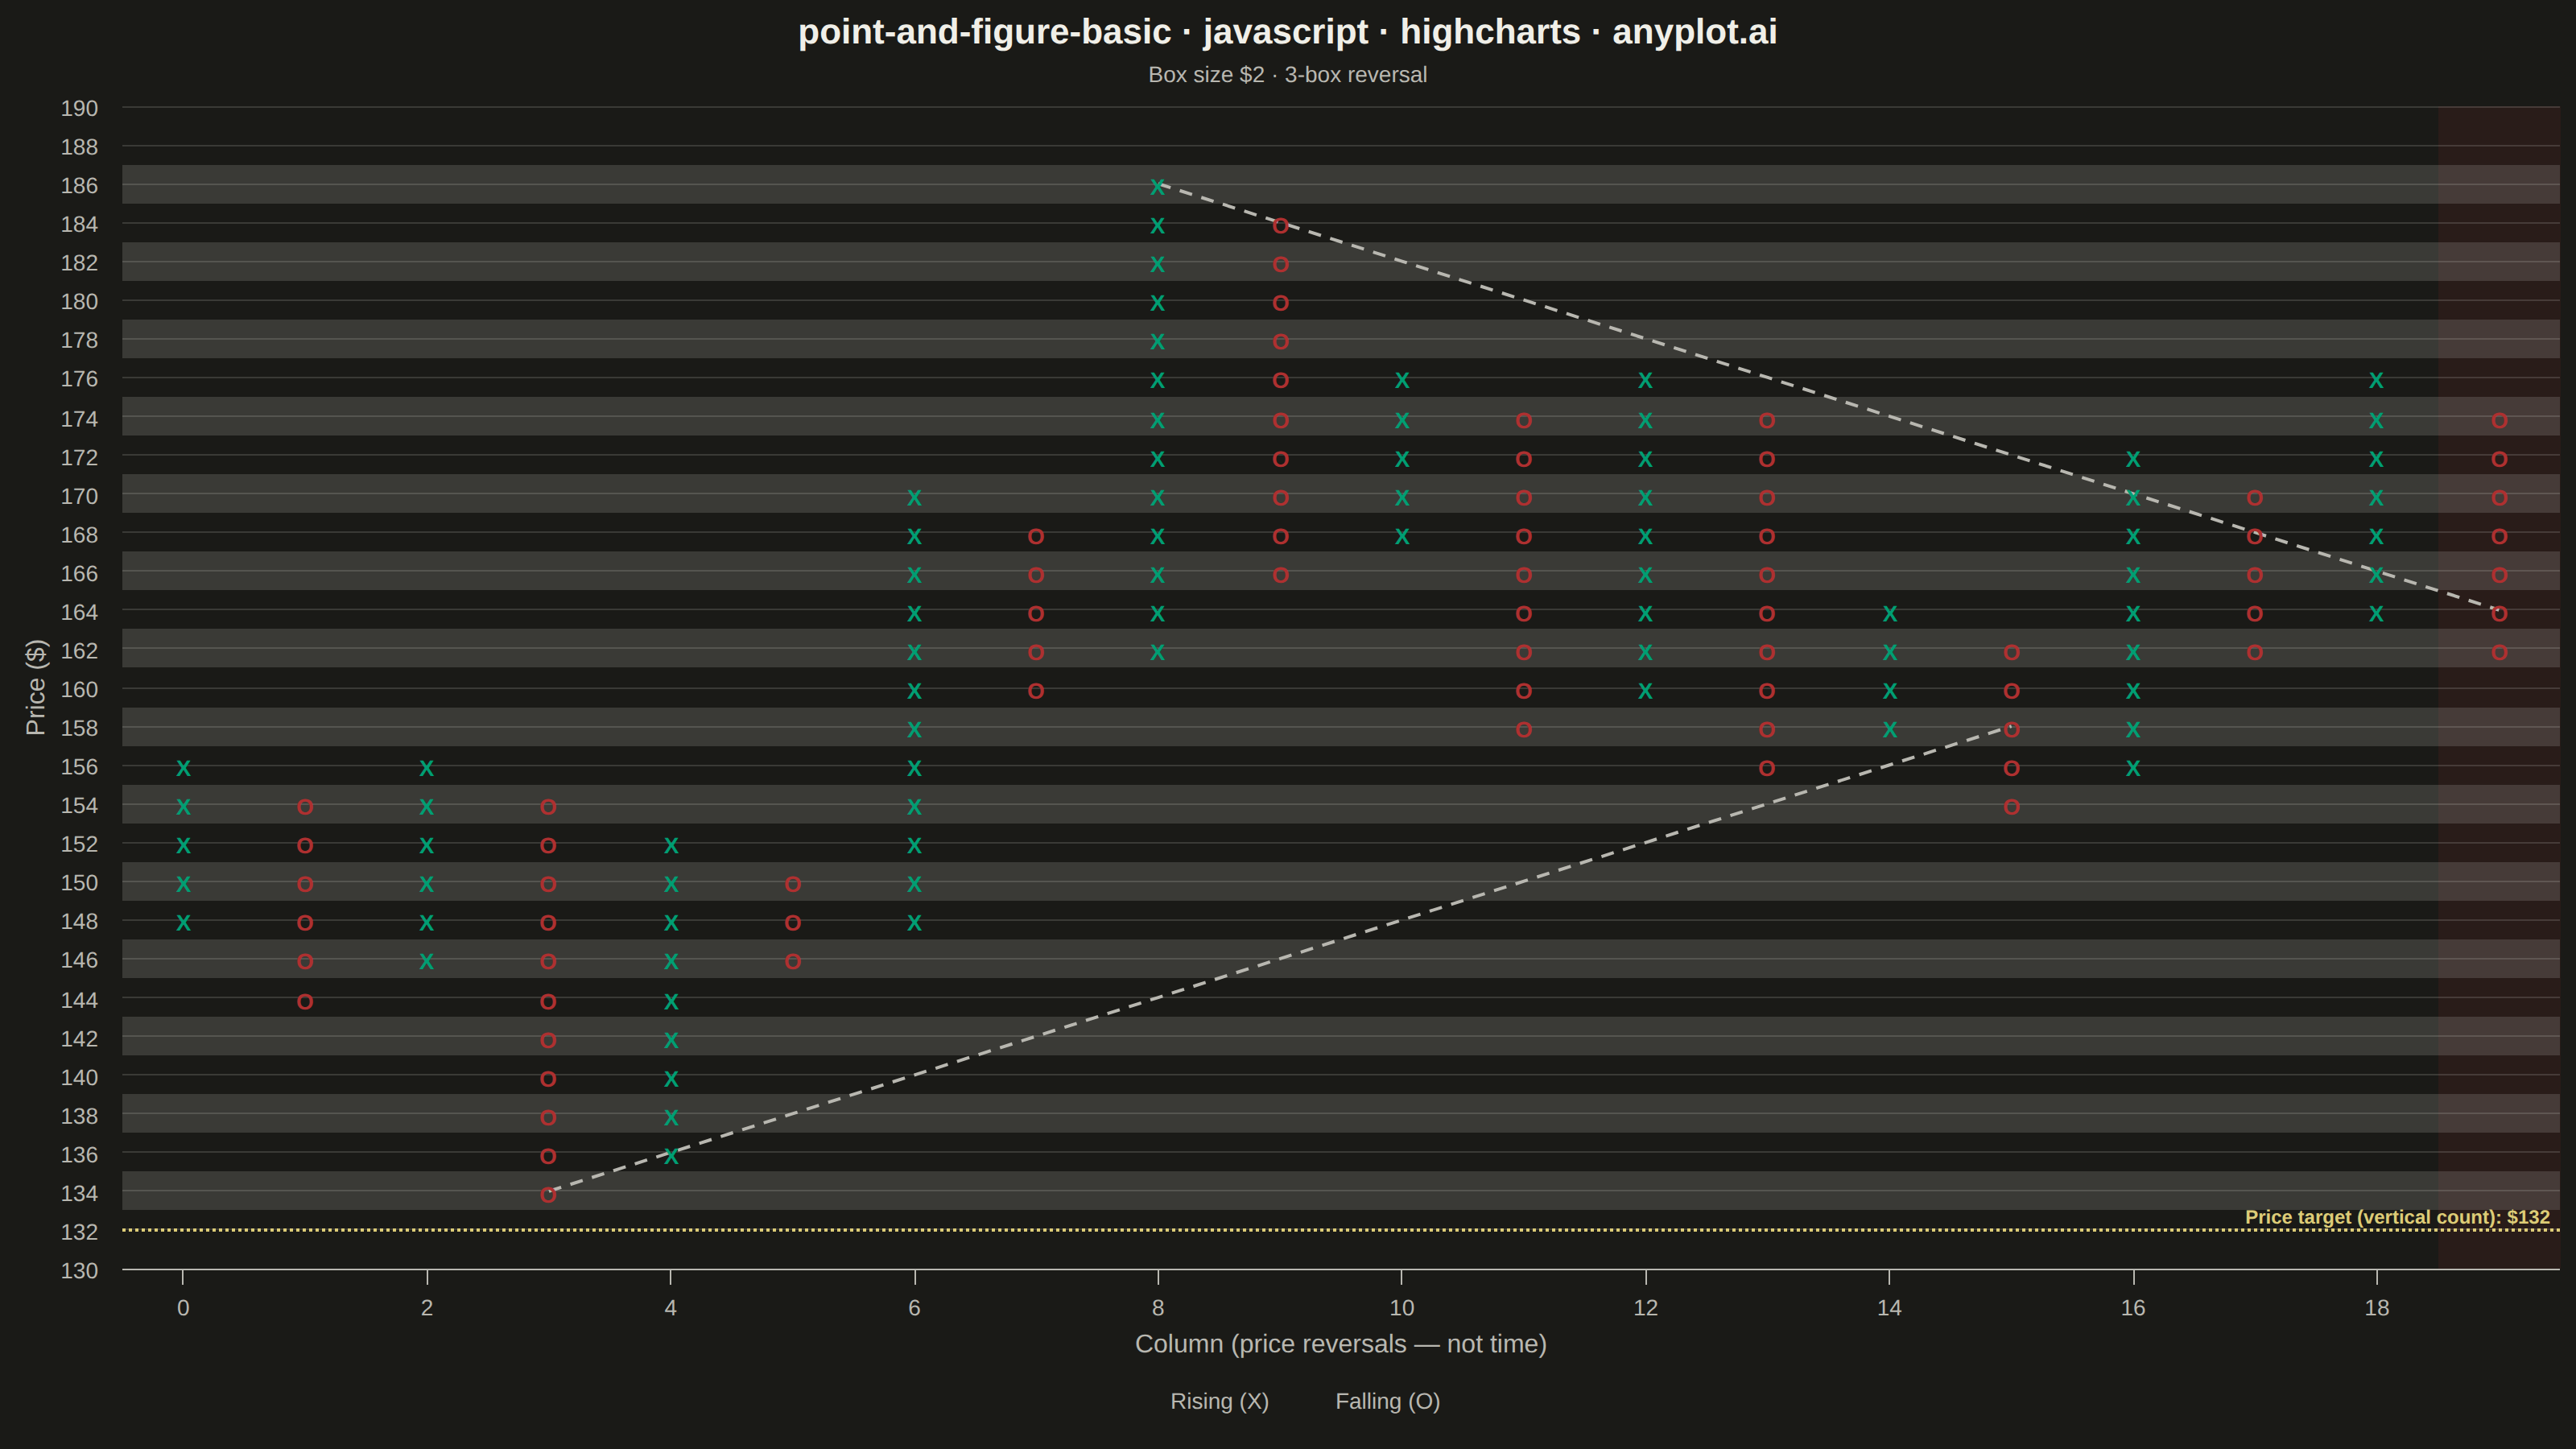
A Point and Figure (P&F) chart is a price-action focused visualization that uses columns of X's (rising prices) and O's (falling prices) to display significant price movements while filtering out time and minor fluctuations. Unlike traditional time-based charts, P&F charts only plot a new symbol when price moves by a defined box size, and only start a new column when price reverses by a specified number of boxes (typically 3). This makes it ideal for identifying clear trends, support/resistance levels, and generating trading signals.
// anyplot.ai
// point-and-figure-basic: Point and Figure Chart
// Library: highcharts 12.6.0 | JavaScript 22.23.2
// Quality: 95/100 | Created: 2026-09-02

const t = window.ANYPLOT_TOKENS;

// --- Data: synthetic daily closes over ~1 trading year (deterministic LCG) -
function lcg(seed) {
  let state = seed;
  return function rand() {
    state = (state * 1664525 + 1013904223) % 4294967296;
    return state / 4294967296;
  };
}
const rand = lcg(42);

// Short alternating-direction legs (strict sign flip each leg) so the box
// conversion below produces a genuine zigzag of many columns instead of one
// long trend per macro regime.
const NUM_LEGS = 20;
let dir = 1;
const segments = [];
for (let s = 0; s < NUM_LEGS; s++) {
  const days = 8 + Math.floor(rand() * 8); // 8-15 trading days per leg
  const magnitude = 0.7 + rand() * 0.9; // 0.7-1.6 drift per day
  segments.push({ days, drift: dir * magnitude, vol: 1.6 + rand() * 0.8 });
  dir *= -1;
}

let price = 148;
const closes = [];
segments.forEach(({ days, drift, vol }) => {
  for (let i = 0; i < days; i++) {
    price += drift + (rand() - 0.5) * vol;
    closes.push(Math.max(price, 5));
  }
});

// --- Point & figure box conversion (close-only, classic 1-box / 3-box rule) -
const BOX_SIZE = 2;
const REVERSAL_BOXES = 3;
const boxOf = (p) => Math.round(p / BOX_SIZE);

function buildColumns(prices) {
  const boxes = prices.map(boxOf);
  const columns = [];
  let direction = 0; // 0 undetermined, 1 = X column (rising), -1 = O column (falling)
  let currentBox = boxes[0];
  let column = { direction: 0, boxes: [currentBox] };

  for (let i = 1; i < boxes.length; i++) {
    const box = boxes[i];
    if (direction === 0) {
      if (box > currentBox) {
        for (let b = currentBox + 1; b <= box; b++) column.boxes.push(b);
        column.direction = 1;
        direction = 1;
        currentBox = box;
      } else if (box < currentBox) {
        for (let b = currentBox - 1; b >= box; b--) column.boxes.push(b);
        column.direction = -1;
        direction = -1;
        currentBox = box;
      }
    } else if (direction === 1) {
      if (box > currentBox) {
        for (let b = currentBox + 1; b <= box; b++) column.boxes.push(b);
        currentBox = box;
      } else if (box <= currentBox - REVERSAL_BOXES) {
        columns.push(column);
        column = { direction: -1, boxes: [] };
        for (let b = currentBox - 1; b >= box; b--) column.boxes.push(b);
        direction = -1;
        currentBox = box;
      }
    } else {
      if (box < currentBox) {
        for (let b = currentBox - 1; b >= box; b--) column.boxes.push(b);
        currentBox = box;
      } else if (box >= currentBox + REVERSAL_BOXES) {
        columns.push(column);
        column = { direction: 1, boxes: [] };
        for (let b = currentBox + 1; b <= box; b++) column.boxes.push(b);
        direction = 1;
        currentBox = box;
      }
    }
  }
  columns.push(column);
  return columns.filter((c) => c.boxes.length > 0);
}

const columns = buildColumns(closes);

// --- Series points: one scatter series per symbol; dataLabels ARE the glyph -
const xPoints = [];
const oPoints = [];
columns.forEach((col, colIndex) => {
  col.boxes.forEach((box) => {
    const point = [colIndex, box * BOX_SIZE];
    if (col.direction === 1) xPoints.push(point);
    else oPoints.push(point);
  });
});

// --- 45-degree support / resistance projections (1 box per column) ---------
let support = { col: 0, box: Infinity };
let resistance = { col: 0, box: -Infinity };
columns.forEach((col, colIndex) => {
  const low = Math.min(...col.boxes);
  const high = Math.max(...col.boxes);
  if (low < support.box) support = { col: colIndex, box: low };
  if (high > resistance.box) resistance = { col: colIndex, box: high };
});
const lastCol = columns.length - 1;
const span = Math.min(12, lastCol - Math.min(support.col, resistance.col));
const supportLine = Array.from({ length: span + 1 }, (_, i) => [support.col + i, (support.box + i) * BOX_SIZE]).filter(
  ([x]) => x <= lastCol,
);
const resistanceLine = Array.from({ length: span + 1 }, (_, i) => [
  resistance.col + i,
  (resistance.box - i) * BOX_SIZE,
]).filter(([x]) => x <= lastCol);

// --- Chart -------------------------------------------------------------------
// Semantic exception (default-style-guide.md): bullish/bearish reads as
// green/red to any trader, so X columns keep the brand green (palette
// position 1) and O columns use the matte-red semantic anchor rather than
// the next ordinal palette slot.
const RISING = t.palette[0];
const FALLING = "#AE3030";
const tickStep = Math.max(1, Math.ceil((lastCol + 1) / 15));

// --- Zebra row shading every other box: keeps dense columns (many stacked
// X/O glyphs at the box interval) reading as discrete symbols rather than a
// solid block, without shrinking the data-label font below VQ-01 comfort ---
const allBoxes = columns.flatMap((c) => c.boxes);
const minBoxAll = Math.min(...allBoxes);
const maxBoxAll = Math.max(...allBoxes);
const rowBands = [];
for (let b = minBoxAll; b <= maxBoxAll; b += 2) {
  rowBands.push({
    from: (b - 0.5) * BOX_SIZE,
    to: (b + 0.5) * BOX_SIZE,
    color: Highcharts.color(t.grid).setOpacity(0.15).get(),
  });
}

// --- Current reversal-zone highlight: shades the most recent column so the
// reader can spot the live reversal at a glance (Highcharts xAxis.plotBands,
// a core capability distinct from a plain scatter+dataLabels rendering) ----
const lastColumn = columns[lastCol];
const reversalZoneColor = Highcharts.color(lastColumn.direction === 1 ? RISING : FALLING)
  .setOpacity(0.1)
  .get();

// --- Price target via the classic vertical count method (spec Applications):
// target = extreme of the active column + column height x box size x
// reversal count, projected in the column's own direction --------------------
const lastBoxCount = lastColumn.boxes.length;
const priceTarget =
  lastColumn.direction === 1
    ? Math.min(...lastColumn.boxes) * BOX_SIZE + lastBoxCount * BOX_SIZE * REVERSAL_BOXES
    : Math.max(...lastColumn.boxes) * BOX_SIZE - lastBoxCount * BOX_SIZE * REVERSAL_BOXES;

Highcharts.chart("container", {
  chart: {
    type: "scatter",
    backgroundColor: "transparent",
    animation: false,
    style: { fontFamily: "inherit" },
  },
  credits: { enabled: false },
  title: {
    text: "point-and-figure-basic · javascript · highcharts · anyplot.ai",
    style: { color: t.ink, fontSize: "22px", fontWeight: "600" },
  },
  subtitle: {
    text: `Box size $${BOX_SIZE} · ${REVERSAL_BOXES}-box reversal`,
    style: { color: t.inkSoft, fontSize: "14px" },
  },
  xAxis: {
    title: {
      text: "Column (price reversals — not time)",
      style: { color: t.inkSoft, fontSize: "16px" },
    },
    min: -0.5,
    max: lastCol + 0.5,
    tickInterval: tickStep,
    gridLineWidth: 0,
    lineColor: t.inkSoft,
    tickColor: t.inkSoft,
    labels: { style: { color: t.inkSoft, fontSize: "14px" } },
    plotBands: [
      {
        from: lastCol - 0.5,
        to: lastCol + 0.5,
        color: reversalZoneColor,
        zIndex: 0,
      },
    ],
  },
  yAxis: {
    title: { text: "Price ($)", style: { color: t.inkSoft, fontSize: "16px" } },
    tickInterval: BOX_SIZE,
    gridLineColor: t.grid,
    lineColor: t.inkSoft,
    labels: { style: { color: t.inkSoft, fontSize: "14px" } },
    plotBands: rowBands,
    plotLines: [
      {
        value: priceTarget,
        color: t.amber,
        dashStyle: "ShortDot",
        width: 2,
        zIndex: 5,
        label: {
          text: `Price target (vertical count): $${priceTarget.toFixed(0)}`,
          align: "right",
          x: -6,
          style: { color: t.amber, fontSize: "12px", fontWeight: "600" },
        },
      },
    ],
  },
  legend: {
    itemStyle: { color: t.inkSoft, fontSize: "14px" },
    itemHoverStyle: { color: t.ink },
  },
  tooltip: {
    headerFormat: "",
    pointFormat: "Column {point.x} · ${point.y}",
  },
  plotOptions: {
    series: { animation: false },
    scatter: {
      marker: { enabled: false },
      dataLabels: {
        enabled: true,
        allowOverlap: true,
        verticalAlign: "middle",
        align: "center",
        y: 1,
        padding: 0,
        style: { fontWeight: "700", fontSize: "14px", textOutline: "none" },
      },
    },
  },
  series: [
    {
      name: "Rising (X)",
      type: "scatter",
      data: xPoints,
      color: RISING,
      dataLabels: { format: "X", style: { color: RISING } },
    },
    {
      name: "Falling (O)",
      type: "scatter",
      data: oPoints,
      color: FALLING,
      dataLabels: { format: "O", style: { color: FALLING } },
    },
    {
      name: "Support (45°)",
      type: "line",
      data: supportLine,
      color: t.inkSoft,
      dashStyle: "Dash",
      lineWidth: 2,
      marker: { enabled: false },
      enableMouseTracking: false,
      showInLegend: false,
    },
    {
      name: "Resistance (45°)",
      type: "line",
      data: resistanceLine,
      color: t.inkSoft,
      dashStyle: "Dash",
      lineWidth: 2,
      marker: { enabled: false },
      enableMouseTracking: false,
      showInLegend: false,
    },
  ],
});
Runnable source as JSON, for any HTTP client: https://api.anyplot.ai/specs/point-and-figure-basic/highcharts/code. Any spec id and library id listed in llms-full.txt fit the same URL shape; every URL below is complete and callable.
{
  "spec_id": "point-and-figure-basic",
  "language": "javascript",
  "library": "highcharts",
  "page": "https://anyplot.ai/point-and-figure-basic/javascript/highcharts",
  "hub": "https://anyplot.ai/point-and-figure-basic",
  "code_json": "https://api.anyplot.ai/specs/point-and-figure-basic/highcharts/code",
  "spec_json": "https://api.anyplot.ai/specs/point-and-figure-basic",
  "render_light_png": "https://storage.googleapis.com/anyplot-images/plots/point-and-figure-basic/javascript/highcharts/plot-light.png",
  "render_dark_png": "https://storage.googleapis.com/anyplot-images/plots/point-and-figure-basic/javascript/highcharts/plot-dark.png",
  "interactive_light_html": "https://storage.googleapis.com/anyplot-images/plots/point-and-figure-basic/javascript/highcharts/plot-light.html",
  "interactive_dark_html": "https://storage.googleapis.com/anyplot-images/plots/point-and-figure-basic/javascript/highcharts/plot-dark.html",
  "quality_score": 95.0,
  "license": "MIT",
  "guide": "https://anyplot.ai/llms.txt"
}
Part of Point and Figure Chart on anyplot.ai.