Source code in 15 libraries — Python: Altair, Bokeh, lets-plot, Matplotlib, Plotly, plotnine, Pygal, Seaborn; R: ggplot2; Julia: Makie.jl; JavaScript: Chart.js, D3.js, Apache ECharts, Highcharts, MUI X Charts.
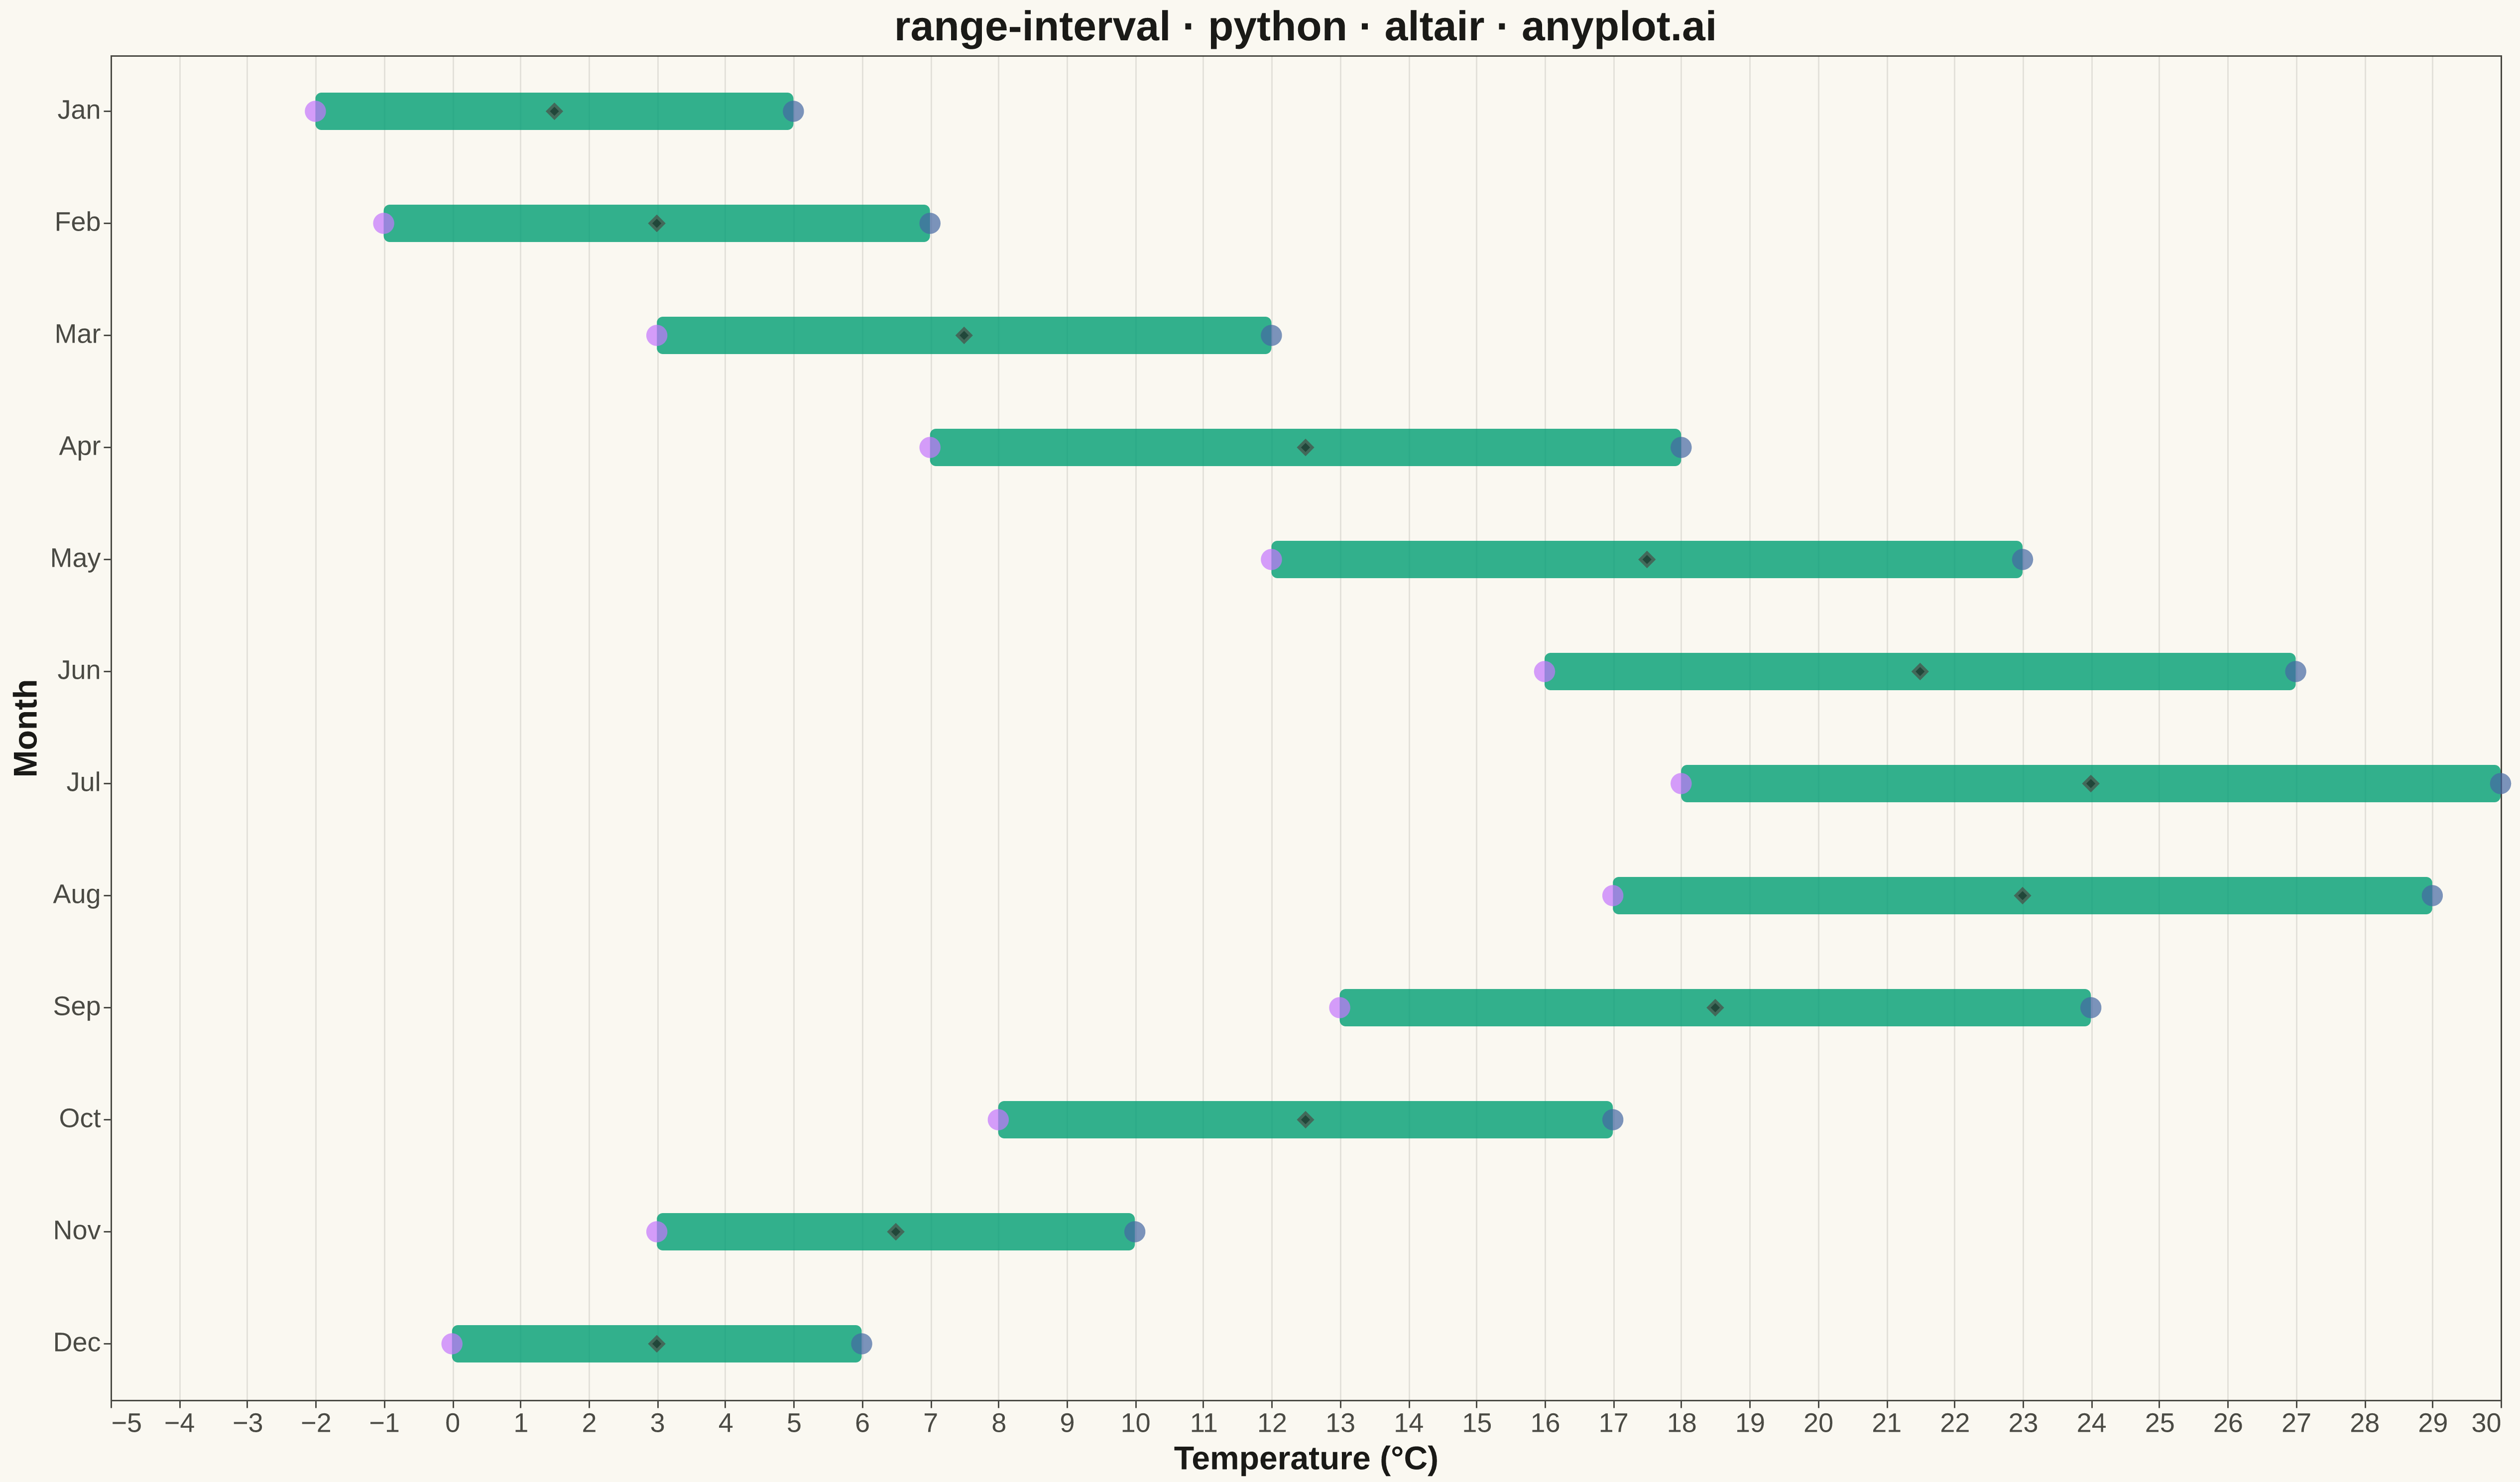
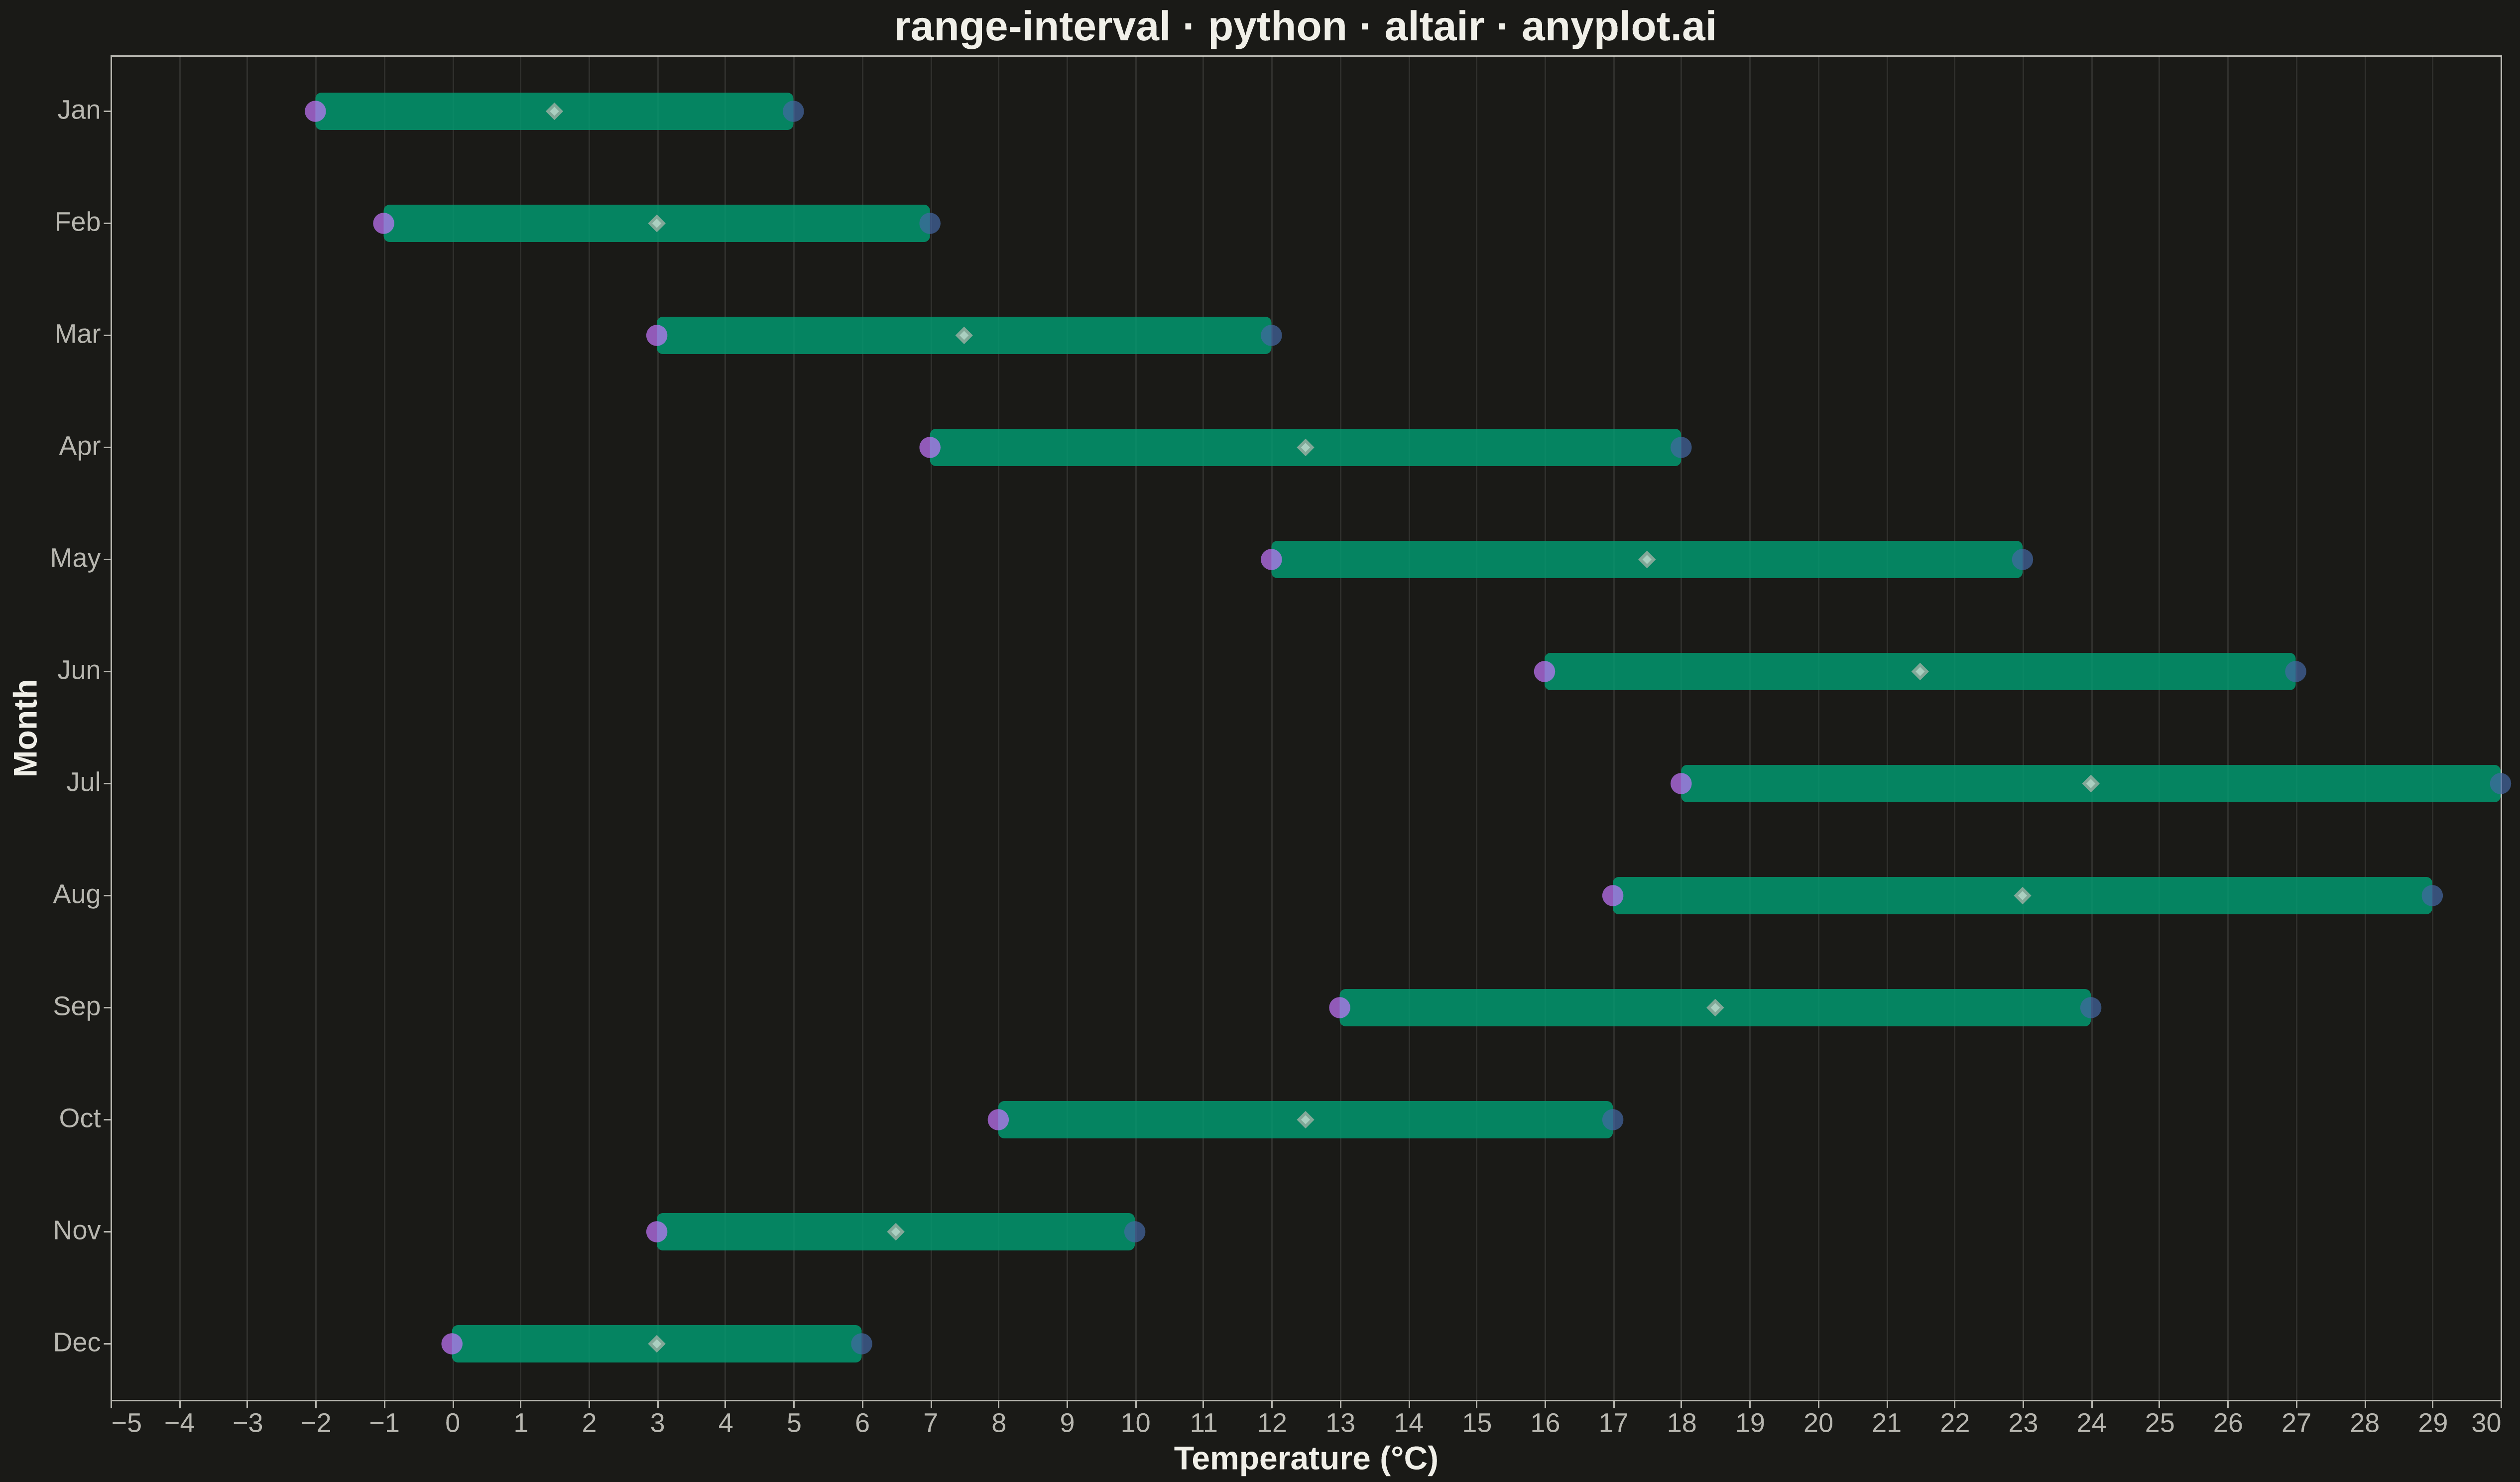
A range interval chart displays min-max ranges or intervals as vertical or horizontal bars/segments for each category, making it ideal for visualizing uncertainty bounds, confidence intervals, or value spreads. Unlike error bars which extend from a central data point, range intervals show the full span between two values as a filled bar or line segment, emphasizing the range itself rather than deviation from a center. This visualization excels at comparing ranges across multiple categories simultaneously.
Preview render from the Altair implementation.