The same plot in 14 other libraries — JavaScript: D3.js, Apache ECharts, Highcharts, MUI X Charts; Python: Altair, Bokeh, lets-plot, Matplotlib, Plotly, plotnine, Pygal, Seaborn; R: ggplot2; Julia: Makie.jl. Compare all 15 side by side: Range Interval Chart in Python, R, Julia and JavaScript.
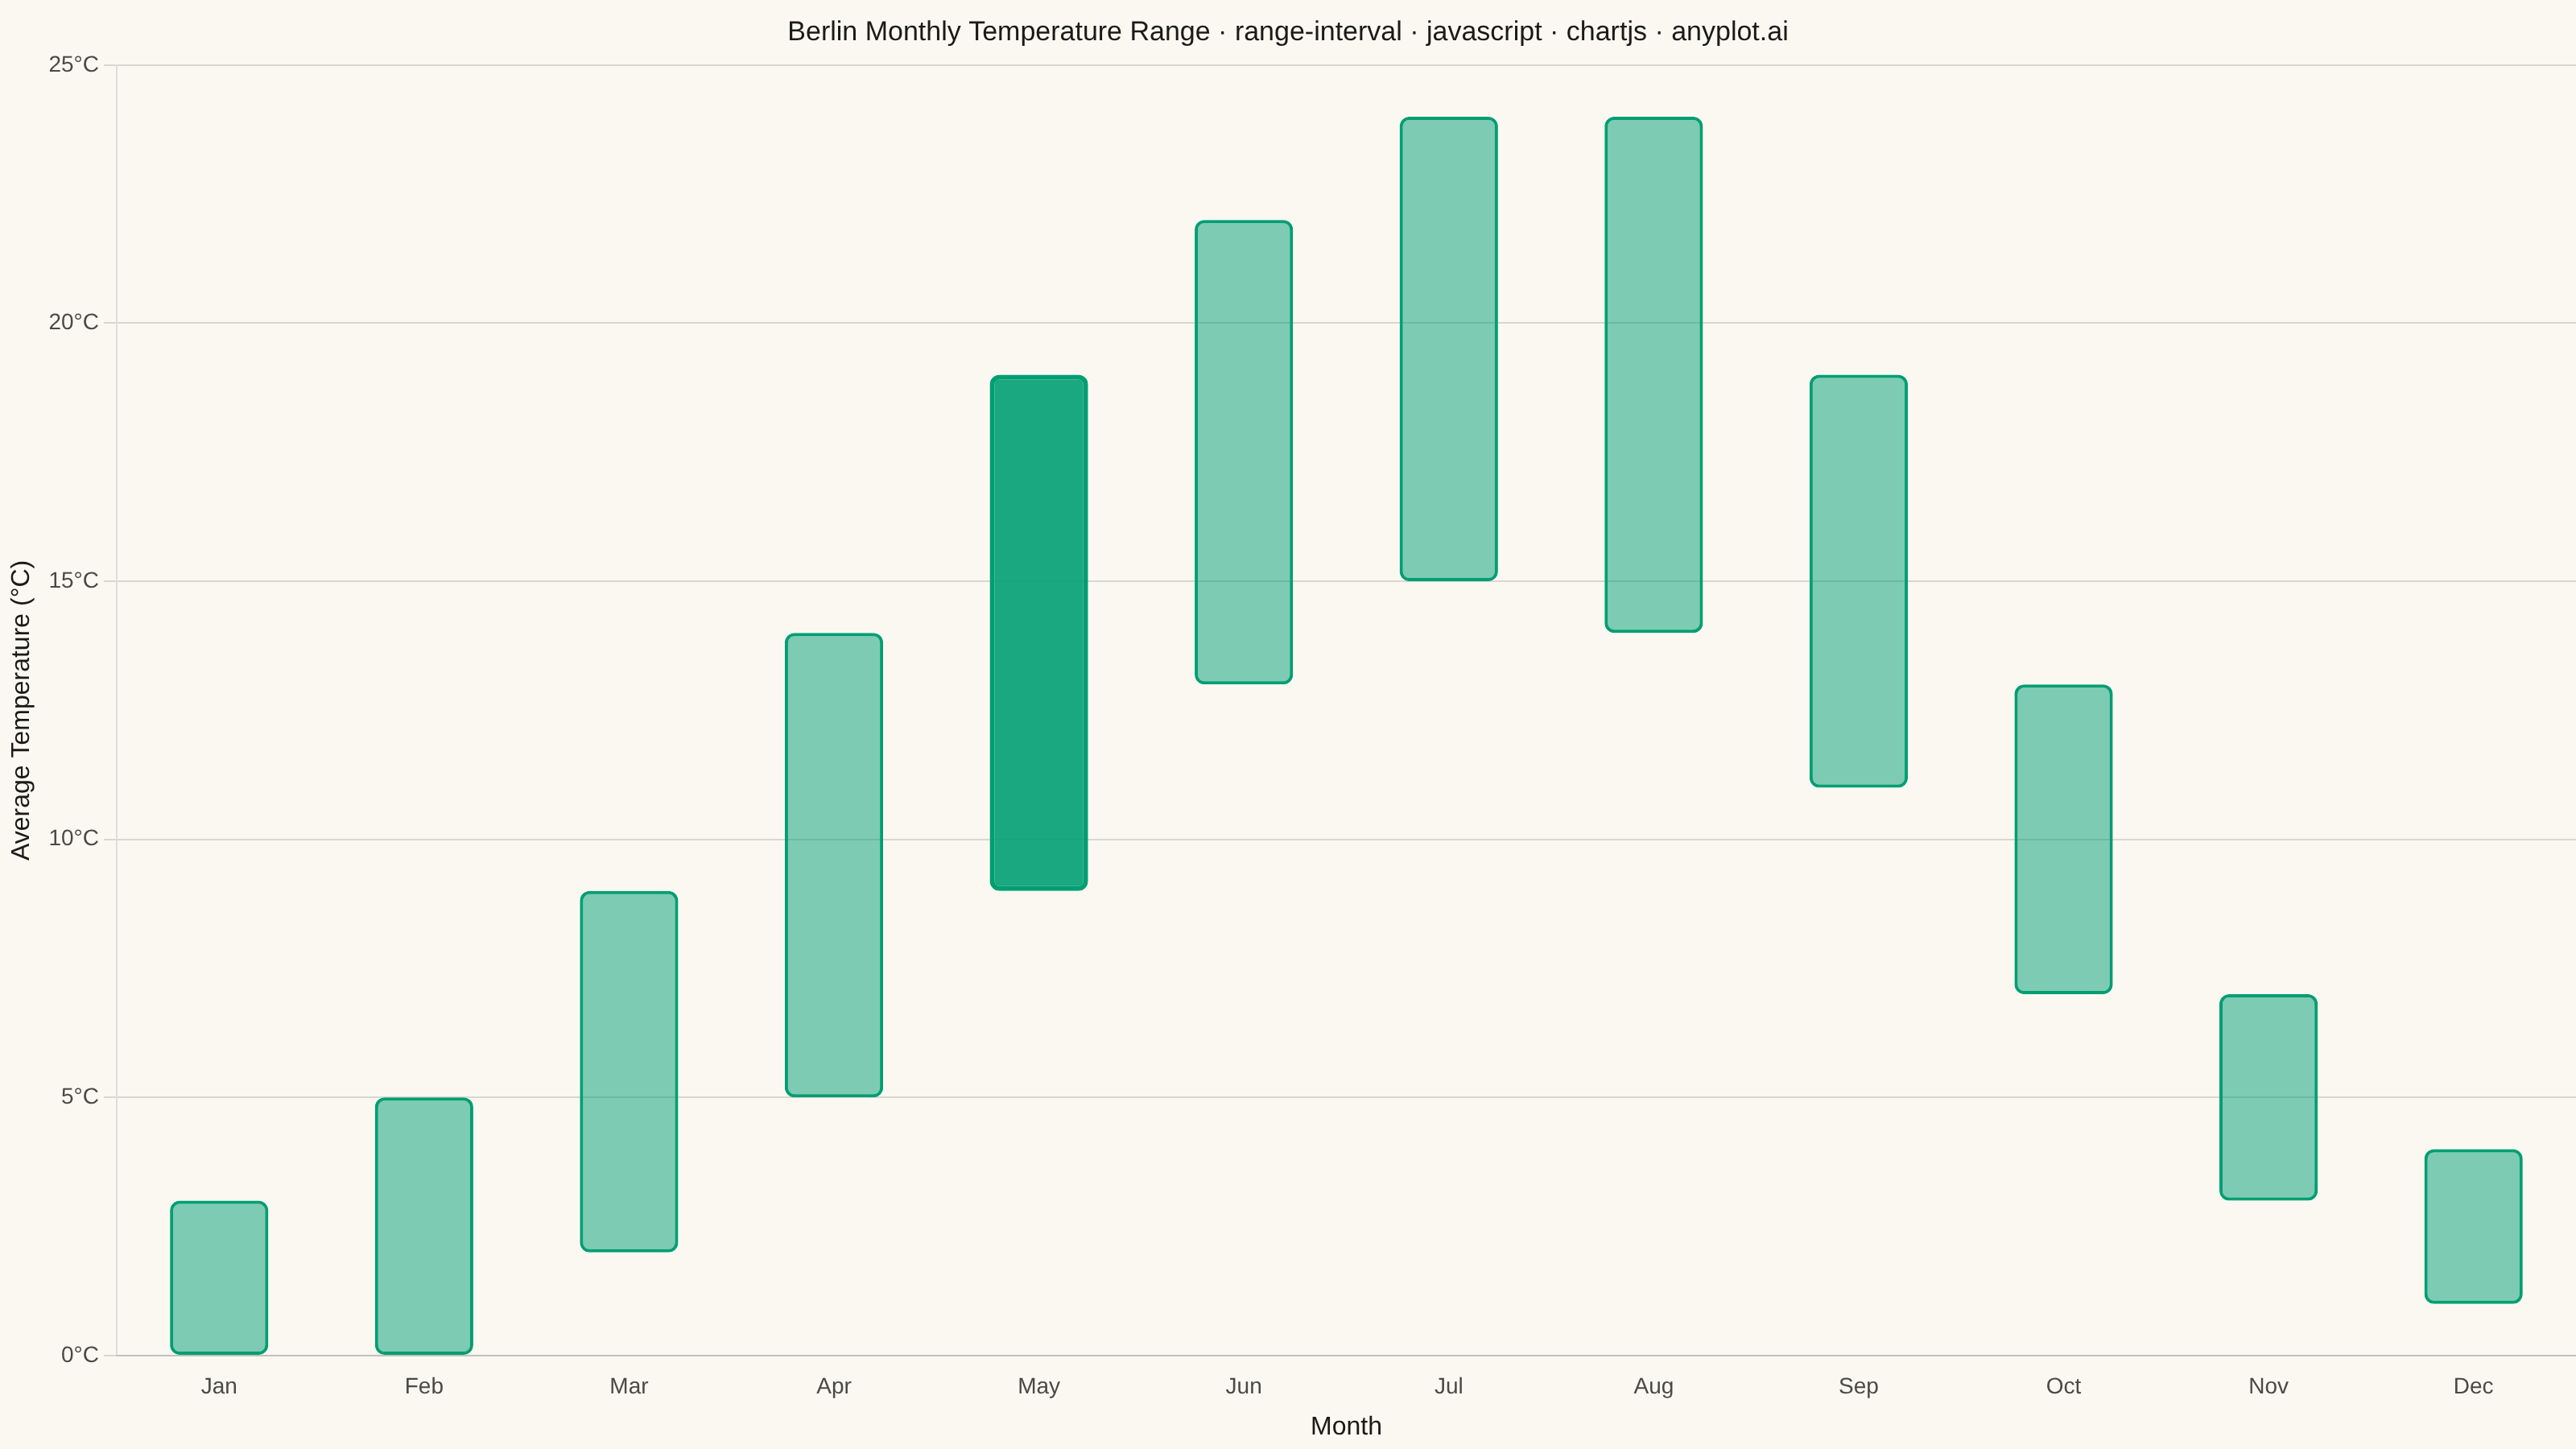
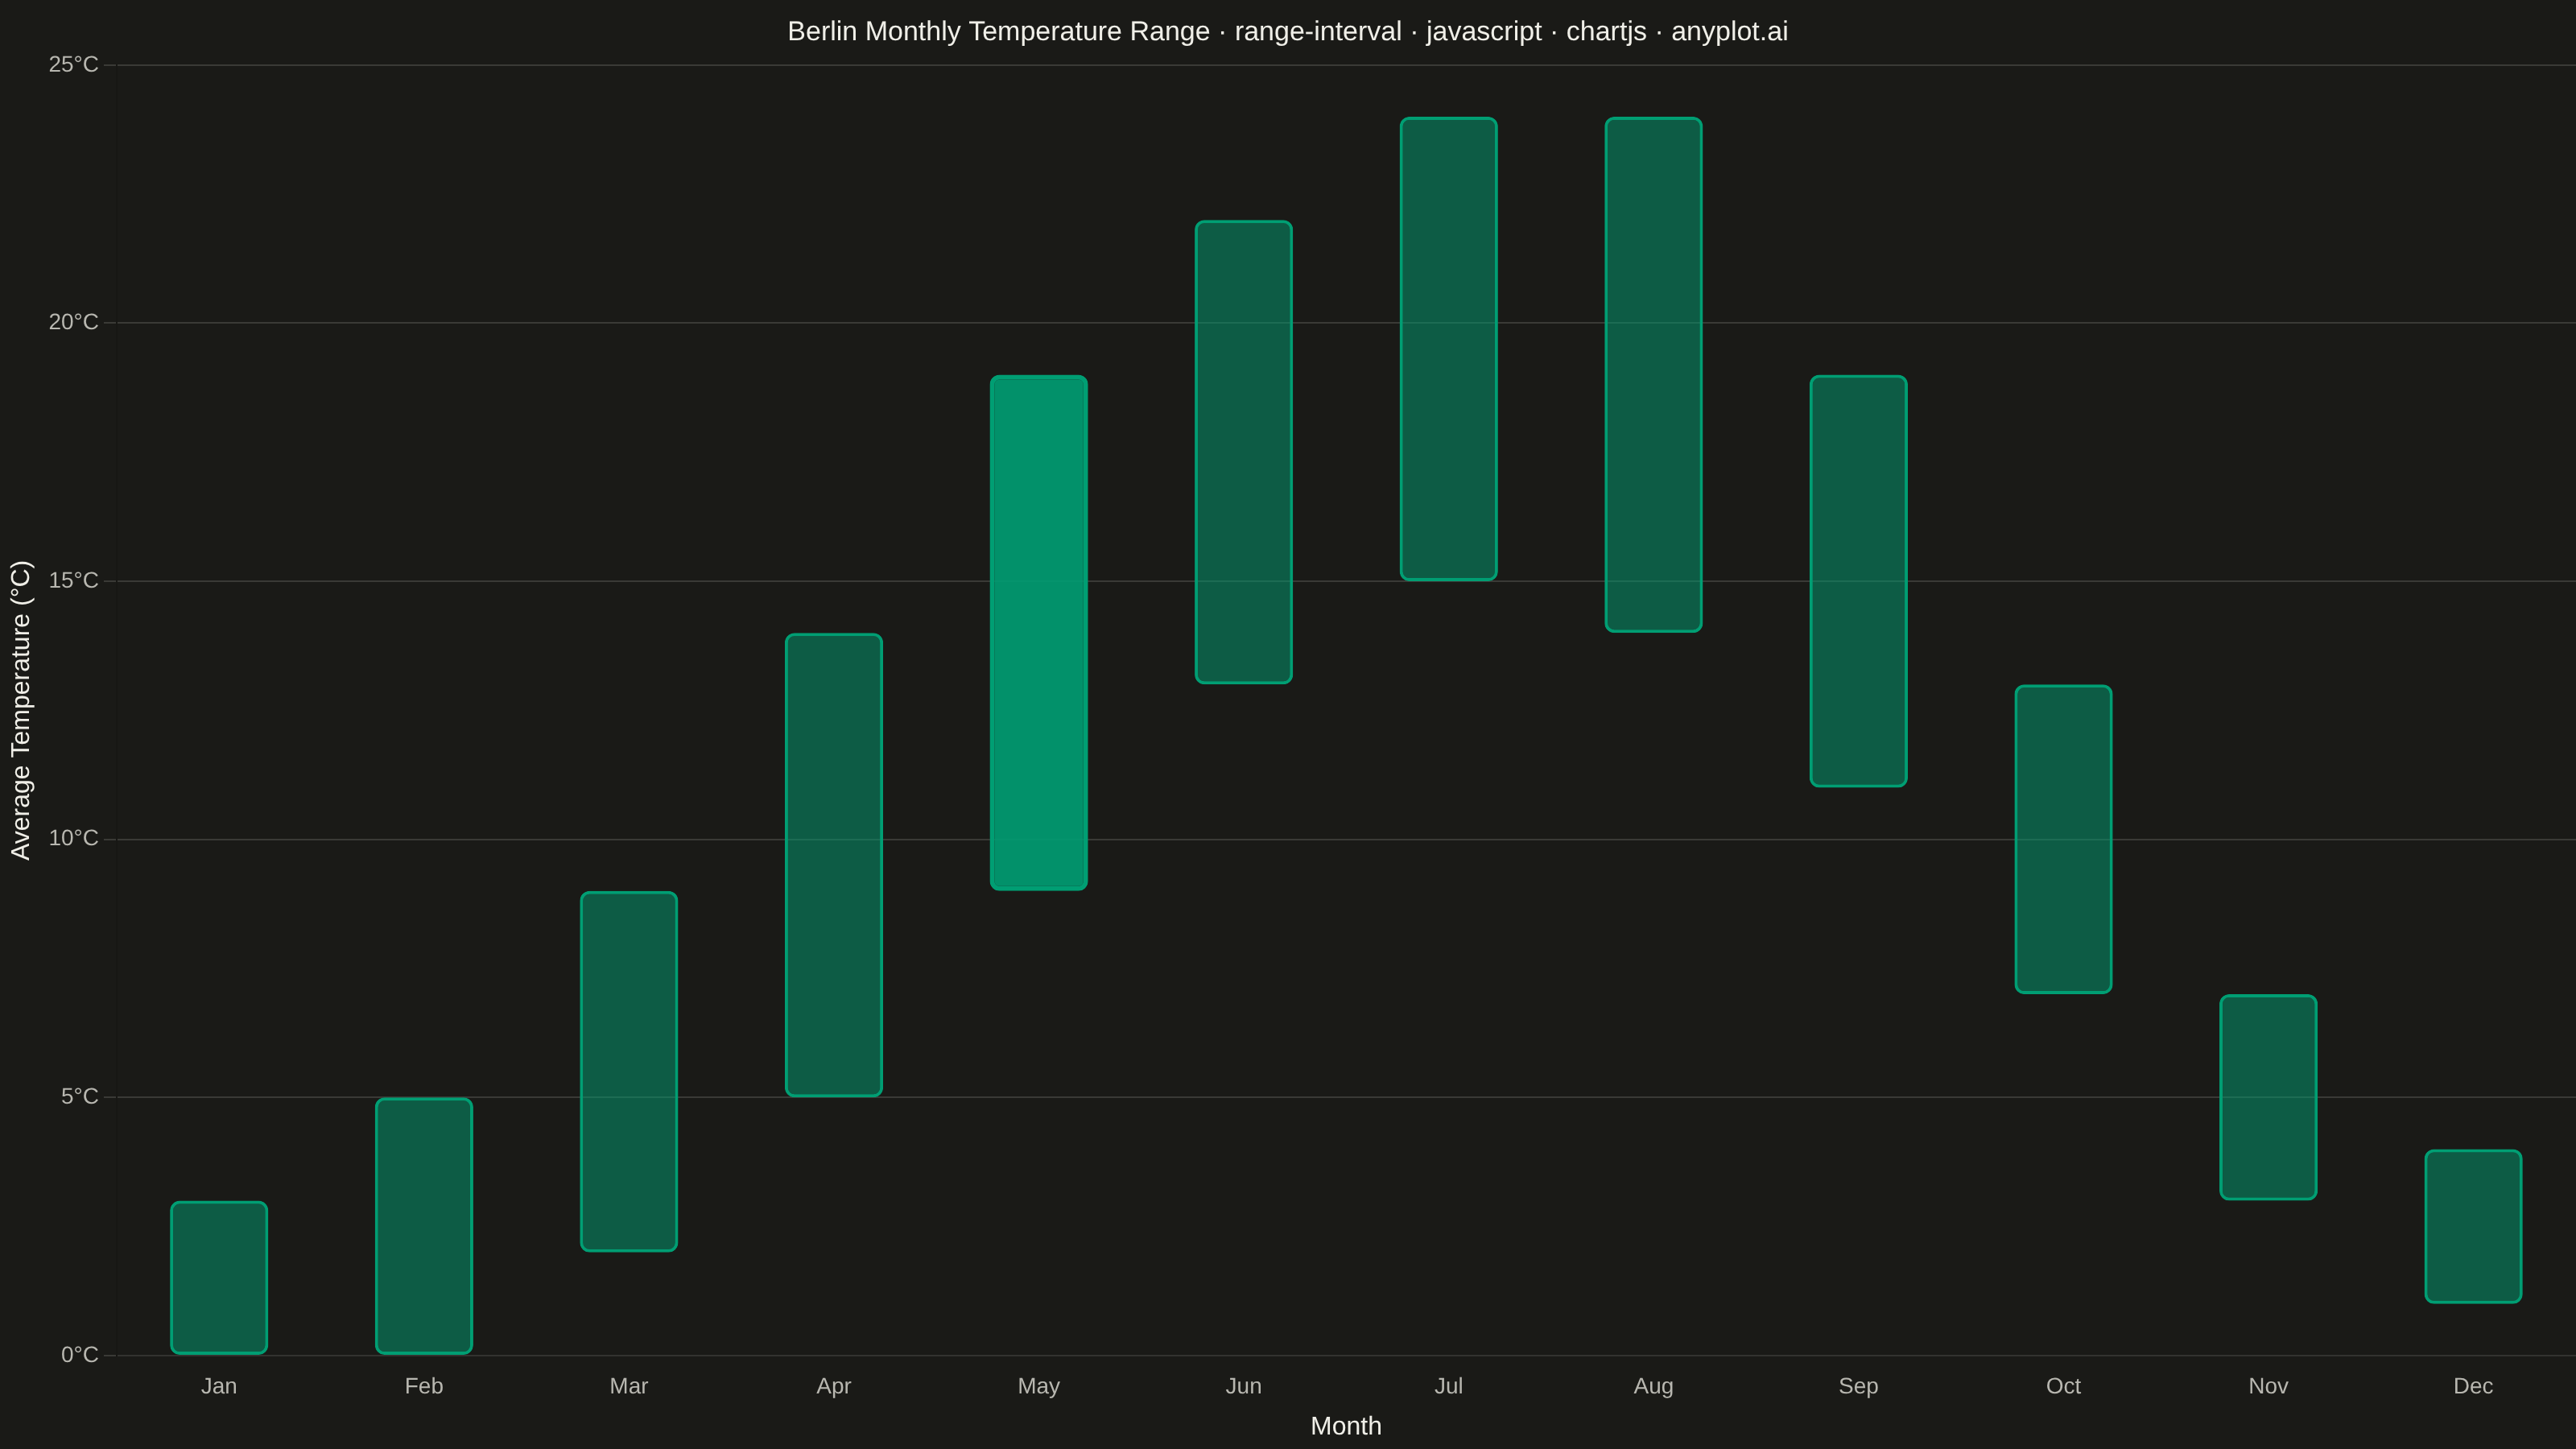
A range interval chart displays min-max ranges or intervals as vertical or horizontal bars/segments for each category, making it ideal for visualizing uncertainty bounds, confidence intervals, or value spreads. Unlike error bars which extend from a central data point, range intervals show the full span between two values as a filled bar or line segment, emphasizing the range itself rather than deviation from a center. This visualization excels at comparing ranges across multiple categories simultaneously.
// anyplot.ai
// range-interval: Range Interval Chart
// Library: chartjs 4.4.7 | JavaScript 22.23.2
// Quality: 88/100 | Created: 2026-09-02

const t = window.ANYPLOT_TOKENS;

// --- Data (in-memory, deterministic) — Berlin monthly temperature range ----
const months = ["Jan", "Feb", "Mar", "Apr", "May", "Jun", "Jul", "Aug", "Sep", "Oct", "Nov", "Dec"];
const lowC = [0, 0, 2, 5, 9, 13, 15, 14, 11, 7, 3, 1];
const highC = [3, 5, 9, 14, 19, 22, 24, 24, 19, 13, 7, 4];
const ranges = months.map((_, i) => [lowC[i], highC[i]]);
const widestIdx = months.reduce((best, _, i) => (highC[i] - lowC[i] > highC[best] - lowC[best] ? i : best), 0);

// brand green fill, hardcoded rgba (t.palette[0] is always #009E73) — widest-range month gets a stronger fill
const fillColors = months.map((_, i) => (i === widestIdx ? "rgba(0, 158, 115, 0.9)" : "rgba(0, 158, 115, 0.5)"));
const borderWidths = months.map((_, i) => (i === widestIdx ? 3 : 2));

// --- Title sizing (scale down once the title exceeds the ~67-char baseline) -
const title = "Berlin Monthly Temperature Range · range-interval · javascript · chartjs · anyplot.ai";
const titleFontSize = Math.max(14, Math.round(22 * Math.min(1, 67 / title.length)));

// --- Mount -----------------------------------------------------------------
const canvas = document.createElement("canvas");
document.getElementById("container").appendChild(canvas);

// --- Chart -----------------------------------------------------------------
new Chart(canvas, {
  type: "bar",
  data: {
    labels: months,
    datasets: [
      {
        label: "Temperature range",
        data: ranges,
        backgroundColor: fillColors,
        borderColor: t.palette[0],
        borderWidth: borderWidths,
        borderSkipped: false,
        borderRadius: 6,
        barPercentage: 0.6,
      },
    ],
  },
  options: {
    responsive: true,
    maintainAspectRatio: false,
    animation: false,
    plugins: {
      title: { display: true, text: title, color: t.ink, font: { size: titleFontSize, weight: "500" } },
      legend: { display: false },
      tooltip: {
        callbacks: {
          label: (ctx) => `Low ${lowC[ctx.dataIndex]}°C – High ${highC[ctx.dataIndex]}°C`,
        },
      },
    },
    scales: {
      x: {
        ticks: { color: t.inkSoft, font: { size: 14 } },
        grid: { display: false },
        title: { display: true, text: "Month", color: t.ink, font: { size: 16 } },
      },
      y: {
        ticks: { color: t.inkSoft, font: { size: 14 }, callback: (v) => `${v}°C` },
        grid: { color: t.grid },
        title: { display: true, text: "Average Temperature (°C)", color: t.ink, font: { size: 16 } },
      },
    },
  },
});
Runnable source as JSON, for any HTTP client: https://api.anyplot.ai/specs/range-interval/chartjs/code. Any spec id and library id listed in llms-full.txt fit the same URL shape; every URL below is complete and callable.
{
  "spec_id": "range-interval",
  "language": "javascript",
  "library": "chartjs",
  "page": "https://anyplot.ai/range-interval/javascript/chartjs",
  "hub": "https://anyplot.ai/range-interval",
  "code_json": "https://api.anyplot.ai/specs/range-interval/chartjs/code",
  "spec_json": "https://api.anyplot.ai/specs/range-interval",
  "render_light_png": "https://storage.googleapis.com/anyplot-images/plots/range-interval/javascript/chartjs/plot-light.png",
  "render_dark_png": "https://storage.googleapis.com/anyplot-images/plots/range-interval/javascript/chartjs/plot-dark.png",
  "interactive_light_html": "https://storage.googleapis.com/anyplot-images/plots/range-interval/javascript/chartjs/plot-light.html",
  "interactive_dark_html": "https://storage.googleapis.com/anyplot-images/plots/range-interval/javascript/chartjs/plot-dark.html",
  "quality_score": 88.0,
  "license": "MIT",
  "guide": "https://anyplot.ai/llms.txt"
}
Part of Range Interval Chart on anyplot.ai.