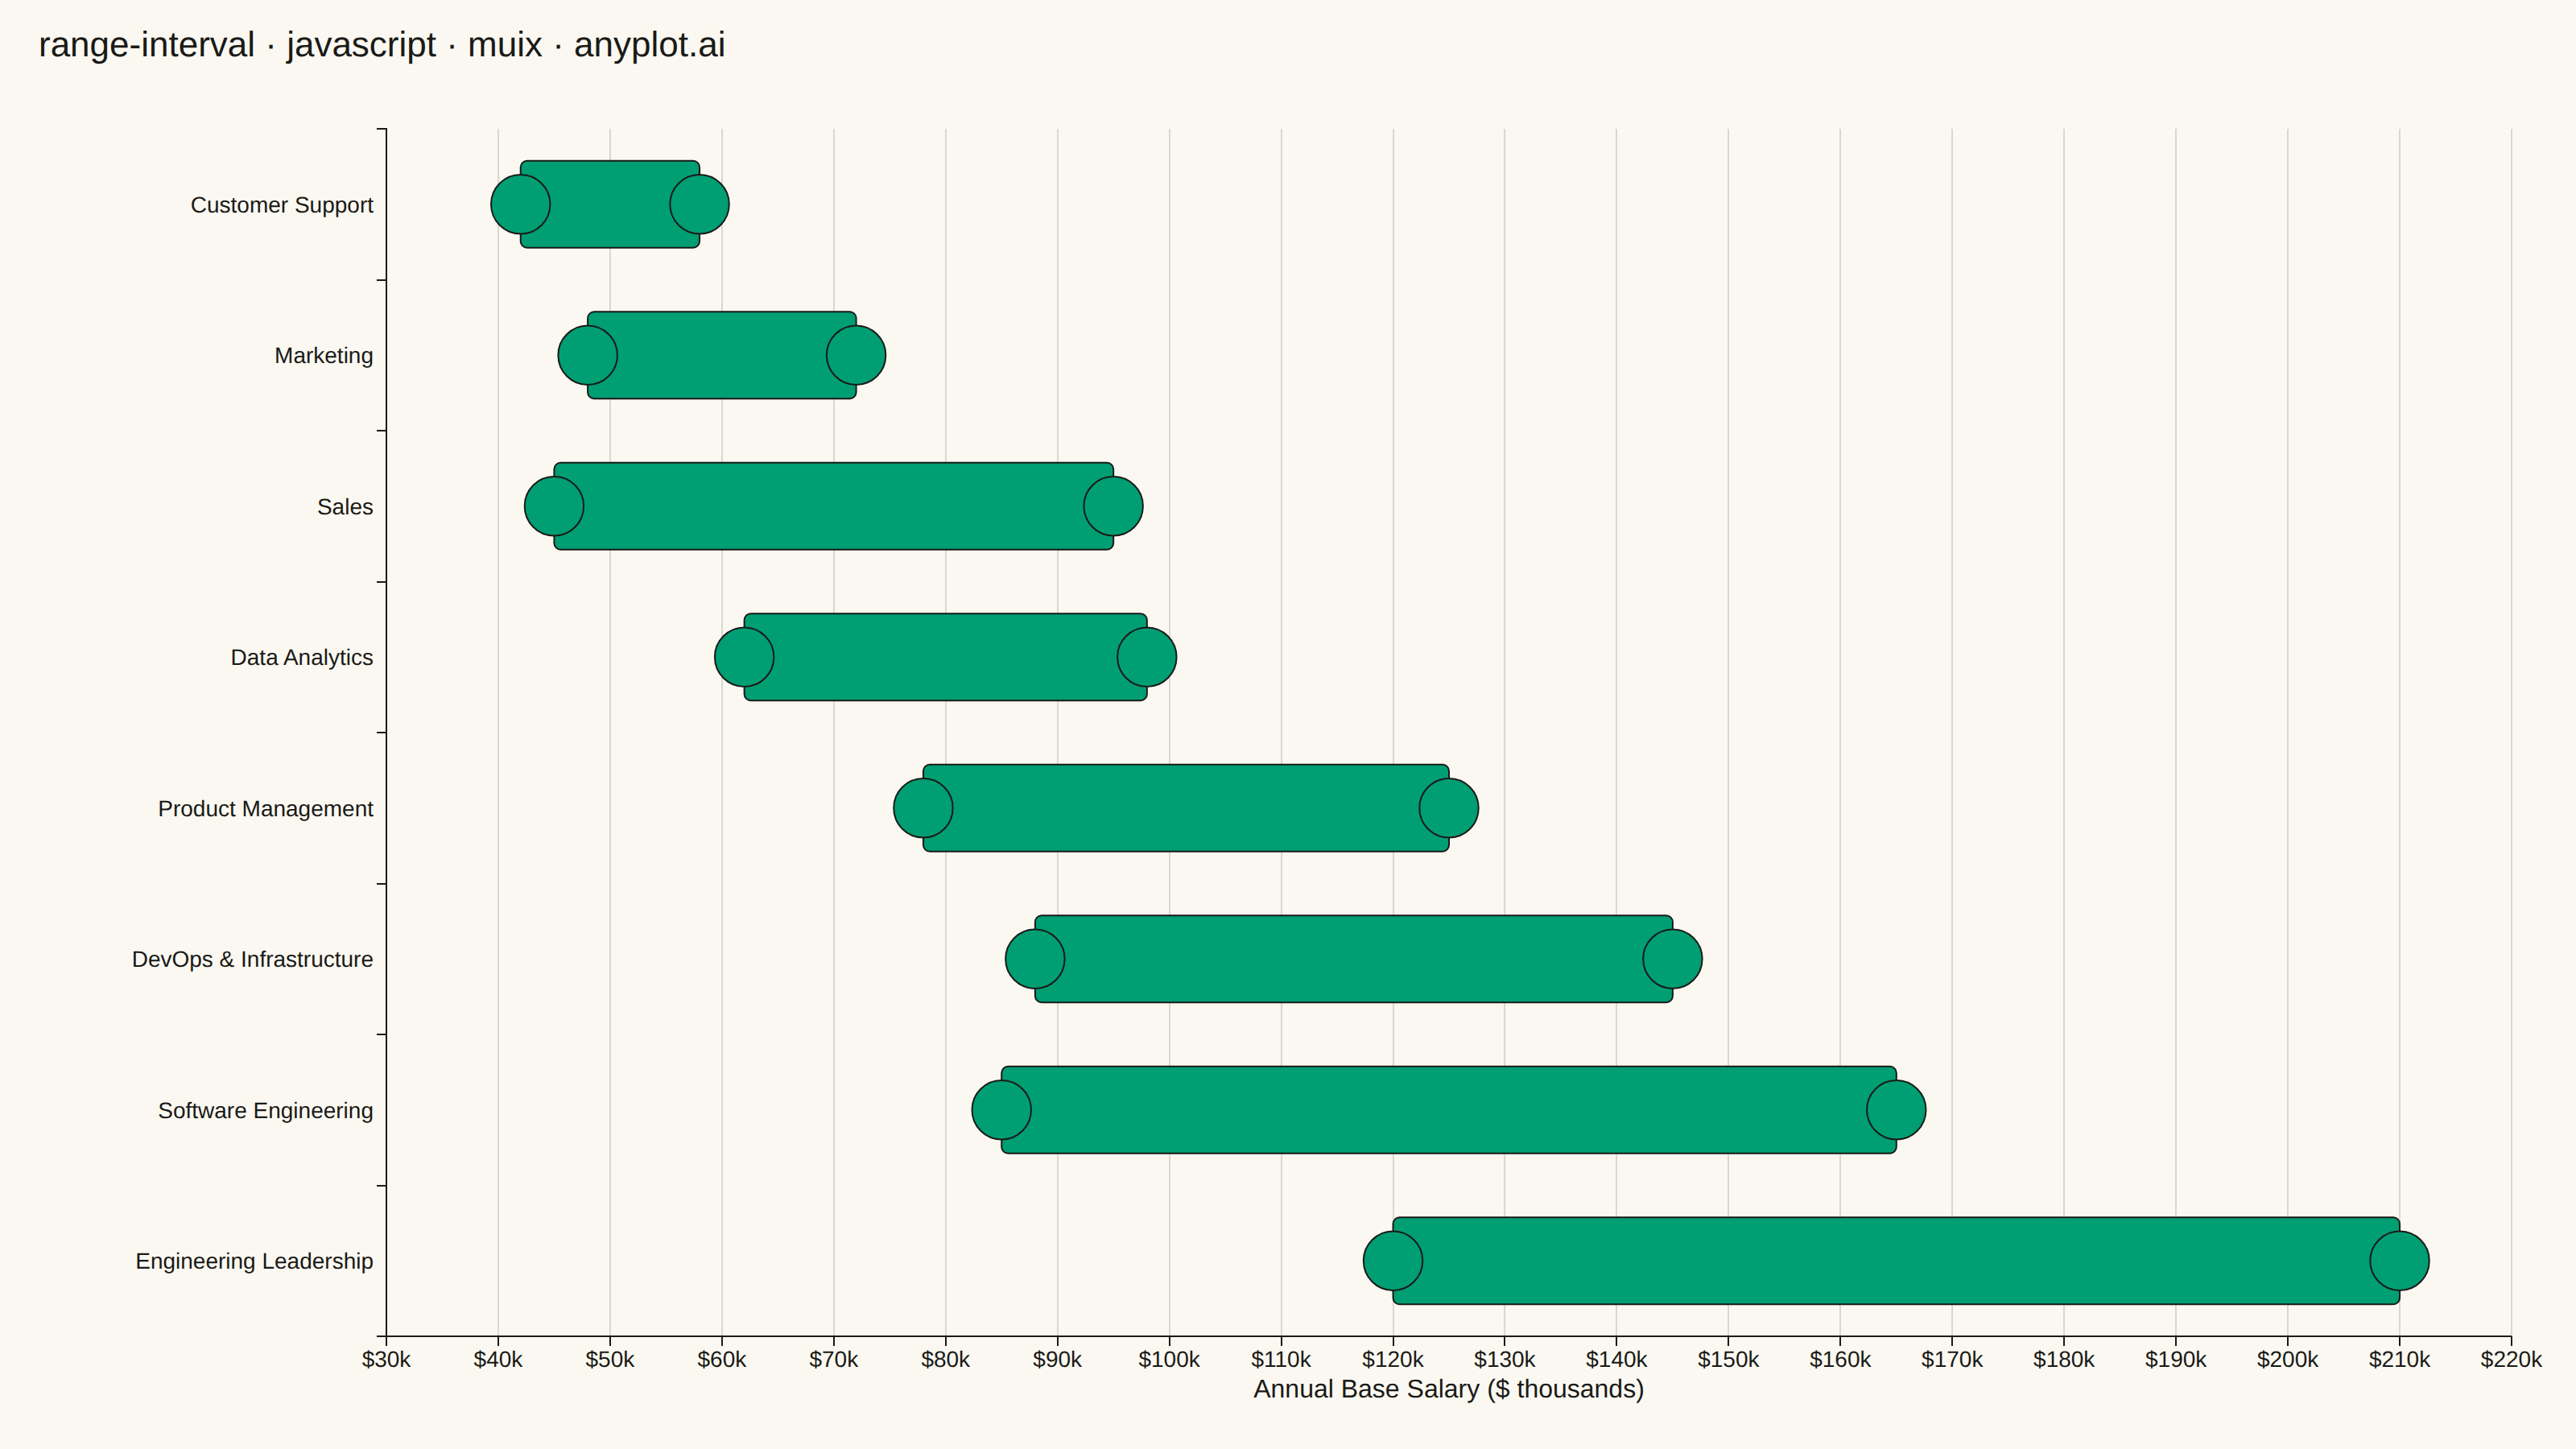
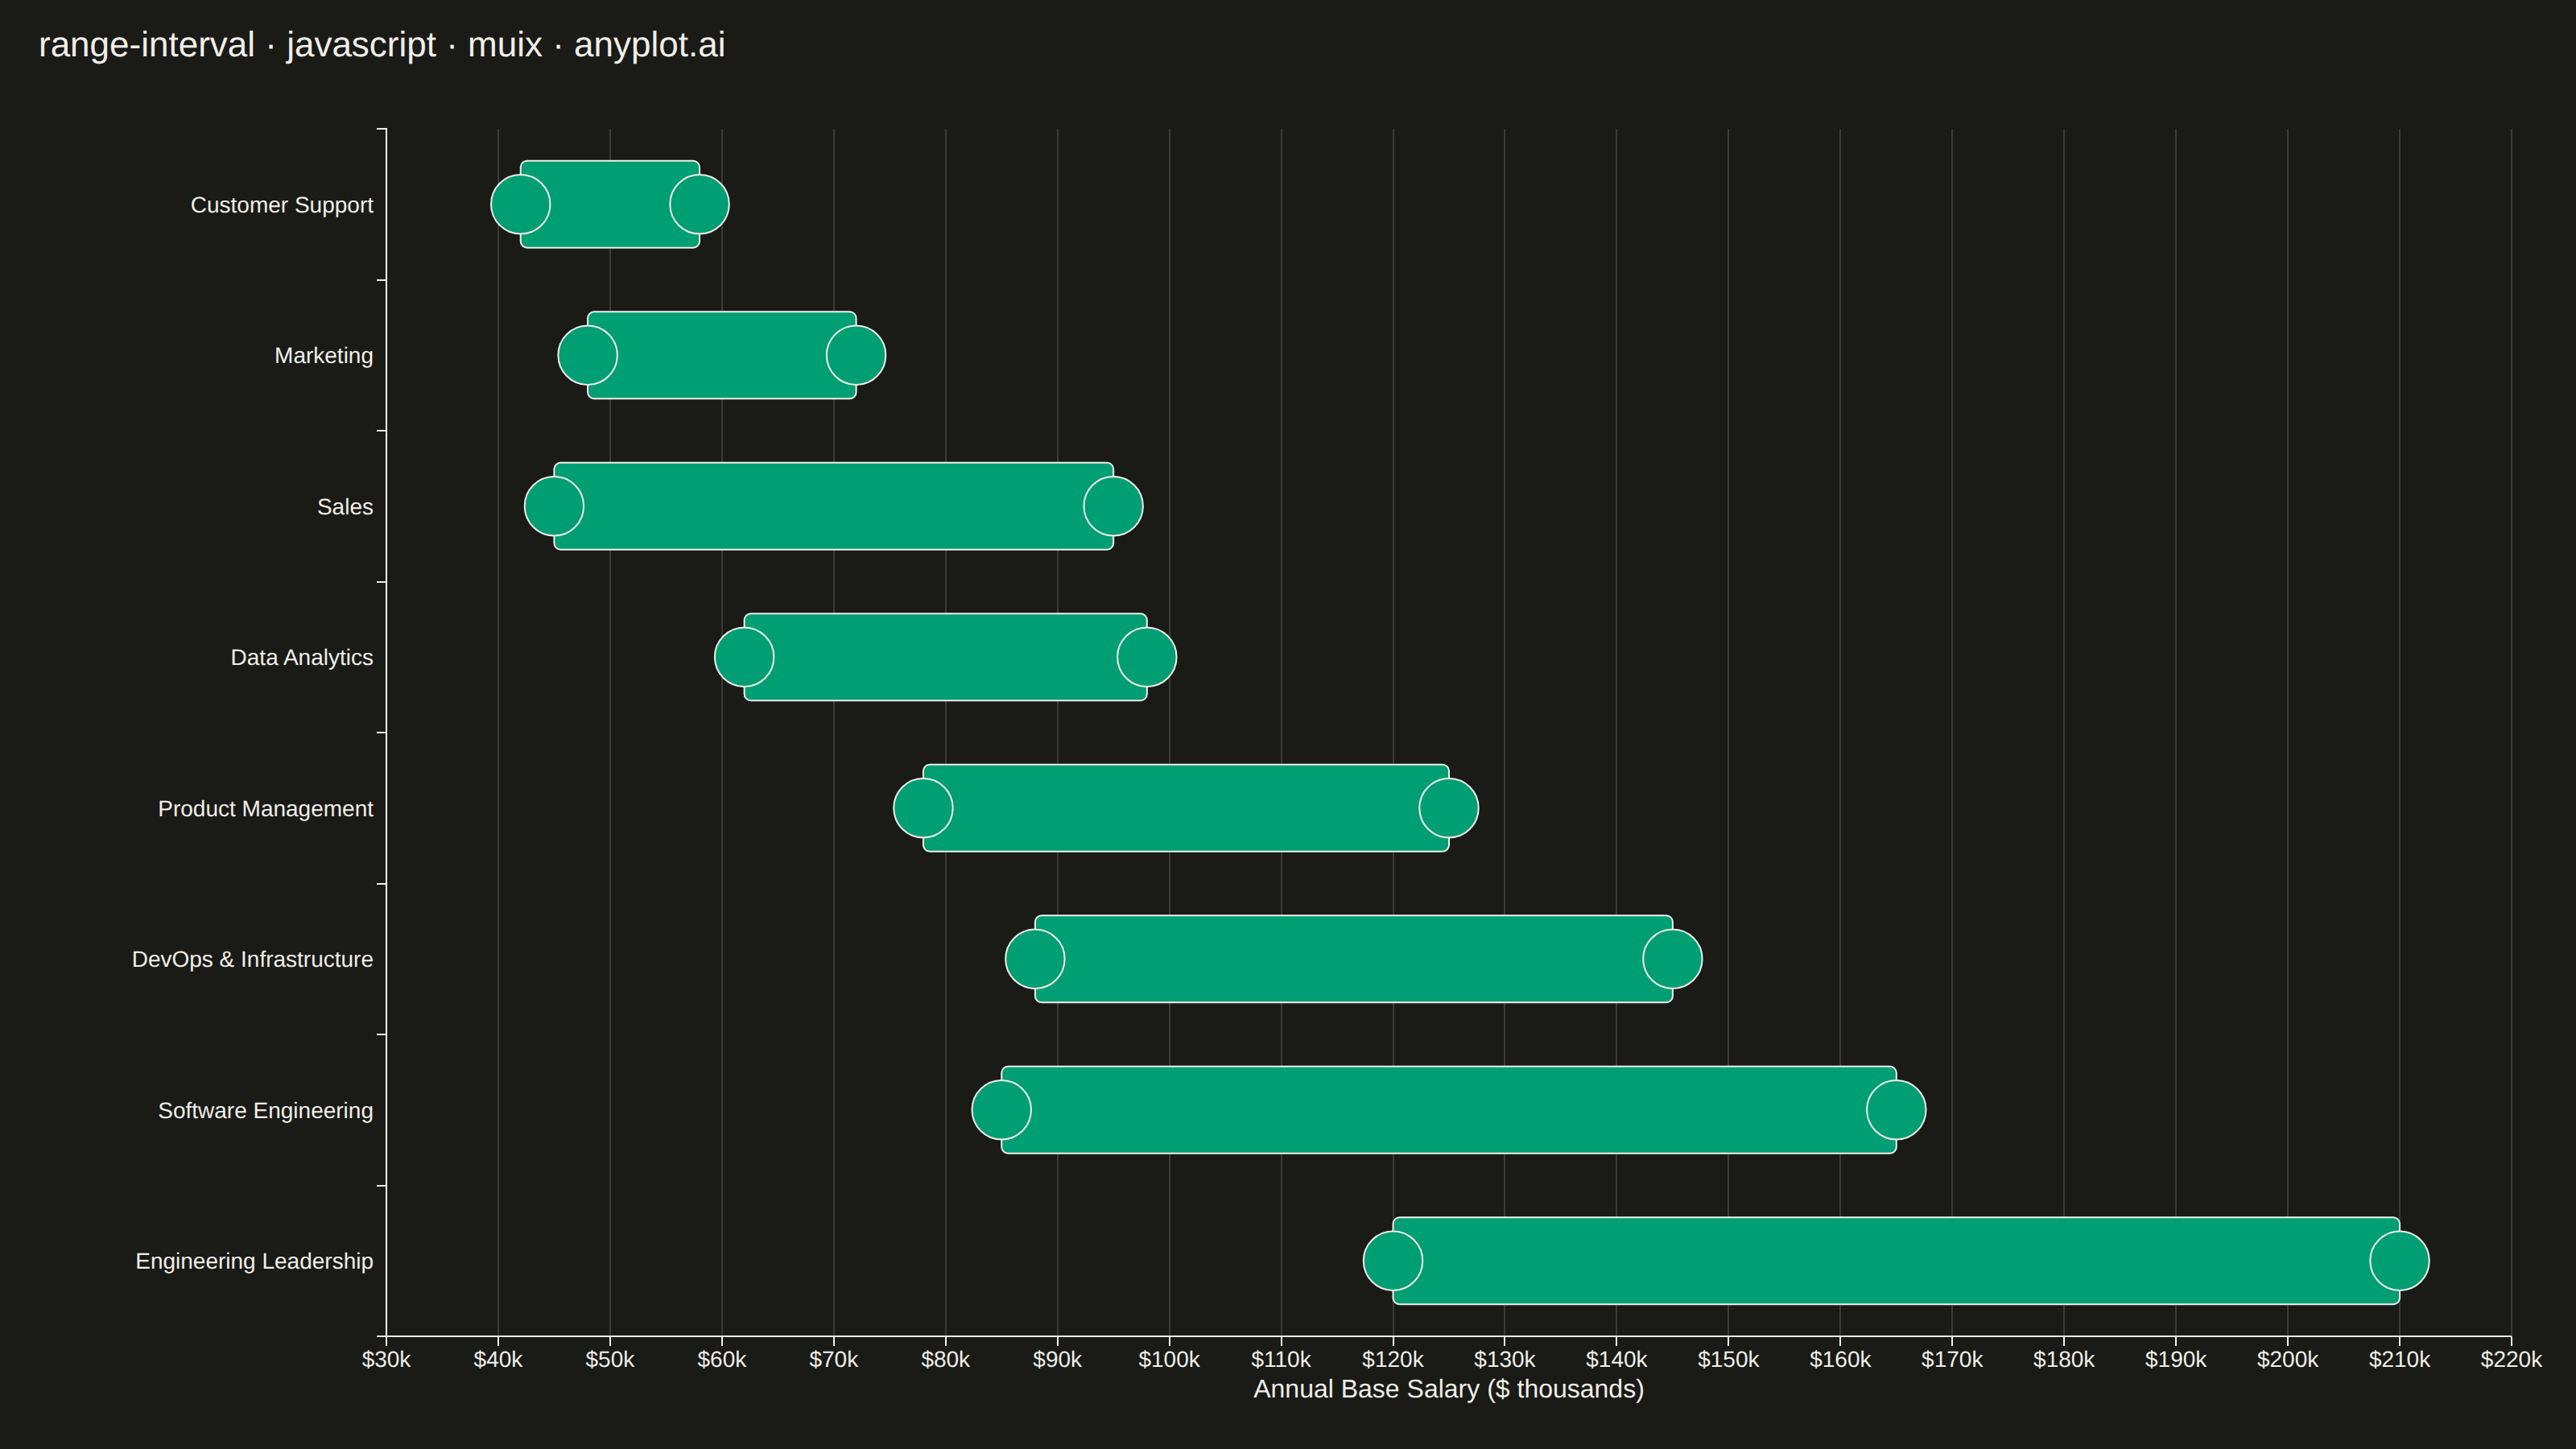
The same plot in 14 other libraries — JavaScript: Chart.js, D3.js, Apache ECharts, Highcharts; Python: Altair, Bokeh, lets-plot, Matplotlib, Plotly, plotnine, Pygal, Seaborn; R: ggplot2; Julia: Makie.jl. Compare all 15 side by side: Range Interval Chart in Python, R, Julia and JavaScript.
A range interval chart displays min-max ranges or intervals as vertical or horizontal bars/segments for each category, making it ideal for visualizing uncertainty bounds, confidence intervals, or value spreads. Unlike error bars which extend from a central data point, range intervals show the full span between two values as a filled bar or line segment, emphasizing the range itself rather than deviation from a center. This visualization excels at comparing ranges across multiple categories simultaneously.
// anyplot.ai
// range-interval: Range Interval Chart
// Library: muix 7.29.1 | JavaScript 22.23.2
// Quality: 88/100 | Created: 2026-09-02
import { BarChart } from "@mui/x-charts/BarChart";
import { useXScale, useYScale } from "@mui/x-charts/hooks";

const t = window.ANYPLOT_TOKENS;
const TITLE = "range-interval · javascript · muix · anyplot.ai";
const TITLE_HEIGHT = 56;

// --- Data (in-memory, deterministic) ----------------------------------------
// Annual base-salary ranges by department at a mid-size tech company ($k).
const departments = [
  "Customer Support",
  "Marketing",
  "Sales",
  "Data Analytics",
  "Product Management",
  "DevOps & Infrastructure",
  "Software Engineering",
  "Engineering Leadership",
];
const minSalary = [42, 48, 45, 62, 78, 88, 85, 120];
const maxSalary = [58, 72, 95, 98, 125, 145, 165, 210];

const axisMin = 30;
const axisMax = 220;

// --- Range bars ---------------------------------------------------------
// Community BarChart has no native floating-bar / range primitive. Rather than
// faking one out of two stacked series (transparent spacer + visible span —
// which hits a real react-spring paint bug on the first stacked item), the
// range is drawn directly with the chart's own x/y scale hooks: the same
// documented extension point the community surface offers for custom
// overlays (see e.g. ChartsReferenceLine). No animation, no clip-path — a
// single deterministic <rect> per category.
function RangeBars() {
  const xScale = useXScale();
  const yScale = useYScale();
  const barHeight = yScale.bandwidth() * 0.72;
  const capRadius = barHeight * 0.34;

  return (
    <g>
      {departments.map((dept, i) => {
        const x0 = xScale(minSalary[i]);
        const x1 = xScale(maxSalary[i]);
        const yMid = yScale(dept) + yScale.bandwidth() / 2;
        const y = yMid - barHeight / 2;
        return (
          <g key={dept}>
            <rect
              x={Math.min(x0, x1)}
              y={y}
              width={Math.abs(x1 - x0)}
              height={barHeight}
              rx={4}
              fill={t.palette[0]}
              stroke={t.ink}
              strokeWidth={1}
            >
              <title>
                {dept}: ${minSalary[i]}k – ${maxSalary[i]}k
              </title>
            </rect>
            {/* Endpoint markers: small ink-ringed caps pin the exact min/max bounds. */}
            <circle
              cx={x0}
              cy={yMid}
              r={capRadius}
              fill={t.palette[0]}
              stroke={t.ink}
              strokeWidth={1}
            />
            <circle
              cx={x1}
              cy={yMid}
              r={capRadius}
              fill={t.palette[0]}
              stroke={t.ink}
              strokeWidth={1}
            />
          </g>
        );
      })}
    </g>
  );
}

// --- Chart (default-exported component — the harness mounts it) -------------
export default function Chart() {
  const chartHeight = window.ANYPLOT_SIZE.height - TITLE_HEIGHT;

  return (
    <div
      style={{
        width: window.ANYPLOT_SIZE.width,
        height: window.ANYPLOT_SIZE.height,
      }}
    >
      <div
        style={{
          height: TITLE_HEIGHT,
          lineHeight: `${TITLE_HEIGHT}px`,
          paddingLeft: 24,
          fontSize: 22,
          fontWeight: 500,
          color: t.ink,
        }}
      >
        {TITLE}
      </div>
      <BarChart
        width={window.ANYPLOT_SIZE.width}
        height={chartHeight}
        layout="horizontal"
        skipAnimation
        margin={{ left: 240, right: 40, top: 24, bottom: 70 }}
        series={[]}
        xAxis={[
          {
            min: axisMin,
            max: axisMax,
            domainLimit: "strict",
            valueFormatter: (v) => `$${v}k`,
            label: "Annual Base Salary ($ thousands)",
            labelStyle: { fontSize: 16 },
            tickLabelStyle: { fontSize: 14 },
          },
        ]}
        yAxis={[
          {
            scaleType: "band",
            data: departments,
            tickLabelStyle: { fontSize: 14 },
          },
        ]}
        grid={{ vertical: true }}
        slots={{ noDataOverlay: () => null }}
        slotProps={{ legend: { hidden: true } }}
      >
        <RangeBars />
      </BarChart>
    </div>
  );
}
Runnable source as JSON, for any HTTP client: https://api.anyplot.ai/specs/range-interval/muix/code. Any spec id and library id listed in llms-full.txt fit the same URL shape; every URL below is complete and callable.
{
  "spec_id": "range-interval",
  "language": "javascript",
  "library": "muix",
  "page": "https://anyplot.ai/range-interval/javascript/muix",
  "hub": "https://anyplot.ai/range-interval",
  "code_json": "https://api.anyplot.ai/specs/range-interval/muix/code",
  "spec_json": "https://api.anyplot.ai/specs/range-interval",
  "render_light_png": "https://storage.googleapis.com/anyplot-images/plots/range-interval/javascript/muix/plot-light.png",
  "render_dark_png": "https://storage.googleapis.com/anyplot-images/plots/range-interval/javascript/muix/plot-dark.png",
  "interactive_light_html": "https://storage.googleapis.com/anyplot-images/plots/range-interval/javascript/muix/plot-light.html",
  "interactive_dark_html": "https://storage.googleapis.com/anyplot-images/plots/range-interval/javascript/muix/plot-dark.html",
  "quality_score": 88.0,
  "license": "MIT",
  "guide": "https://anyplot.ai/llms.txt"
}
Part of Range Interval Chart on anyplot.ai.